The crypto market finds itself at a crossroads as geopolitical tensions rattle global financial markets. The crypto majors have barely budged today, with Bitcoin, Ethereum, XRP and all the rest down the line staying flat—for crypto standards anyway,
Total cryptocurrency market capitalization sits at $3.58 trillion, right around where it was yesterday. Bitcoin is struggling to hold above the $104,000 mark, again, right around where it was yesterday. XRP is trading for $2.14, and Ethereum is just above $2,500—both in the green, but only barely.
In the macro picture, the Israel-Iran conflict has sent oil prices surging 7%, with Brent crude touching $78, while traditional safe havens like gold see renewed interest. The S&P 500 hovers just below 6,000 points, reflecting broader market uncertainty as investors juggle inflation concerns, Federal Reserve policy decisions, and escalating Middle East tensions.
But there’s at least two coins making big moves today: one to the moon, the other into the earth.
Fartcoin: Meme coin mania gets a reality check
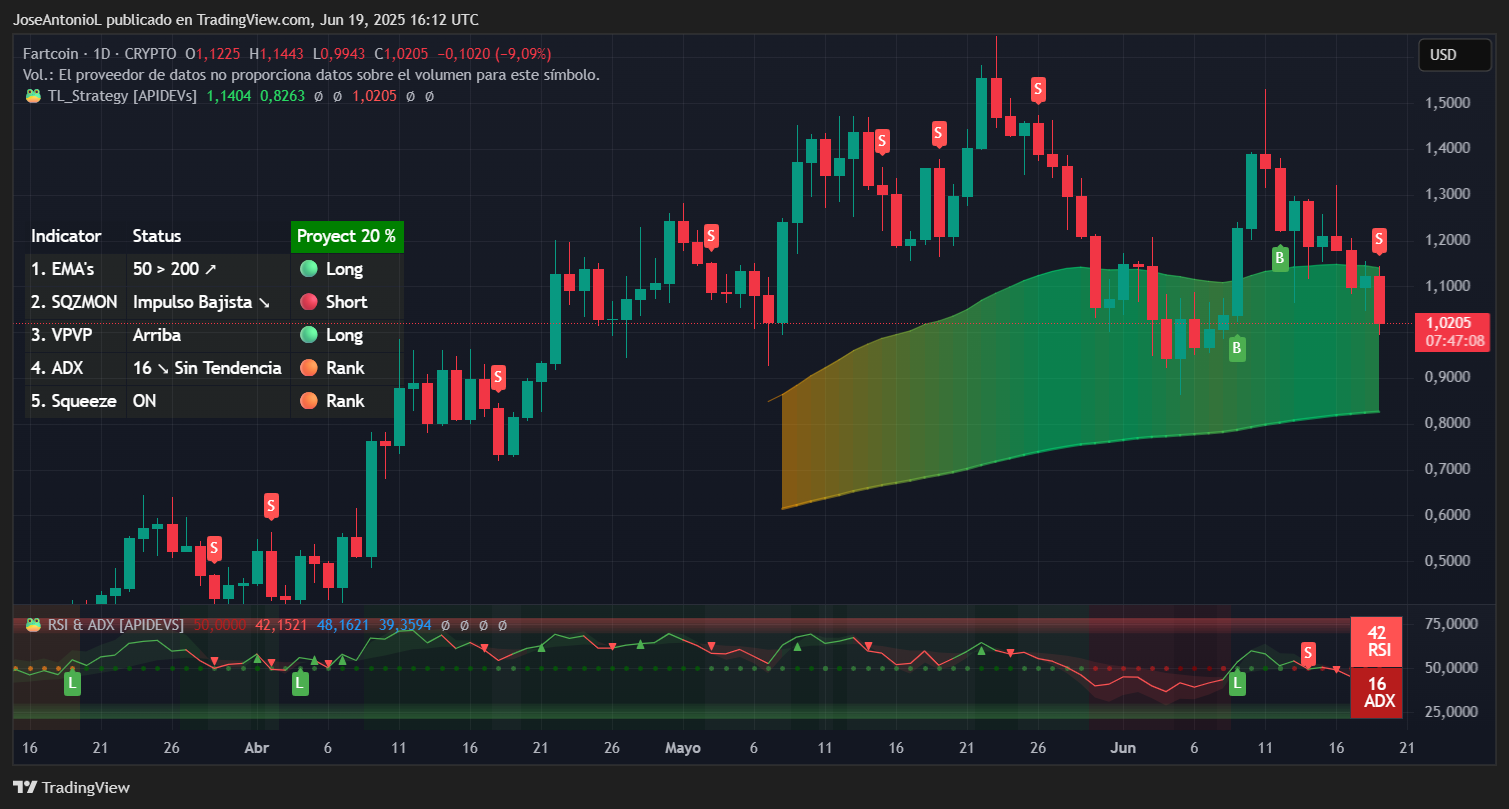
Fartcoin trading data. Image: TradingView
Fartcoin has become a bit of a favored token among meme coin traders. For one, because it’s funny and memes trade on vibes. But for another, the Solana-based token had been on a seemingly unstoppable journey upwards as “hot air rises.” Today, though, the vibes are down.
Fartcoin's 9.7% tumble today exemplifies the volatile nature of meme coin trading. The Binance.US listing helped spark the euphoria among degens, driving volume up 66% to $373 million, but reality quickly set in as profit-takers emerged. This "sell the news" pattern is a textbook reaction that experienced traders often anticipate.
The Relative Strength Index, or RSI, for Fartcoin sits at 42, nearing oversold territory—this metric measures momentum by comparing recent gains to losses, with readings below 50 suggesting bearish pressure is building. When RSI drops below 50, it often signals that sellers are gaining control, making short-term rebounds less likely.
The token’s Average Directional Index, or ADX, reads 16, indicating that the previous long-term bullish trend is losing its strength and is now weak. ADX measures how strong a price trend is regardless of direction—readings below 25 suggest the market lacks conviction, meaning traders should expect choppy, directionless action rather than sustained moves.
The Exponential Moving Averages for Fartcoin paint a bearish picture: the token is trading below the 50-day EMA ($1.21) and approaching the 200-day EMA ($1.02). When price falls below these key moving averages, it typically indicates that the short-term trend has turned negative, and traders often use these levels as dynamic resistance points to sell rallies. However, the short-term EMA is well over the long term EMA, which is still a good sign for long-term traders as a death cross (when the EMA 50 is below the EMA 200, meaning the average price of the coin a long time ago was much higher than buying it at recent prices) is not yet looking like a strong possibility.
Key Levels:
- Immediate support: $0.92-0.95 (Fibonacci 78.6% retracement)
- Strong support: $0.89 (May 2025 low)
- Immediate resistance: $1.20-1.21 (former support turned resistance)
- Strong resistance: $1.28-1.30 (recent rejection zone)
OKB: Crypto exchange token flexes deflationary muscle
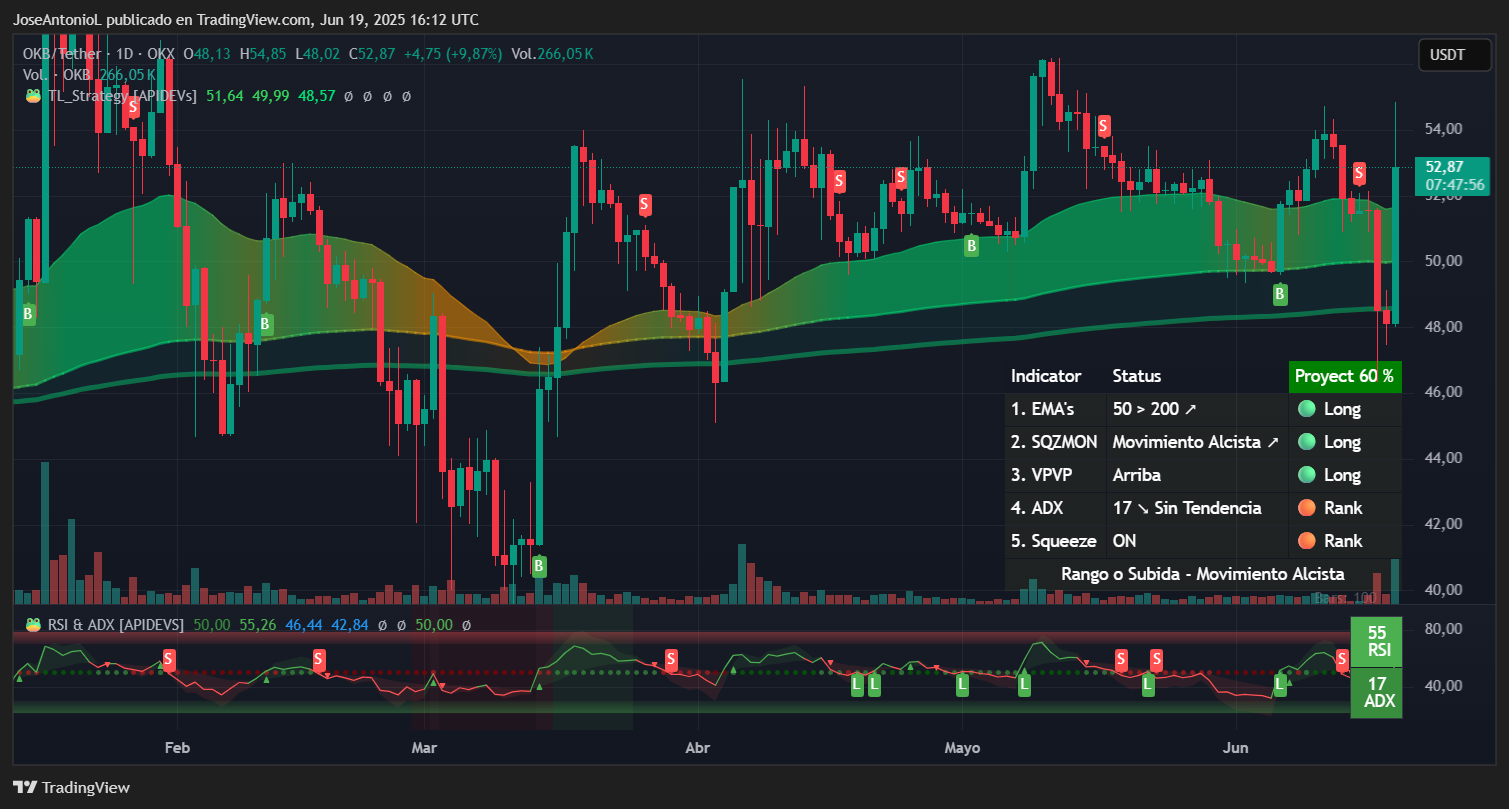
OKB trading data. Image: TradingView
But if Fartcoin is making degens cry of financial pain, OKB's impressive 13.5% surge is making its holders cry out of pure joy. Crypto exchange OKX’s token climbed all the way up to $54.70 before a minor correction to its current price of $52.87—still enough for a 9.87% price jump on the day.
OKX's 28th token burn removed 42.4 million OKB from circulation, representing 20% of the circulating supply—a move that typically creates immediate scarcity and drives prices higher as remaining tokens become more valuable.
OKB's RSI reading at 55.26 actually shows neutral-to-bullish momentum rather than oversold conditions. This suggests OKB has already recovered from oversold levels and is now in healthier territory above 50, which typically indicates bullish momentum when combined with price above key EMAs. However, this was likely an event-based move, so traders will want to wait and see if the trend continues after everyone sold the news.
The ADX at 17 shows the previous downtrend is losing steam. Combined with the oversold bounce, this suggests a potential trend reversal is underway, though experienced traders with an eye for technicals will wait for ADX to rise above 25 to confirm a new uptrend is established.
Price action shows OKB reclaiming the 23.6% Fibonacci retracement at $52.81—these levels act as natural support and resistance based on mathematical ratios traders widely monitor. Breaking above this level with volume suggests buyers are regaining control. It also broke past the EMA 50, which confirms this thesis.
As always, though, it’s impossible to say with certainty whether the move is just a reaction to big news or a natural correction that will maintain momentum over time.
Key Levels:
- Immediate support: $51.6 (50-day EMA)
- Strong support: $49-$50 (psychological level)
- Immediate and stronger resistance: $56 (May swing high)
The views and opinions expressed by the author are for informational purposes only and do not constitute financial, investment, or other advice.
免责声明:本文章仅代表作者个人观点,不代表本平台的立场和观点。本文章仅供信息分享,不构成对任何人的任何投资建议。用户与作者之间的任何争议,与本平台无关。如网页中刊载的文章或图片涉及侵权,请提供相关的权利证明和身份证明发送邮件到support@aicoin.com,本平台相关工作人员将会进行核查。


