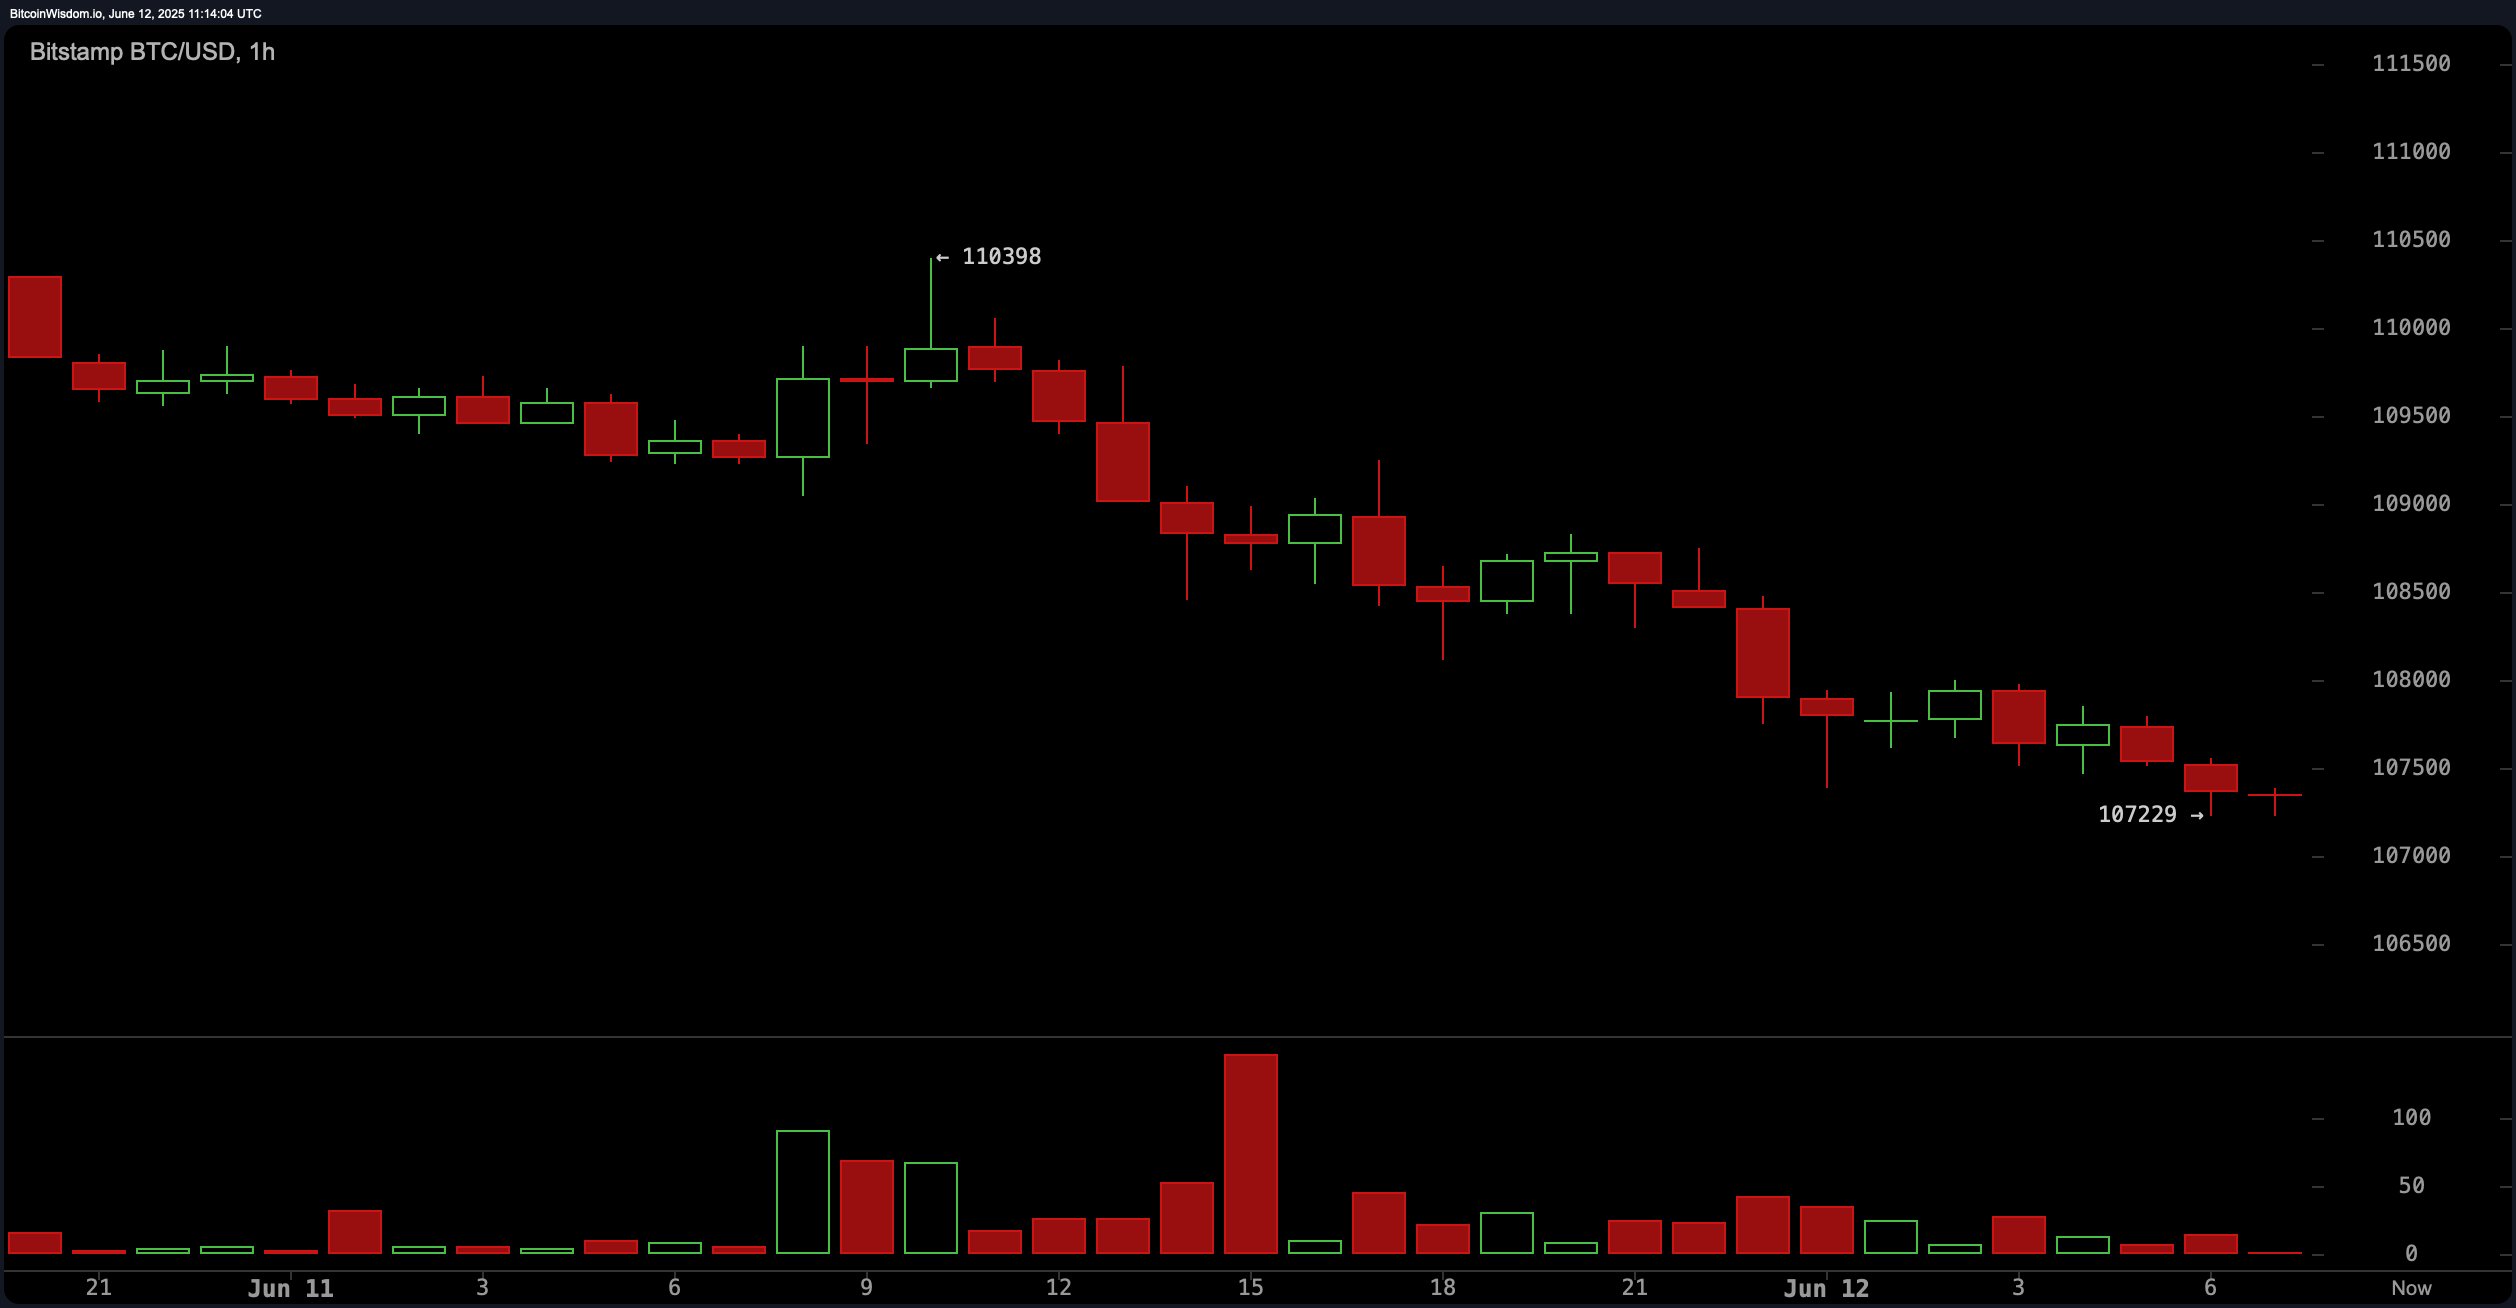
The 1-hour chart shows a sustained intraday downtrend, with bitcoin declining sharply since June 11. Bearish momentum dominates, characterized by extended red candles and negligible relief rallies. Support sits precariously at $107,229, while resistance is evident at $108,000. Notably, the relative strength index (RSI) is neutral at 55, but price action suggests sell-side control, corroborated by volume spikes during declines. The momentum oscillator indicates selling pressure with a value of 1,392, while the moving average convergence divergence (MACD) level at 1,343 also signals a bearish continuance.

BTC/USD 1-hour chart via Bitstamp on June 12, 2025.
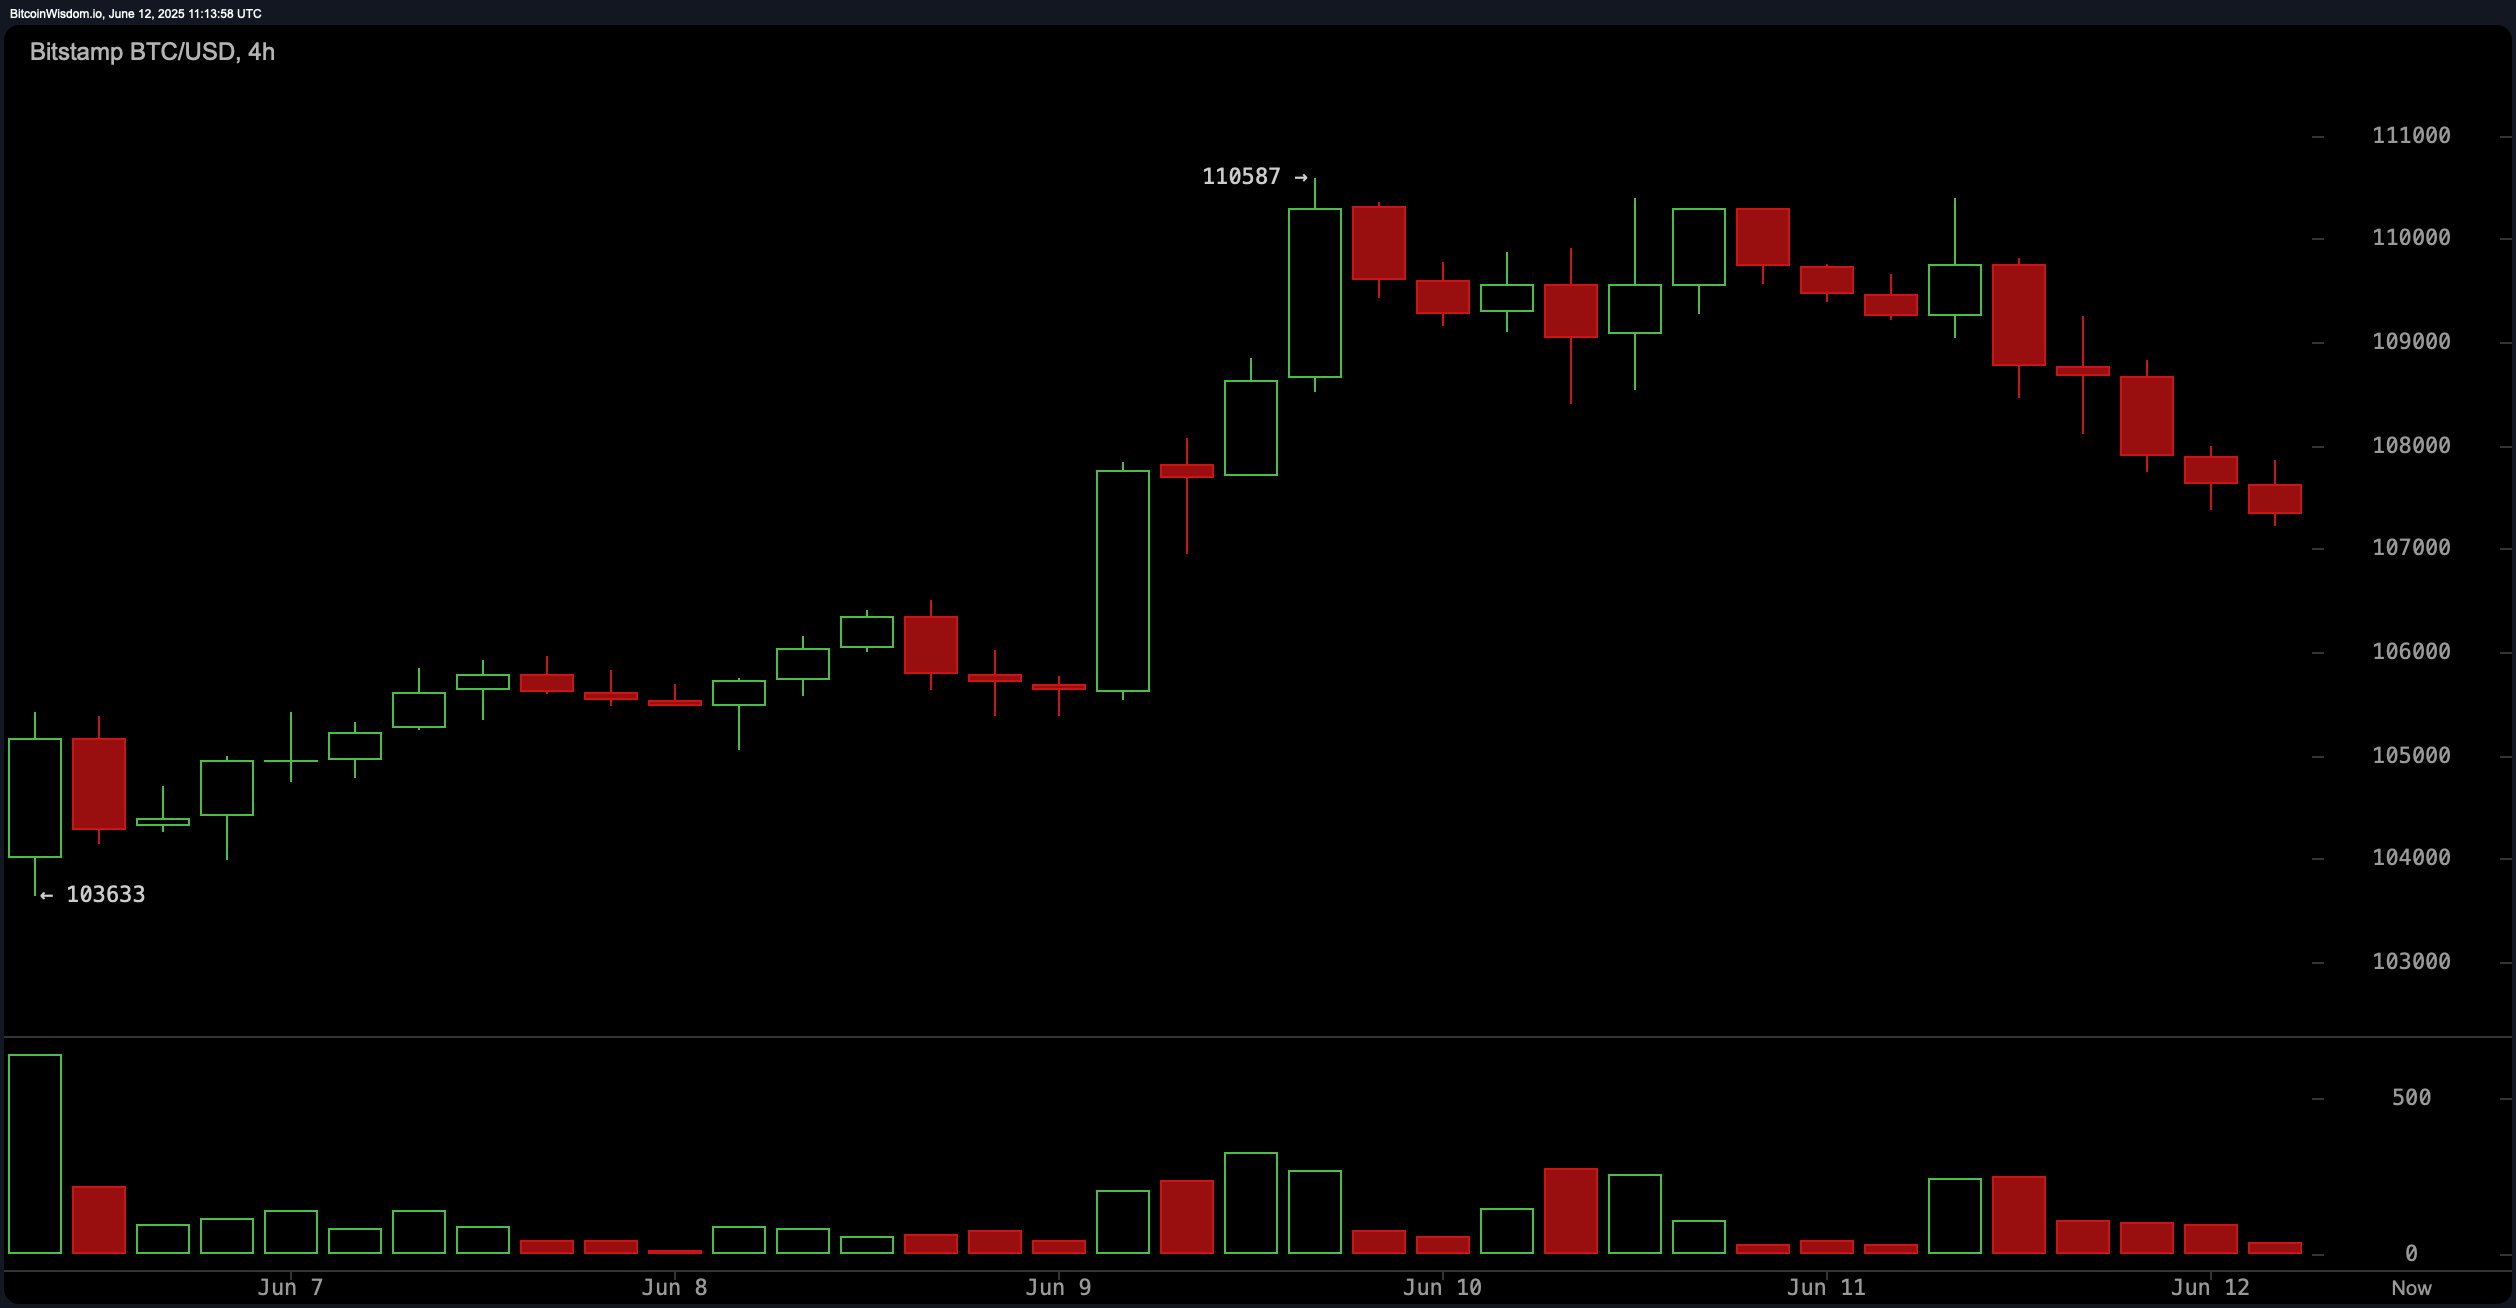
On the 4-hour chart, bitcoin recently topped at $110,587, forming a textbook blow-off top. Subsequent lower highs and lower lows define a correction phase, with failed rallies being met with immediate sell-offs. Resistance is firmly established between $108,000 and $109,000, making it a critical zone to watch for short-term traders. The Stochastic oscillator at 82 reflects an overbought condition, reinforcing a negative signal. A bearish bias remains until bitcoin convincingly reclaims $109,000 with rising volume.

BTC/USD 4-hour chart via Bitstamp on June 12, 2025.
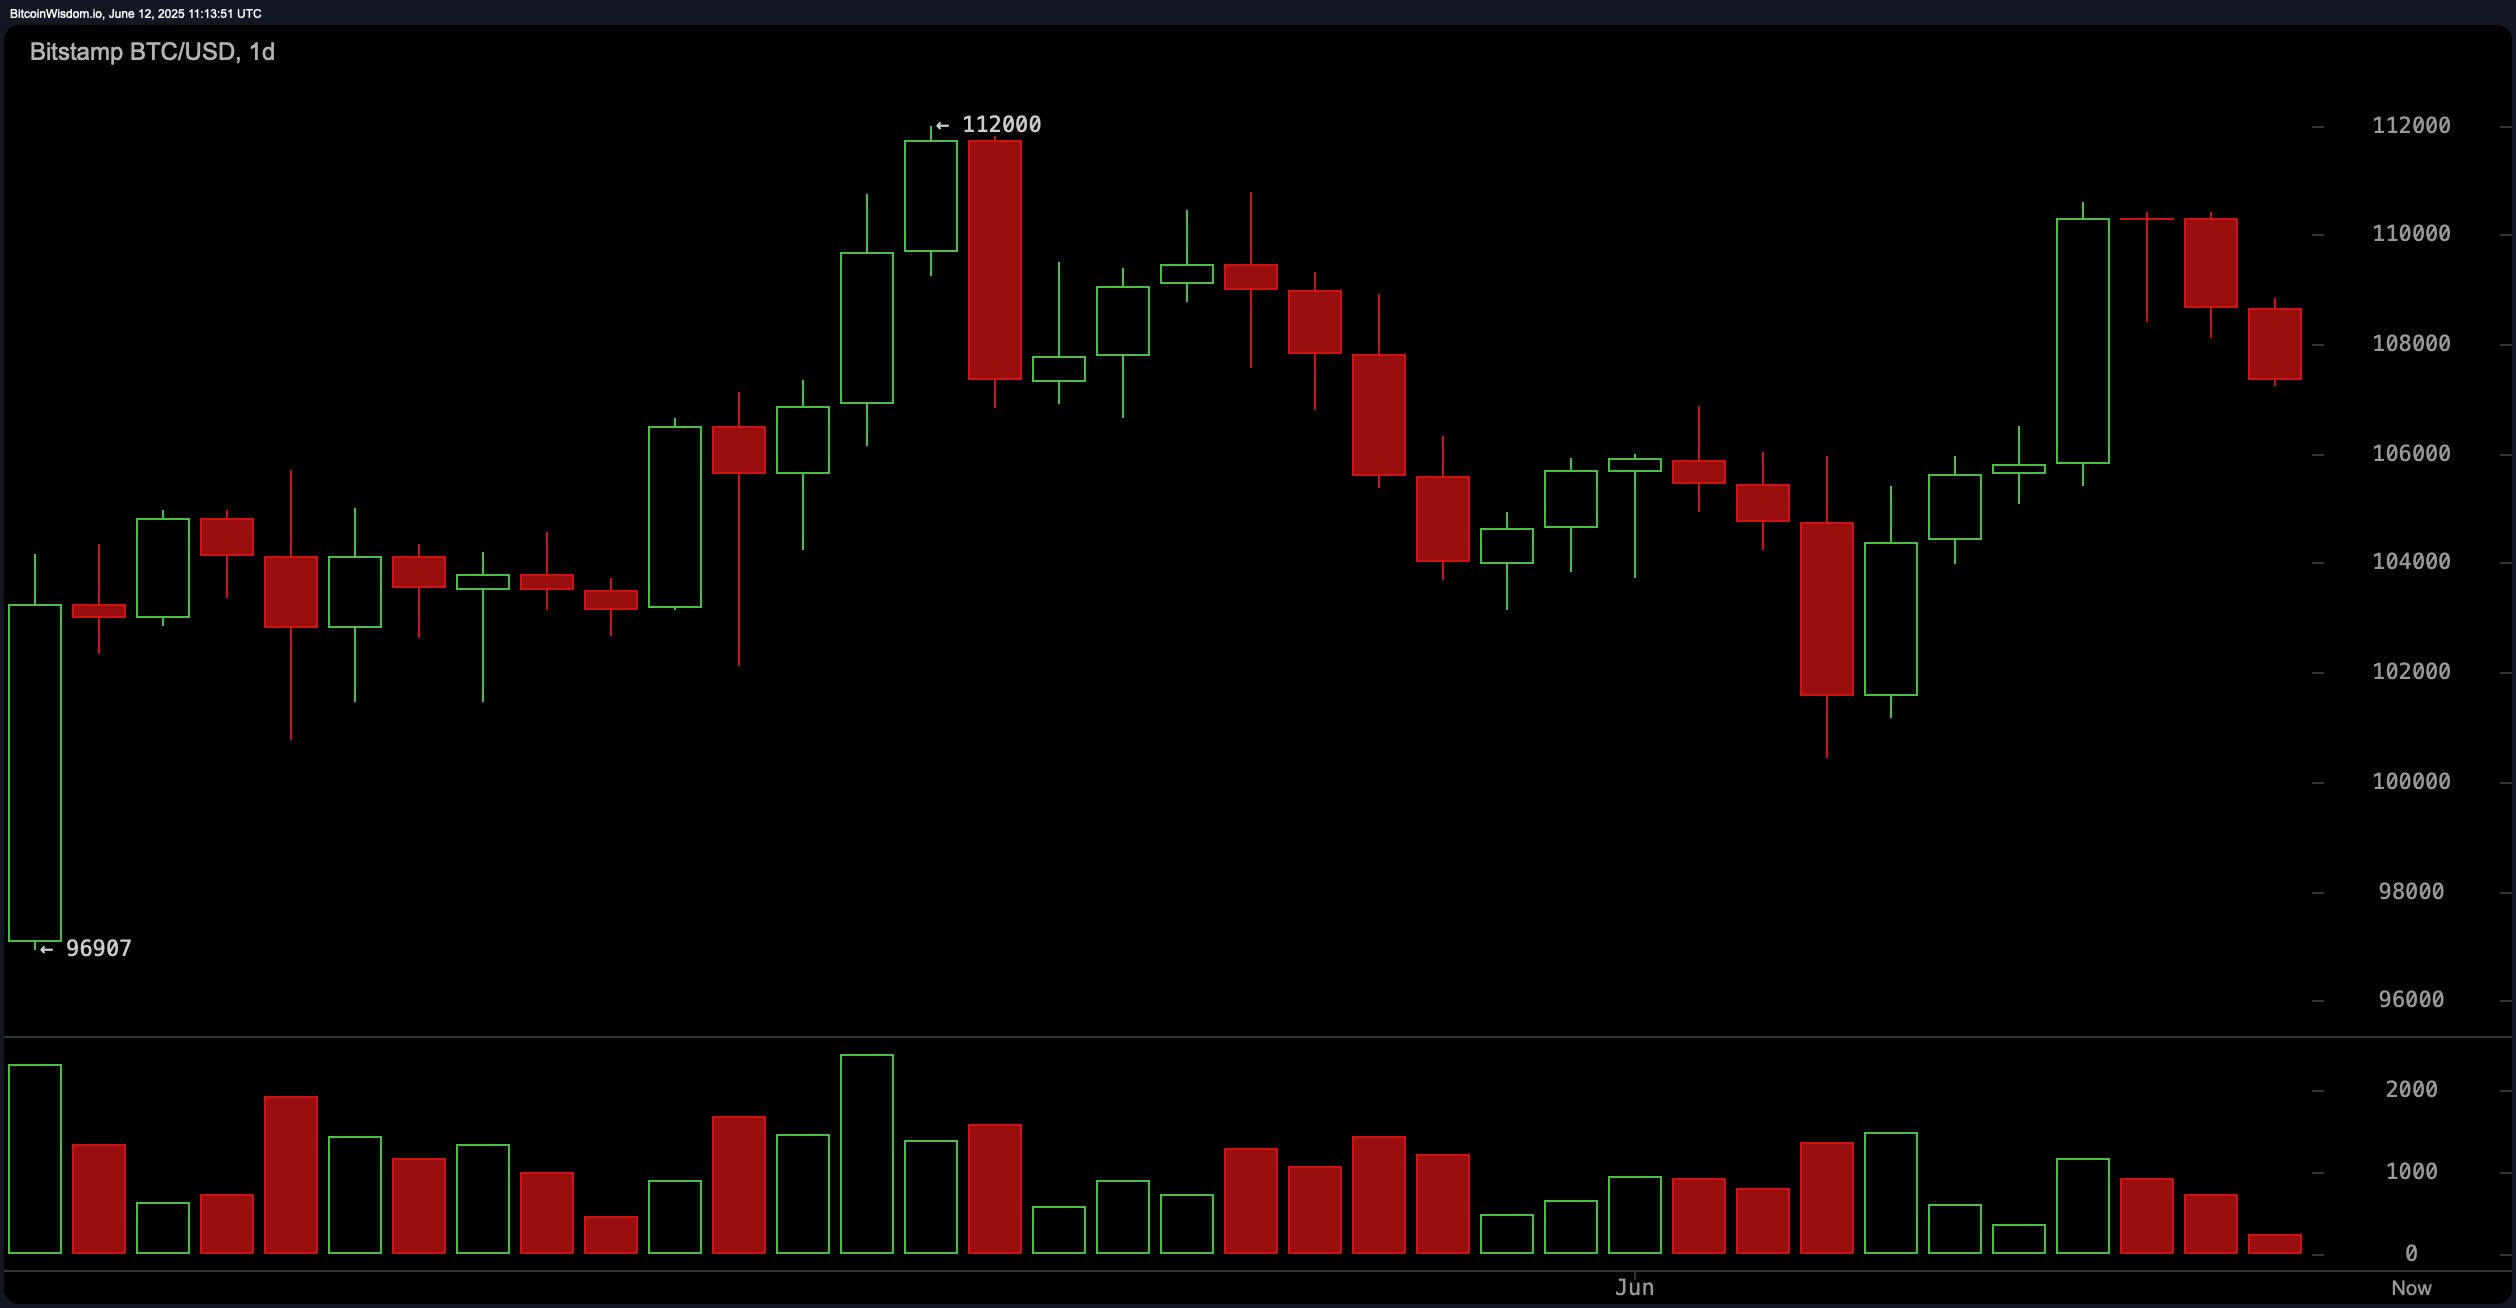
The daily BTC/USD chart reflects broader indecision in market sentiment following a rejection from the $112,000 resistance. A bearish engulfing pattern signaled a sharp pullback, while smaller-bodied candles with long wicks highlight the ongoing tug-of-war between bulls and bears. Support is tentatively holding at the $102,000 level. Moving averages provide a bullish backdrop, with all key exponential and simple moving averages from the 10-period to 200-period pointing to bullish signals. However, neutral readings from the RSI, commodity channel index (CCI), average directional index (ADX), and Awesome oscillator temper the bullish outlook, suggesting a wait-and-see approach until a breakout from current consolidation emerges.

BTC/USD 1-day chart via Bitstamp on June 12, 2025.
Across oscillators, the technical sentiment is mixed. The RSI at 55 and CCI at 41 both register neutral, indicating a lack of momentum in either direction. Meanwhile, the MACD and momentum indicators signal selling pressure, while the Stochastic suggests overbought conditions. The ADX, reading 17, confirms a weak trend. The Awesome oscillator at 2,106 also remains neutral. This divergence across tools emphasizes caution, with no definitive trend alignment and oscillators hinting at a potential reversal or further drift.
Moving averages (MAs), however, paint a more constructive picture. All primary exponential moving averages (EMA) and simple moving averages (SMA) — from the 10-period to the 200-period — are in alignment on the buy side. The 10-period EMA and SMA are at $107,224 and $106,412 respectively, both above current price levels, suggesting short-term bullish support. Longer-term averages like the 200-period EMA at $92,442 and SMA at $95,524 highlight a sustained bullish trend over the past several months. This divergence between moving averages and oscillator data encapsulates the current market phase: long-term strength amid short-term correction.
Bull Verdict:
If bitcoin can reclaim the $109,000–$110,000 zone with conviction and rising volume, especially on the 4-hour and daily charts, it would signal a strong bullish continuation. Combined with the uniformly bullish signals from all major exponential and simple moving averages, such a breakout could reestablish upward momentum toward retesting the $112,000 resistance and potentially setting new yearly highs.
Bear Verdict:
Persistent rejections below $108,000 and a decisive break beneath the $107,000 support would confirm the continuation of the current short-term downtrend. With multiple oscillators—such as the MACD, Stochastic, and momentum—flashing sell signals, and a bearish structure on both the 1-hour and 4-hour charts, bitcoin could revisit the $102,000 support zone, with a risk of deeper retracement if that level fails.
免责声明:本文章仅代表作者个人观点,不代表本平台的立场和观点。本文章仅供信息分享,不构成对任何人的任何投资建议。用户与作者之间的任何争议,与本平台无关。如网页中刊载的文章或图片涉及侵权,请提供相关的权利证明和身份证明发送邮件到support@aicoin.com,本平台相关工作人员将会进行核查。


