一、引言
作为全球市值最大的加密资产,比特币的价格波动历来吸引着市场高度关注。4月和10 月被称为比特币行情的“黄金窗口期”。那么比特币价格走势真的存在明显的季节性规律吗?某些月份是否更容易上涨或下跌?如果这种规律存在,其背后的原因又是什么?更重要的是,这种历史规律能否为未来的投资决策提供指引?
事实上,比特币自诞生以来已有十余年的交易历史,大量数据表明,它的价格表现确实存在显著的月度规律和季节性特点。例如,一年中的某些月份(如10月、11月)倾向于上涨,而另一些月份(如9月)则通常表现疲软。这些规律看似巧合,却背后隐藏着复杂的市场周期和宏观经济因素。
本研究将深入探讨比特币历年各个月份的价格表现特点,结合宏观经济背景,分析其背后的市场逻辑与可能原因,并对2025年下半年的走势进行分析与预测,帮助投资者更好地理解比特币季节性走势规律,做出更为明智的投资决策。
二、比特币历史月度表现规律分析
通过对比特币2013年至2024年每个月的历史价格表现进行统计和分析,我们发现比特币价格确实存在显著的月度季节性规律。不同月份的表现差异明显,有些月份明显倾向于上涨,而另一些则较容易出现下跌。
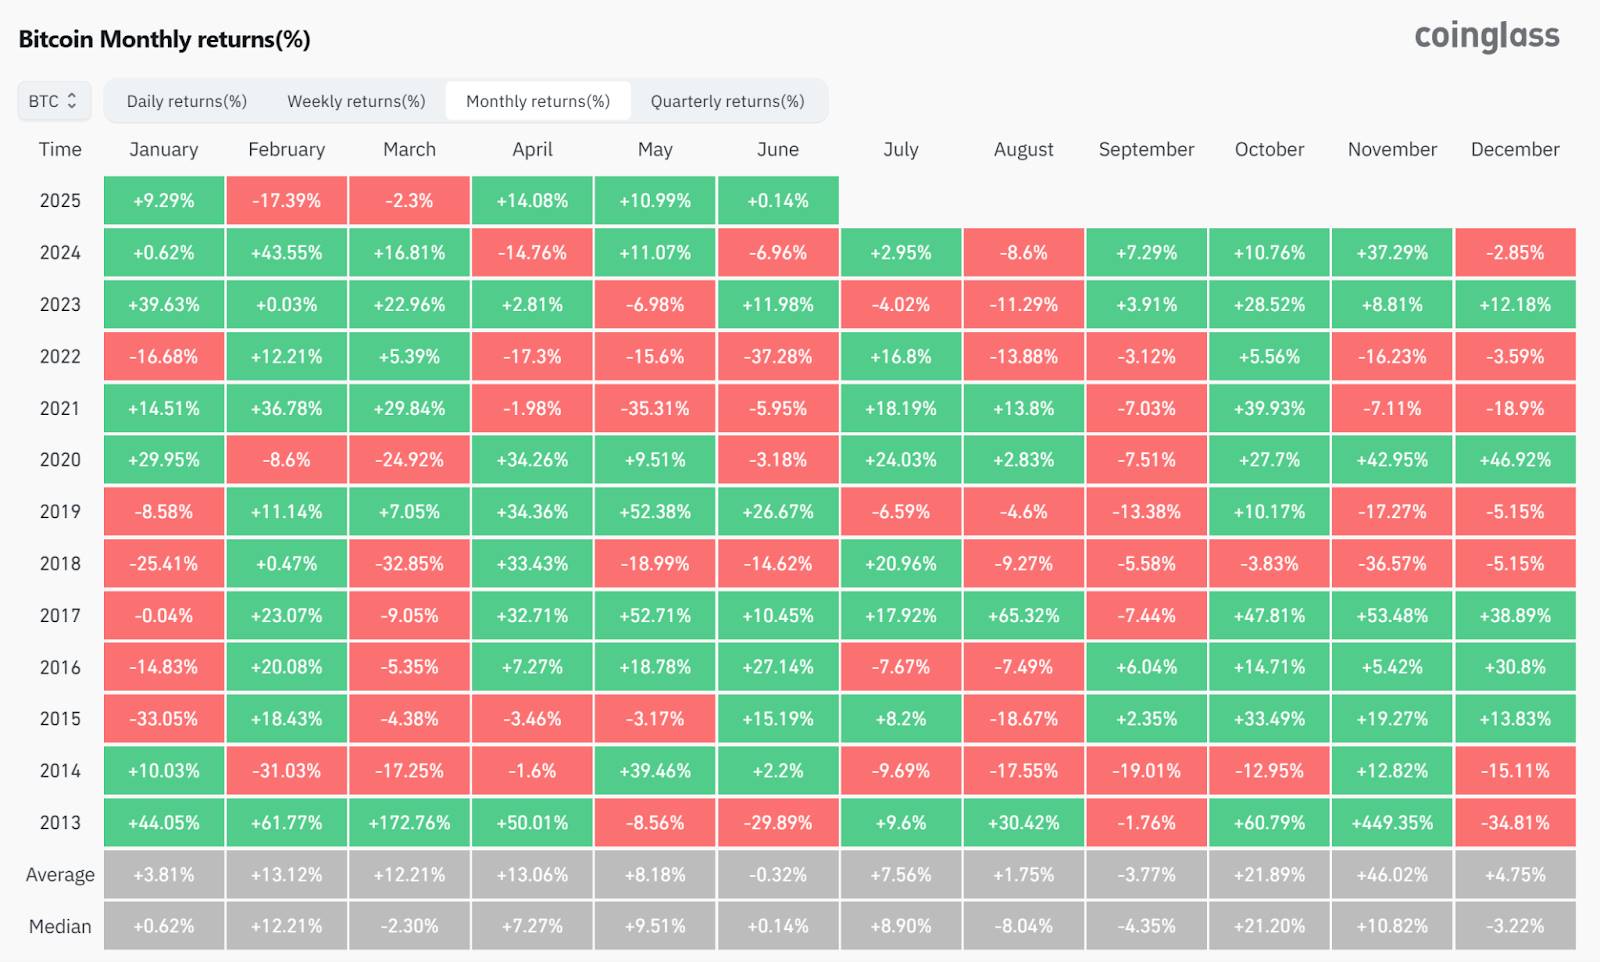
来源:https://www.coinglass.com/today
1.表现最强劲的月份:2月、10月、11月
从历史数据统计看,比特币在2月、10月和11月通常表现突出:
- 2月比特币往往发行显著上涨。数据显示,自2013年以来,2月多次出现大幅上涨,比如2024年上涨43.55%、2021年上涨36.78%、2013年上涨61.77%。平均来看,2月的平均涨幅达到13.12%,体现出稳定的强势特征。
- 10月也属于明显利好的月份,整体上涨概率较高,历史平均涨幅21.89%,表现稳定且可靠。值得注意的是,2013年10月上涨60.79%、2017年上涨47.81%、2020年上涨27.7%,均显著高于全年其他多数月份。
- 11月是全年最显著上涨的月份,历史平均涨幅最高。例如,2020年11月上涨42.95%、2021年上涨39.93%、2025年上涨37.29%。尤其是在牛市期间(如2020年),11月的强劲表现十分显著。
2.表现疲软的月份:1月、8月、9月
相比之下,历史数据中比特币价格表现较弱的月份集中在1月、8月和9月:
- 1月在历史上表现较差,常见较大跌幅,例如2015年1月下跌33.05%、2018年下跌25.41%、2022年下跌16.68%,月度平均涨幅较低,仅为3.81%。虽然2020年和2023年有所上涨,但整体来看风险偏高。
- 8月同样较弱,经常出现负收益,月度平均涨幅为1.75%。例如2022年8月下跌13.88%、2024年8月下跌8.6%、2014年8月下跌17.55%,市场情绪整体偏向负面。
- 9月尤其值得关注,素有“九月魔咒”之称,月均跌幅达到-3.77%,明显弱于其他月份。例如,2019年9月下跌13.38%、2022年下跌3.12%、2014年下跌19.01%,表现普遍疲软。
3.表现波动较大的月份:4月、5月、7月
一些月份的表现虽然整体偏好,但波动性极强:
- 4月整体表现较佳,历史平均涨幅13.06%。例如2013年4月上涨50.01%、2020年上涨34.26%、2018年上涨33.43%,但也出现过较大的跌幅,如2024年下跌14.76%、2022年下跌17.3%,波动较大。
- 5月被称为市场的“魔鬼月份”,剧烈波动频繁。例如,2017年5月上涨52.71%、2019年上涨52.38%,但2021年却暴跌35.31%、2022年再跌15.6%。这种极端波动令投资者往往难以把握市场节奏,虽然月均涨幅为8.18%,但波动风险明显较高。
- 7月表现总体积极,月度平均涨幅为7.56%,但历史上亦多次大涨与大跌交织。比如2020年7月上涨24.03%、2021年上涨18.19%、2017年上涨17.92%,但波动性较大,投资者需做好风险管理。值得注意的是,在过去几年中,6月如果出现明显下跌,紧随其后的7月往往会迎来大幅反弹。
4.转折过渡月份:3月、6月、12月
- 3月和6月的表现相对中性,3月平均涨幅12.21%、6月接近于零(-0.32%),总体上属于难以明确判断方向的月份,但3月略强于6月。6月常为行情转折的过渡月。
- 12月表现相对平稳,历史平均涨幅4.75%,存在年底资金结算和假期效应的影响,经常出现高位震荡或温和上涨。
综合以上历史表现规律,我们可以大致描绘出比特币价格的季节性特征:每年年初(1月)往往走势偏弱,春季(2月、4月)常有不错的涨势,夏季月份表现分化(7月强于6月和8月),而秋季初的9月屡屡成为全年低谷,随后四季度(10月-12月)大概率迎来上涨行情。这种规律在不同年份虽有偏差,但总体趋势相当明显。需要指出的是,尽管历史规律显著,但每年具体市场环境和宏观经济情况的变化也可能带来一定差异。
三、比特币月度表现规律原因分析
比特币价格出现月度季节性趋势现象并非巧合,而是由多重市场逻辑和周期因素驱动的。其背后,既有加密市场自身的周期规律,也受到宏观经济环境的影响。
1.市场周期和资金流影响
比特币历来的“四年周期”对季节性有重要影响。比特币每约四年产量减半一次,减半后通常会在接下来1-2年内引发一轮牛市行情。在这一周期驱动下,不少历史牛市的巅峰都出现在第四季度。例如2013年和2017年的历史高点均出现在11月-12月,2021年牛市高点则在11月。这就导致统计上Q4月份,尤其10月、11月,平均涨幅巨大,因为多轮牛市的爆发阶段集中在年末。而牛市见顶后的熊市往往从岁末年初开始,拖累随后数月行情偏弱,例如2018年初、2022年初的熊市跌势,使得1月成为平均回报率为负的月份之一。
2.宏观经济和传统市场的季节效应
宏观经济环境和传统市场的季节效应也渗透到加密市场中。很多投资者会参考传统金融市场的节奏,例如“Sell in May”的避险倾向。这在比特币上有所体现:每年5月后资金面趋紧或避险情绪升温,导致5-6月行情疲软,而到了下半年尤其秋季,资金重新入场。同时,美国等主要经济体的财年周期和税收周期可能也影响加密投资者行为。举例来说,美国投资者每年4月报税季可能造成资金从市场抽离用于缴税,这被认为是比特币有时在3-4月出现抛压的原因之一。而报税截止后,市场压力缓解,4月中下旬往往迎来价格反弹,这与历史上4月总体上涨的统计相符。
3.宏观数据发布和政策周期
宏观环境的季节性(如年中利率政策转向、年底资金结算等)往往与比特币价格季节性规律叠加,放大某些月份的涨跌幅。美联储的议息会议及利率决策通常在每年的特定月份(如3月、6月、9月、12月)进行,对全球风险资产产生冲击。比特币作为高波动性资产,也会出现这些时间窗口的短期波动。从历史数据看,如果美联储在上半年收紧货币政策,往往对应比特币在春夏之交表现不佳;反之,一旦进入宽松周期或市场预期转向宽松,比特币往往逐步走强。美元指数的强弱与比特币价格也呈反向相关关系。当美元走弱,通常几个月后会传导出比特币的上涨行情。例如,2020年美联储大放水后美元指数大跌,随后2020下半年至2021年的比特币价格出现了爆发式上涨;相反,2022年美元指数飙升至20年高位时,比特币进入漫长熊市。到了2024-2025年,随着通胀率从高位回落、美联储加息进程在2023年底结束,宏观流动性环境较之前明显改善。市场普遍预期美联储将在2024-2025年转向降息周期,这为比特币提供了更有利的外部条件。
4.投资者心理与市场参与度
每年年底假期和新年伊始,市场参与度、交易量都会有所下降或变化,这可能导致年底出现获利回吐或整理行情,以及年初走势偏弱的现象。而到了春季和第四季度,重大会议,如美联储FOMC会议尘埃落定,和新年度的资金开始配置,都会提升市场风险偏好,使比特币价格更容易上涨。特别是第四季度往往充满“全年业绩冲刺”和节日效应,许多投资者希望抓住年底行情,这也推高了比特币在年末月份的表现。
综上,比特币的月度走势规律是市场内部周期和外部宏观周期共同作用的结果:减半驱动的牛熊交替决定了某年整体的多空基调,而宏观环境和投资节奏则影响着资金何时进场观望、何时情绪高涨。在大多数年份里,这些因素共同塑造了我们在统计上观察到的季节性模式。但是每年的具体情况可能因为政策监管、黑天鹅事件等突发事件而偏离平均轨迹。
四、2025年宏观经济环境与市场背景
全球宏观经济正处于多重变量交织的转折期。美国经济增速放缓、通胀趋稳但黏性仍强,货币政策从紧向松的转折正在酝酿之中。与此同时,地缘政治紧张、国际贸易壁垒上升、全球制造链重构等因素不断推高全球系统性风险,影响着资本流向和投资者风险偏好。传统资产市场与加密市场的表现亦呈现出机构主导、散户趋于保守的分化局面。
1.美国宏观政策:谨慎宽松与新一轮贸易摩擦
2025年上半年,美国经济增长动能持续减弱。第一季度实际GDP年化增速仅为+0.3%,失业率在4月升至4.2%。整体通胀持续下行,美联储在通胀与就业之间保持谨慎平衡。自2024年12月起,美联储将联邦基金利率稳定在4.25%-4.50%,截至2025年6月尚未正式启动降息。尽管市场普遍预期美联储将在第三季度内进行首次降息,但FOMC声明多次强调“需看到更多经济疲软与核心通胀下降的确凿证据”。这使得政策预期与市场博弈仍在持续。
2025年5月美国白宫宣布对中国制造的电动车、电池、半导体等关键技术产品大幅加征关税,平均提高至60%-100%,重新激化中美贸易摩擦。中国迅速反击,提出对美进口芯片及农业产品加征报复性关税。这场“再全球化”背景下的贸易政策转向,直接影响全球供应链稳定性,并引发资本市场对于未来通胀再度抬头的担忧。
2.全球安全局势:冲突升温带动避险情绪回潮
2025年全球安全局势并未明显改善,甚至出现新的风险升级:
- 乌克兰战事延宕至第三年,尽管欧美援助减少,前线仍处于胶着状态;
- 中东地区局势再度紧张,以色列与黎巴嫩边境冲突升级,伊朗核问题重燃市场担忧;
- 东亚海域局势不稳,多国在南海与台湾海峡持续军演,引发供应链中断风险上升。
这些不确定因素推高了投资者对“系统性黑天鹅”的担忧。4月至6月,黄金价格升破3000美元,创历史新高,美债与比特币等资产出现同步吸金现象,反映市场广义避险情绪走强。
3.传统市场风险偏好:从追逐增长转向结构防御
美股延续结构性牛市,但涨势明显集中在“超级科技股”与人工智能概念板块。标准普尔500指数上半年上涨约6.2%,但中小盘企业表现疲弱。纳斯达克指数依赖五大科技权重股上行,估值泡沫迹象初现。
债市方面,机构配置再度偏向长期美债,收益率曲线陡峭度下降,说明市场对未来降息周期仍存预期。高收益债与新兴市场债券则出现资金外流。
在整体资金流向中,散户投资者更加保守,偏好低波动的ETF与短久期债券;机构资金则表现出“超配黄金、增配比特币”的新趋势。
4.加密市场结构:机构持续入场,监管博弈未决
尽管全球经济充满不确定性,比特币在2025年上半年仍展现出强大韧性。价格于5月突破历史高点11万美元后进入震荡整理区间,截至6月维持在10.3万-10.5万美元之间,波动收窄但底部支撑强劲。
主要驱动因素为美国现货比特币ETF的持续资金净流入。截至6月,BlackRock、Fidelity、ARK等机构管理的比特币ETF资产规模已经突破1300亿美元。机构对比特币的认知从“投机标的”转向“数字黄金+对冲工具”的角色。
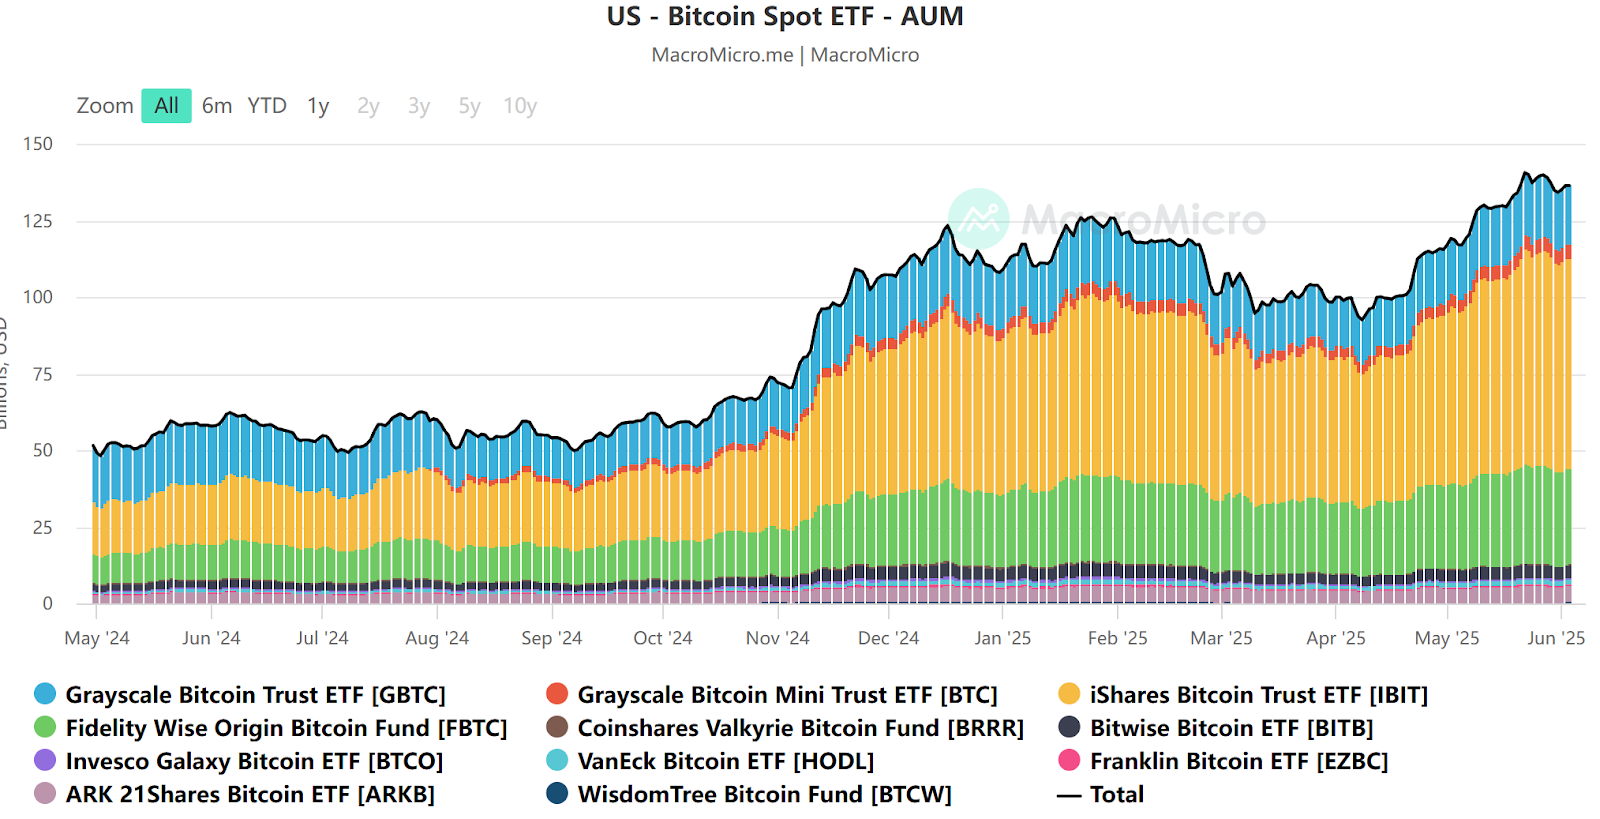
来源:https://en.macromicro.me/collections/3785/crypto/122014/us-bitcoin-spot-et-faum
链上数据进一步印证了市场结构变化:比特币长期持有者比例创历史新高,短期活跃地址数与链上交易笔数同比下降超过20%,Meme币、Altcoin热度显著回落,整个市场进入“主资产主导、主题投机降温”的成熟阶段。
监管层面,美国SEC内部仍在围绕稳定币监管、DeFi归属等展开政策协调,预计年底前将成为重点议题。这一系列因素促使加密市场的核心流动性逐渐从“散户炒作热钱”向“机构长期配置资金”过渡,使比特币具备更强的周期抗压能力。
五、2025年6-12月走势展望与总结
结合上述历史数据规律和当前宏观经济环境,我们对2025年下半年的比特币月度走势做出尝试性展望,基于历史统计趋势,并融入当下现实逻辑,如经济周期、美联储政策走向、市场情绪等因素,希望为投资者风险管理提供了一种参考角度。
- 6 月: 一向多空对半。美联储仍按兵不动,降息预期延后,比特币大概率围绕10–11 万美元横盘,震幅收窄,宜观望而非追涨。
- 7 月: 历史上涨概率约七成。一旦 6 月整理充分且 FOMC 会议释放鸽派信号,首降或启动,资金有望借势推高。看好“低开高走”,月涨幅可望达两位数。
- 8 月: 传统“夏季低迷”。机构度假、成交缩量,技术回调压力显现,叠加无重磅宏观事件,行情料震荡偏弱,守住前期支撑为要。
- 9 月: “九月魔咒”仍需提防。季末再平衡+二次议息若降息幅度不及预期,恐触发 10–15% 的深度调整;跌破关键均线则需严控杠杆。
- 10 月: “Uptober”大概率重演。若三季度已启动降息,其流动性效应将在四季度放大;距上一轮减半 18 个月,历史上往往进入牛市主升段。关注量价齐升与链上活跃度复苏,月度涨幅可观。
- 11 月: 历来最强月份,也是潜在拐点。若市场情绪被 10 月催化至极致,11 月或出现快速冲顶,挑战 18–20 万美元并伴剧烈波动。
- 12 月: 走势取决于 11 月。若 11 月冲顶,12 月多见降温回吐;若 11 月温和,12 月或延续慢牛。假期流动性下降,成交清淡易放大振幅,全年收官价大概率仍高于年初一倍以上。
总结:根据比特币历史季节性规律和2025年的宏观背景,我们预计2025年下半年比特币将在曲折中继续抬升。6-9月或有反复和调整,但10-12月有望迎来强劲上涨甚至刷新历史纪录。但需要注意,加密市场具有高波动和不确定性,黑天鹅事件可能随时打破既有规律。因此,在把握“大趋势”机遇的同时,更要做好风险管理和策略应对。“历史不会简单重复,但会押着相似的韵脚。” 在即将到来的2025年下半年,比特币能否再度印证历史经验,让我们拭目以待!
关于我们
Hotcoin Research 作为 Hotcoin 生态的核心投研中枢,专注为全球加密资产投资者提供专业深度分析与前瞻洞察。我们构建"趋势研判+价值挖掘+实时追踪"三位一体的服务体系,通过加密货币行业趋势深度解析、潜力项目多维度评估、全天候市场波动监测,结合每周双更的《热币严选》策略直播与《区块链今日头条》每日要闻速递,为不同层级投资者提供精准市场解读与实战策略。依托前沿数据分析模型与行业资源网络,我们持续赋能新手投资者建立认知框架,助力专业机构捕捉阿尔法收益,共同把握Web3时代的价值增长机遇。
风险提示
加密货币市场的波动性较大,投资本身带有风险。我们强烈建议投资者在完全了解这些风险的基础上,并在严格的风险管理框架下进行投资,以确保资金安全。
Website:https://lite.hotcoingex.cc/r/Hotcoinresearch
Mail:labs@hotcoin.com
免责声明:本文章仅代表作者个人观点,不代表本平台的立场和观点。本文章仅供信息分享,不构成对任何人的任何投资建议。用户与作者之间的任何争议,与本平台无关。如网页中刊载的文章或图片涉及侵权,请提供相关的权利证明和身份证明发送邮件到support@aicoin.com,本平台相关工作人员将会进行核查。


