如果当前趋势持续,$2的心理障碍可能不会再持续太久,因为XRP再次在考验关键支撑位。在被$2.20的阻力区明确拒绝后,该资产进入了下行阶段,错过了早期暗示更强劲突破的动能。拒绝发生在XRP接近下降三角形的上限时,除非通过高成交量的突破来反驳,否则通常表明看跌延续。
从技术分析来看,XRP显示出逐渐且脆弱的反转迹象,当前徘徊在100 EMA之上。然而,反弹缺乏信心;成交量依然低迷,动能指标如RSI徘徊在45附近的中性区域,给多头提供的信心有限。从这个水平的激进反弹并没有得到任何强劲的看涨背离的支持,正如相对强弱指数缺乏超卖条件所示。
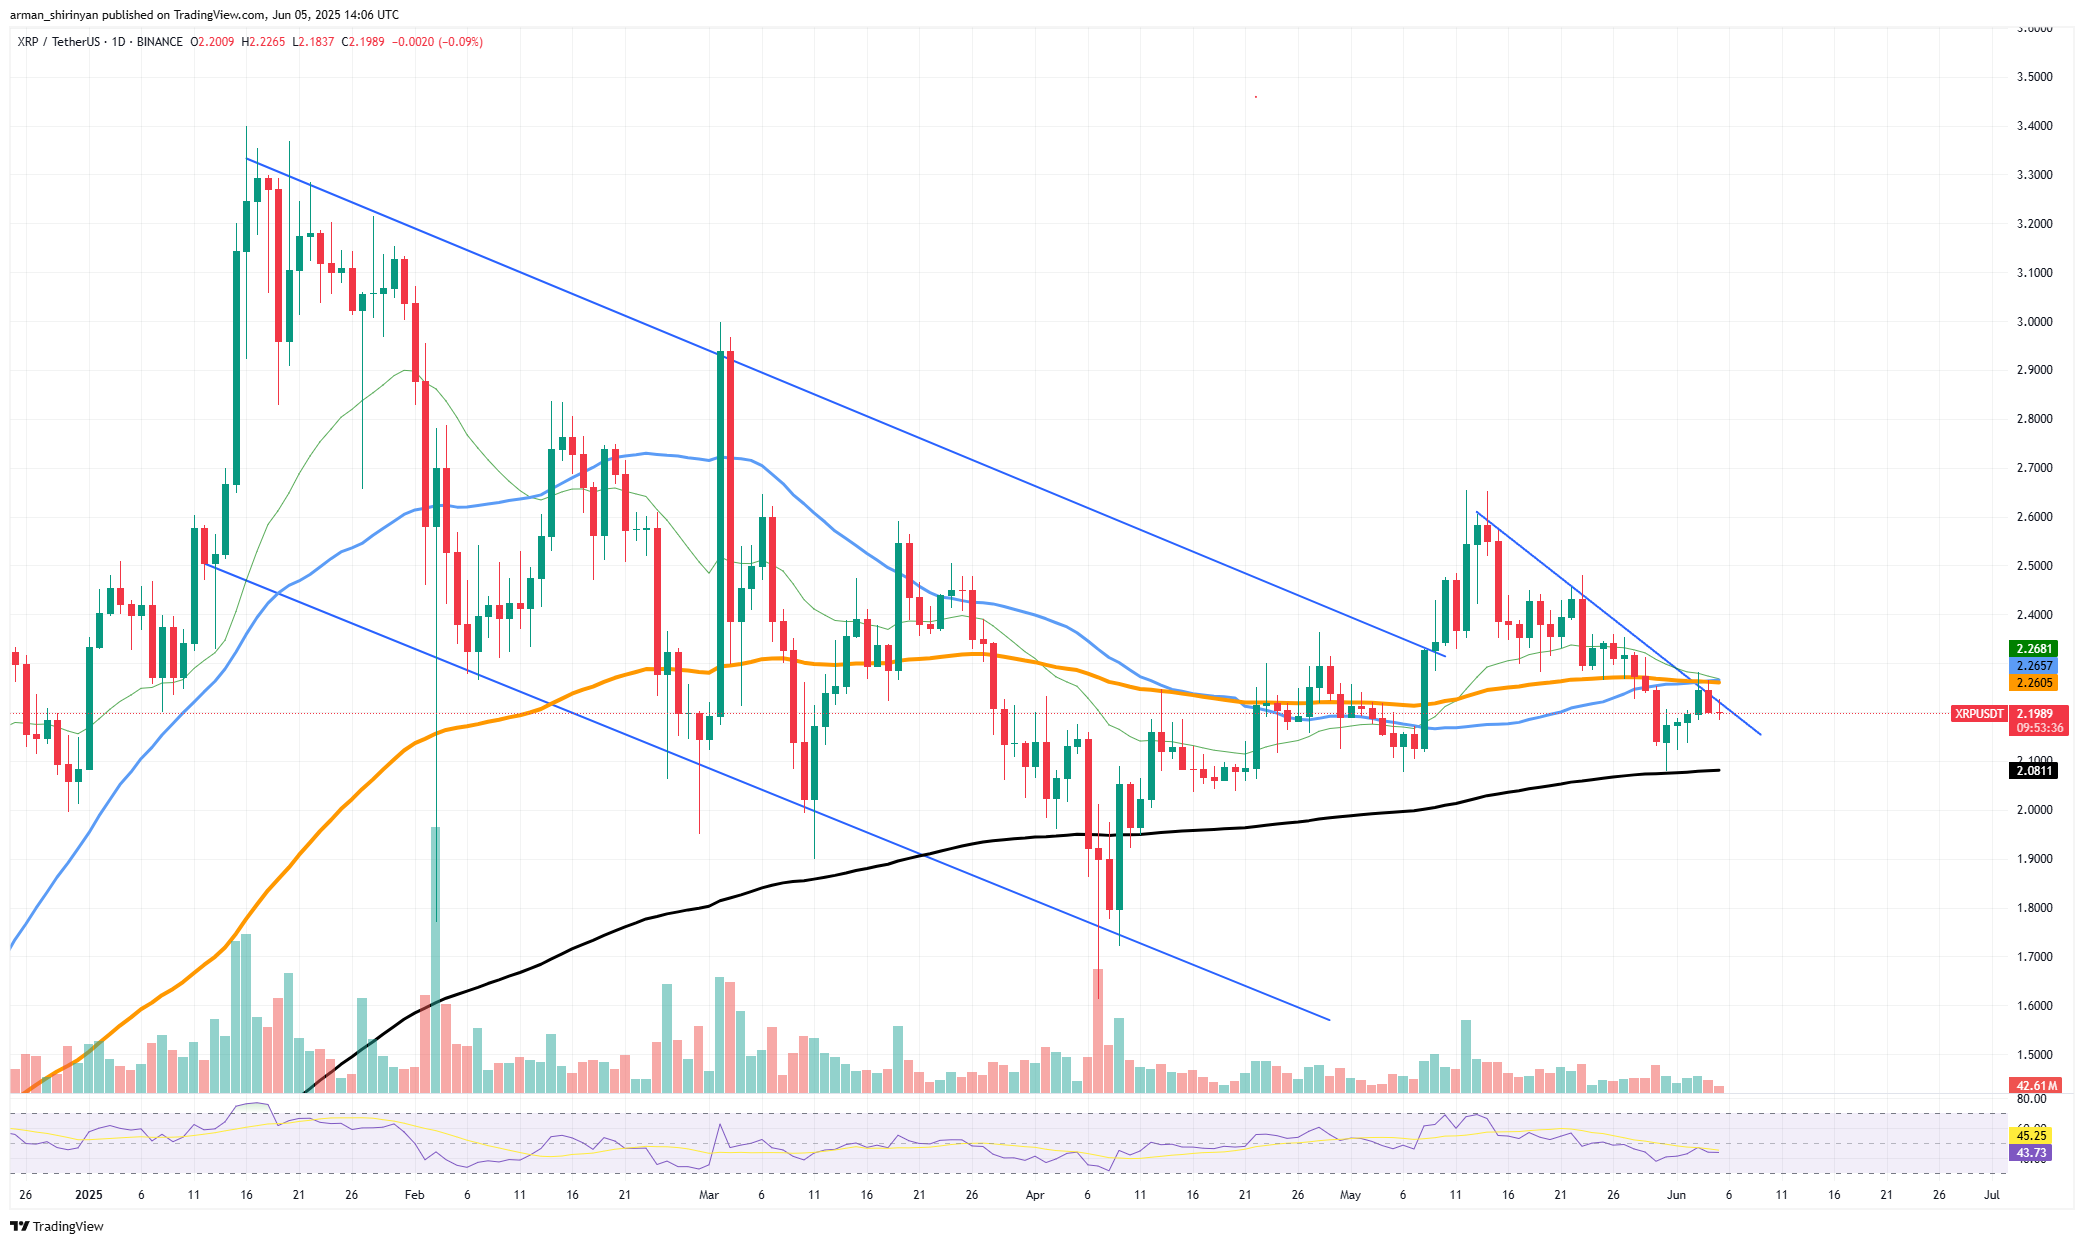
根据价格走势,市场也在压缩。如果没有强劲的向上推动,XRP可能会朝着200 EMA的方向移动,目前交易接近$2。上次在最后一次修正中支撑XRP的最后一个重要支撑位也在这个水平,使其不仅仅是一个技术目标。在这一点上的崩溃可能会导致XRP进入更严重的回调阶段。
热门故事 秘密以太坊(ETH)黄金牛市即将来临?索拉纳(SOL)进入自由落体,比特币(BTC):现在或永不? 这是谁给罗斯·乌尔布里希特发送3100万美元比特币 突发:巨鲸被清算,比特币价格下跌 '买入比特币':迈克·诺沃格拉茨发布悲观的50万亿美元预测
整体趋势仍然不稳定。尽管在2025年初从下行楔形中突破,支持了其长期看涨结构,但XRP最近的价格走势表明不确定性。短期内,由于该资产未能设定更高的高点并突破$2.20,导致看涨信心受到削弱。
除非市场情绪迅速改变或XRP以成交量确认恢复到$2.20,否则$2水平面临严重危险。交易者应密切关注价格与200 EMA的互动;如果突破,可能会随之而来更强的下行压力。
以太坊正在积累
数字开始比头条更响亮,以太坊可能正在悄然准备一次大突破。在过去30天里,ETH上涨了惊人的46%,在相对强度和绝对价格走势方面显著超越比特币。
ETH/BTC交易对在同一时间段内超过30%的增长是机构和零售兴趣日益增长的重要迹象,这表明资金正在显著从比特币转向以太坊。自5月初的垂直反弹以来,ETH保持了其涨幅,目前交易价格约为$2,600。
你可能还喜欢 
2025年6月5日 - 09:55 卡尔达诺创始人对以太坊、索拉纳和波卡的竞争发表看法 由戈弗雷·本杰明
价格在紧密的上升通道内整合时,已经形成了一系列更高的低点,同时遵循支撑水平。看涨延续结构通常表现出这种模式。由于在整合期间几乎没有波动,似乎稳定的健康需求——而非投机——是以太坊上涨的主要驱动力。
在ETH/BTC交易对中,ETH也显著突破了重要阻力,目前正在测试长期周线区间的上限。确认的突破可能标志着ETH黄金牛市周期的开始,在此期间,其在更大加密货币市场上的主导地位将会增加。
市场尚未耗尽购买力,成交量在正常范围内,尽管在这一整合阶段略有下降。RSI保持在60左右,处于中性状态,允许更多的上涨而不进入超买区域。更大的叙述也支持看涨论点。作为一个去中心化的结算层,以太坊因以太坊二层解决方案的日益普及以及合并后关于ETF和ETH增强货币结构的持续讨论而变得越来越受欢迎。
索拉纳开始移动
根据最新的市场数据,索拉纳正处于技术悬崖的边缘,下降已经开始。两个传统上作为动态支撑水平的重要移动平均线,50 EMA和100 EMA,均已被SOL正式突破。
这一突破不仅仅是象征性的,它预示着更为严重的修正和中期看涨动能的减弱。当前交易价格为$152,SOL不再维持之前由重要移动平均线汇聚加强的$155-160支撑区间。除了使最近的看涨结构失效外,这些水平的突破将其转变为主动阻力区。$100的心理水平或从当前价格下跌近35%现在似乎是下一个可能的支撑。
你可能还喜欢 
2025年6月4日 - 22:24 一笔转账中转移了$106,313,218的索拉纳(SOL)——发生了什么? 由卡罗琳·阿莫孙
在下跌过程中成交量的轻微增加表明,这一动作不仅仅是一次震荡或暂时的影线,而是长期抛售的开始。随着下行趋势和接近超卖区域,相对强弱指数(RSI)也显示出这一变化,并暗示卖方压力正在增强。从技术上讲,失去100 EMA(约$158)特别危险。
在完全趋势反转之前,这条线通常作为最后的防线。如果索拉纳无法迅速恢复该水平,可能会出现下跌。此外,宏观条件也没有帮助。随着更大市值的山寨币市场显示出疲惫迹象,资本轮换倾向于以太坊和比特币的主导地位上升,索拉纳可能会处于短期孤立的下行趋势。如果成交量不支持明确反弹至$160以上,瞄准$100的自由落体情景看起来更为可能。
免责声明:本文章仅代表作者个人观点,不代表本平台的立场和观点。本文章仅供信息分享,不构成对任何人的任何投资建议。用户与作者之间的任何争议,与本平台无关。如网页中刊载的文章或图片涉及侵权,请提供相关的权利证明和身份证明发送邮件到support@aicoin.com,本平台相关工作人员将会进行核查。


