Recently, Bitcoin's price has been fluctuating upward, but the increase has been limited. The current price is at a relatively high position within the fluctuation zone. Several indicators show that short-term bullish strength has increased, but there is clear resistance above, and market sentiment is becoming cautious.
In the short term, the price is expected to test the key resistance level around 109,500. However, if it fails to break through effectively, the price may narrow its fluctuations and adjust or even retreat within the range of 108,800 to 109,500.
1. K-line Pattern: The "Converging Triangle" in the short cycle has been broken, enhancing short-term bullish signals
Observing the 15-minute K-line chart, Bitcoin has currently completed the upper breakout of the converging triangle, steadily rebounding from the low point around 106,000 USD, forming a typical "W-shaped bottom" pattern. Technically, it shows a structure indicating the completion of short-term bottoming. A "Dark Cloud Cover" pattern has appeared, and recently, a "Three White Soldiers" pattern has emerged in the bottom area, suggesting that the rebound is likely to continue, but caution is needed regarding short-term pressure.
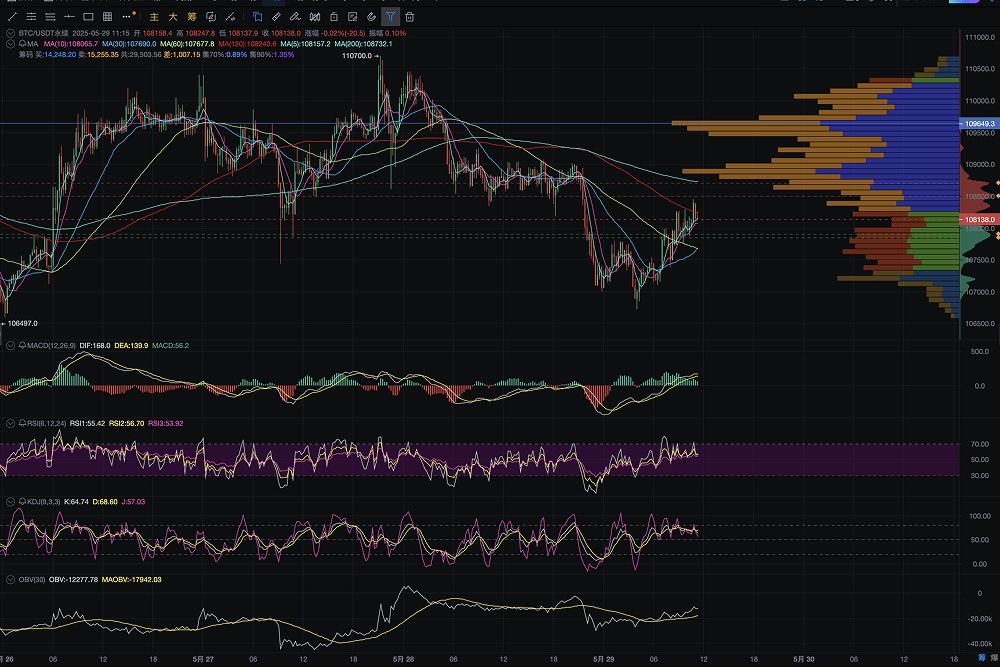
The AiCoin K-line chart shows that from the early morning to the morning of May 29, Bitcoin broke through multiple short-term moving average resistances, especially the 5-day, 10-day, and 30-day moving averages, which have completed a "bullish arrangement," with the price center continuously rising. The 200-period long moving average is still in the lower consolidation area, indicating that the price is still in the repair phase, but short-term momentum is accumulating.
2. Capital Movement: The trading concentration area is around 109,000 USD, with large orders testing the breakout
Chip distribution: Chips are concentrated in the range of 108,850 to 108,934, indicating that the market is in a key pressure area, with clear resistance but limited upward space.
However, it is worth noting that from the OBV (On-Balance Volume) perspective, the OBV has formed an upward turning point and broken through the short-term moving average, indicating a trend of net capital inflow. The MACD has also turned positive, with the main line DIF crossing above DEA to form a golden cross, and the momentum bars are continuously expanding, which is a strong short-term bullish signal.
The capital distribution shows signs of some large orders tentatively building positions. If the price can stabilize above 108,500 USD, it may trigger a liquidity overflow effect, pushing the price to attack the previous high of 110,700 USD.
3. Comprehensive Technical Indicators: Bullish and bearish divergence narrows, key indicators favor bulls
MACD: The current 15-minute MACD has formed a golden cross, with DIF moving away from DEA, and the green bars are fading while red bars are beginning to appear, indicating that the bearish momentum has been released and the bulls are taking over, especially after breaking the upper edge of the triangle, the price immediately surged, validating the effectiveness of the technical breakout.
RSI: The RSI is currently running above 55.4, far from the overbought zone but above the midline of 50, reflecting that market sentiment is shifting from "wait-and-see" to "bullish." The RSI has not shown divergence, and the momentum remains healthy. If it breaks above 70 in the future, it may enter an accelerated upward range.
KDJ: The K, D, and J lines are in a bullish opening state, with K at 64.7 and D at 68.6. Although they are at a high level, they have not flattened, indicating that there is potential for a short-term continuation of the upward trend. If the J value once again hits the overbought zone and does not quickly retreat, it may trigger a short-term extension of the upward trend.
4. CME Gap: "Unfilled gap above" becomes a key driver for recent upward movement
CME Bitcoin futures often leave "price gaps" due to weekend market closures, and these gaps have strong "attraction" and "repair inertia" in the market. Currently, there is an unfilled gap above:
Gap range: approximately between 109,600 and 111,000 USD (CME market)
This range has not yet been filled, and the market generally views this as a "price return point."
The current BTC spot price is testing the 109,000 area, and the CME gap is expected to become a "technical magnet."
If the price stabilizes above 108,500 to 109,000 USD and is accompanied by increased volume, the market's willingness to fill the gap will significantly rise, and it may even fill quickly within a day or two, forming a classic path of "gap filling - accelerated rise."
5. Fundamentals and News: Continuous inflow of ETF funds + Vance's speech boosts confidence
On May 29, U.S. Vice President Vance stated in a speech at the Bitcoin 2025 conference, "Cryptocurrency is a hedge against Washington's poor policies. Cryptocurrency is a hedge against soaring inflation.
Bitcoin can play a positive role in the country's future strategy. Under Trump's leadership, the crypto industry has finally welcomed true supporters and allies in the White House. Our government prioritizes eliminating the rules, red tape, and legal battles against cryptocurrency from the previous administration.
Once the GENIUS Act is implemented, it is expected to significantly expand the application of stablecoins as a digital payment system, providing convenience for millions of Americans. At the same time, it will protect coin holders and enhance market transparency.
Currently, about 50 million Americans hold Bitcoin, and I believe this number will soon increase to 100 million. I still hold a considerable amount of Bitcoin."

The U.S. consumer confidence index fell sharply in May, and the market bets that monetary policy will return to a loose stance.
Additionally, on May 29, according to Trader T monitoring, the U.S. spot Bitcoin ETF saw a net inflow of 433.66 million USD yesterday.
6. Summary and Forecast: Key resistance at 109,500-111,000 USD, once broken, will enter a new round of main rising wave
Combining the above multiple signals, Bitcoin has completed a triangular fluctuation breakout in the short term, with good momentum repair and significant capital inflow. The CME gap above and institutional accumulation form a combined favorable situation, with a short-term target price possibly pointing to 111,000 USD.
However, the following risks should be noted:
If the price is once again suppressed by 109,000 USD and falls below 106,000 USD, it may form a "false breakout."
If trading volume does not continue to expand, it will limit the sustainability of the upward trend.
ETF funds need to continuously show net inflows to constitute a real trend reversal.
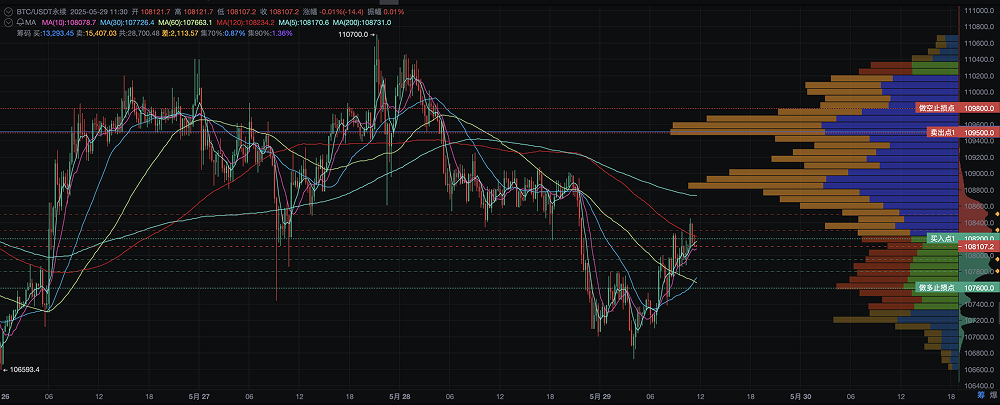
Recommendation: The current stage is suitable for short-term investment operations, and attention can be paid to the breakout situation near the resistance level.
If the price breaks upward through the 109,500 area, it may be appropriate to chase higher while setting profit-taking and stop-loss points.
If the price retreats to the support level near 108,800, consider buying on dips, but strict position control is necessary, and attention should be paid to changes in market trading volume.
For long-term investors, it is recommended to remain on the sidelines and wait for the price to stabilize above the mid-term moving averages before considering increasing positions.
免责声明:本文章仅代表作者个人观点,不代表本平台的立场和观点。本文章仅供信息分享,不构成对任何人的任何投资建议。用户与作者之间的任何争议,与本平台无关。如网页中刊载的文章或图片涉及侵权,请提供相关的权利证明和身份证明发送邮件到support@aicoin.com,本平台相关工作人员将会进行核查。


