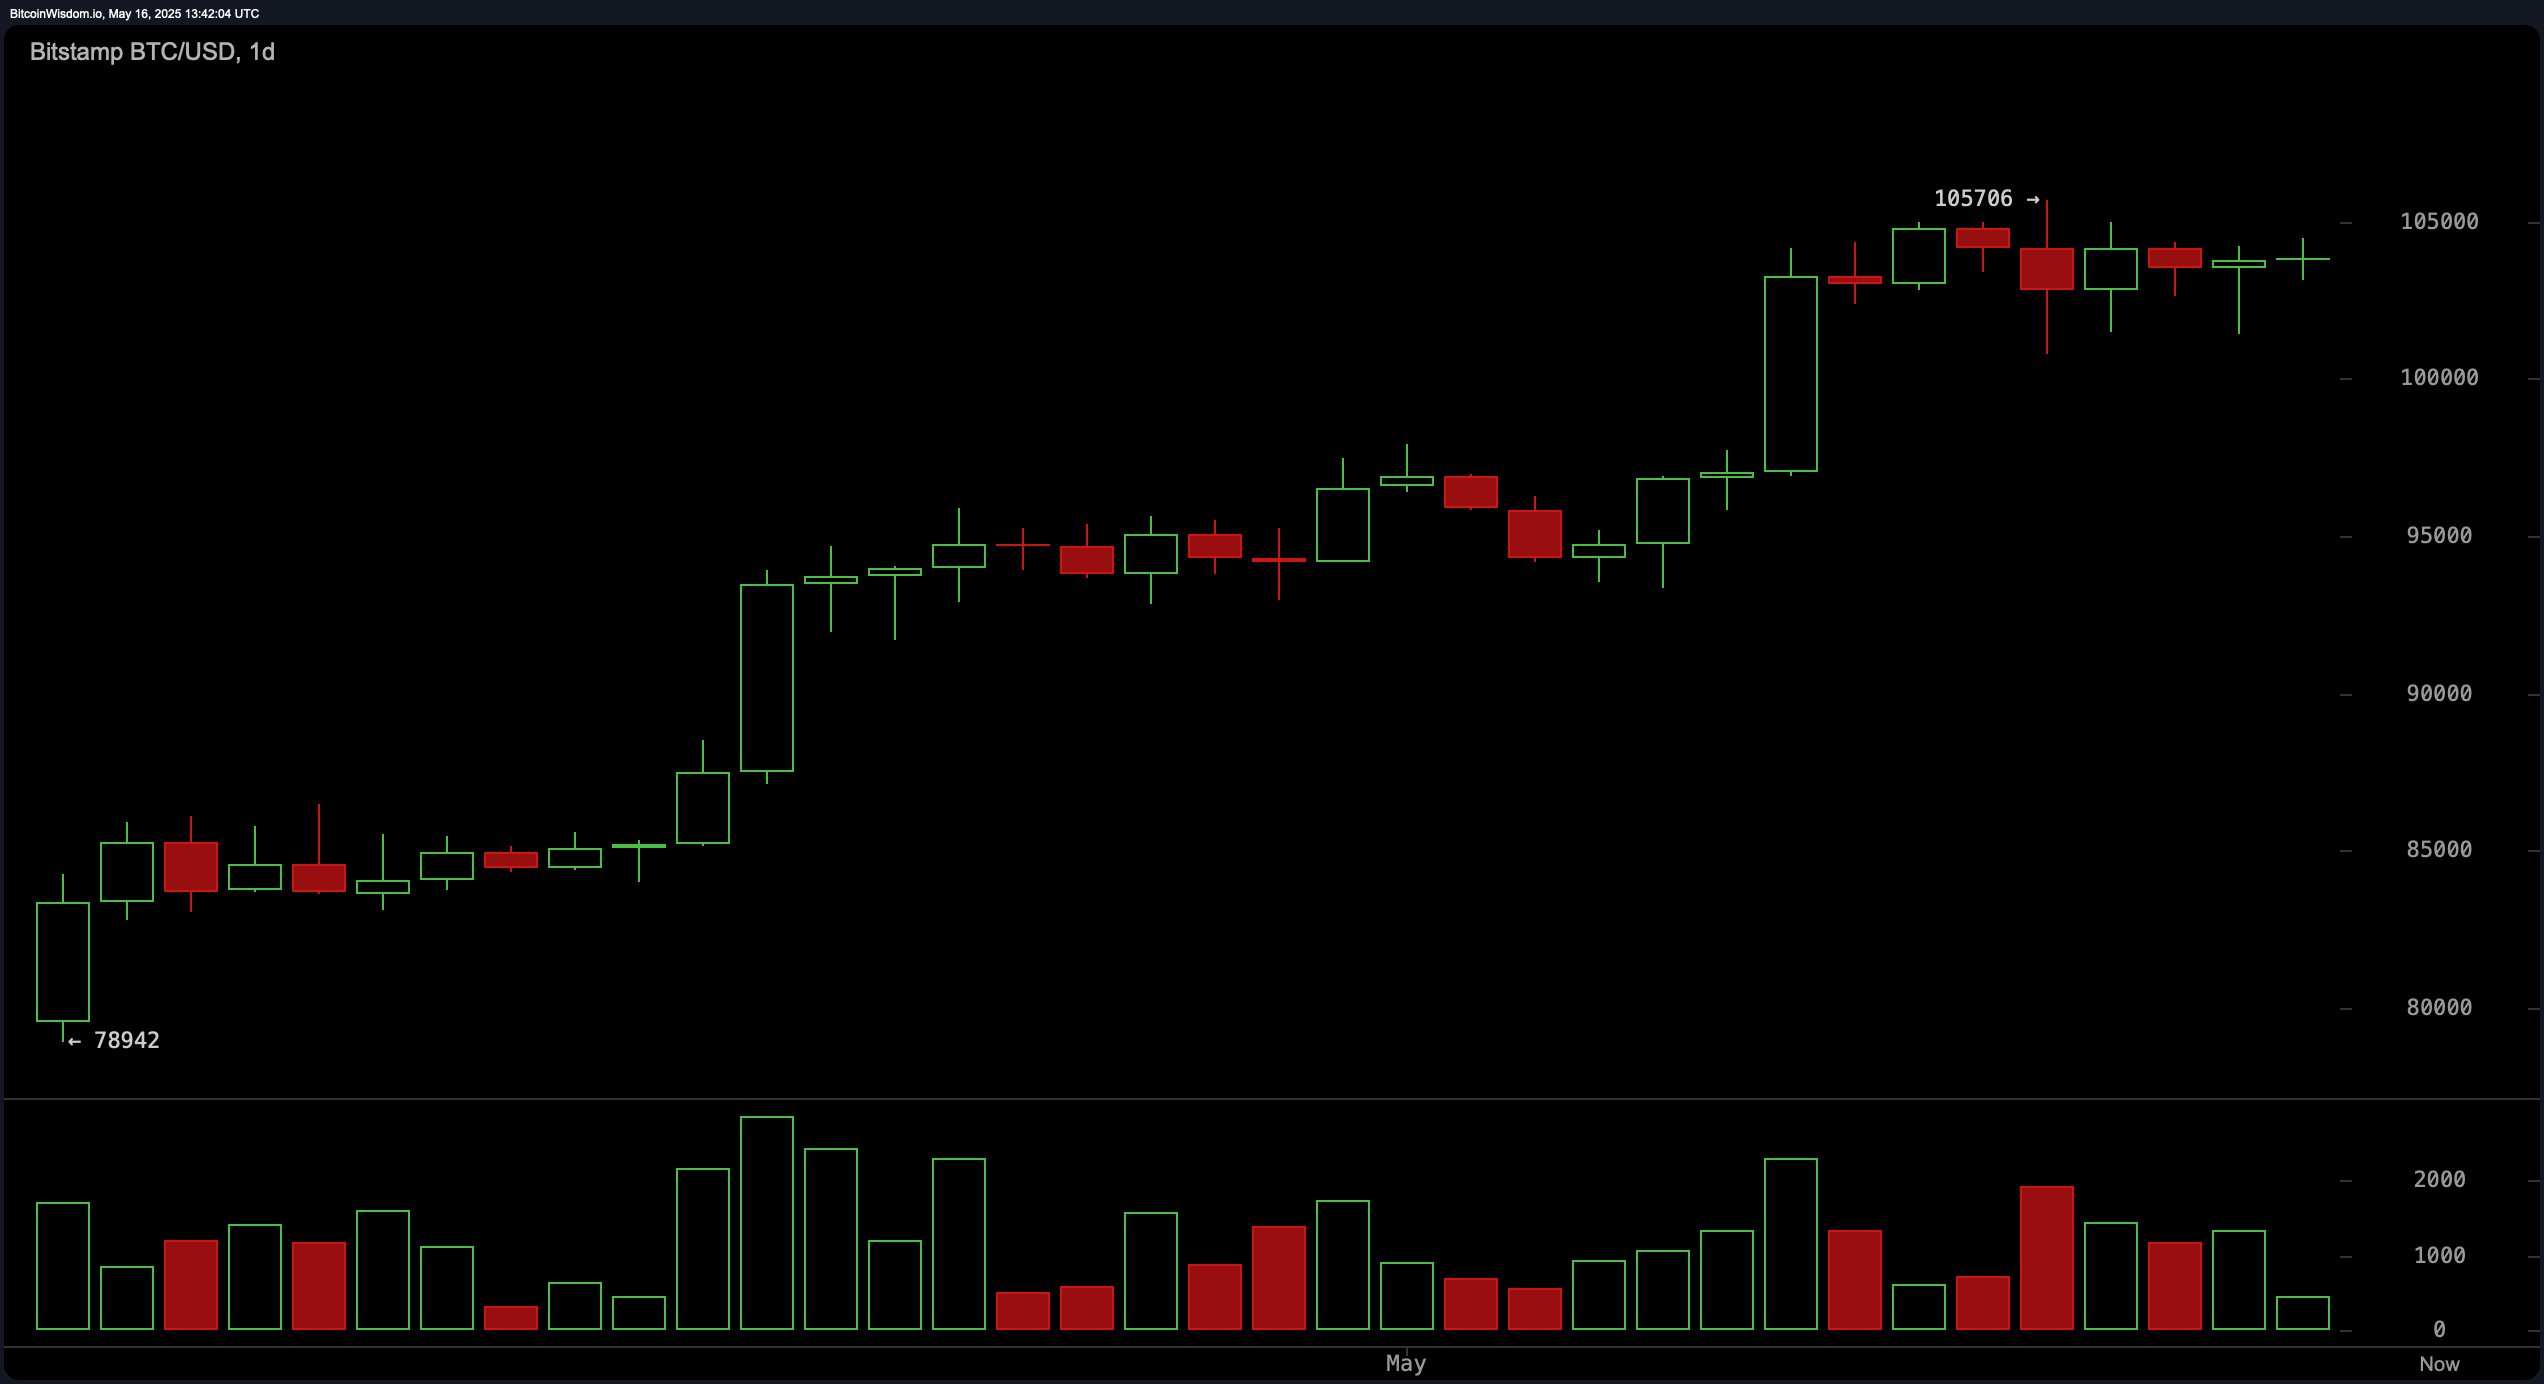
From a technical standpoint, bitcoin’s daily chart reveals a pronounced bullish trend marked by a steep ascent from approximately $79,000 to the $105,000 resistance zone. This upward movement is accompanied by diminishing volume, suggesting hesitance among market participants at current levels. The tight-bodied candlesticks near this resistance indicate indecision, forming a potential distribution area. A breakout above the $105,000 level, particularly if confirmed by increased volume, would signal bullish continuation. Conversely, a retreat below the $100,000 threshold could encourage profit-taking or initiate a correction phase.

BTC/USD 1D chart via Bitstamp on May 16, 2025.
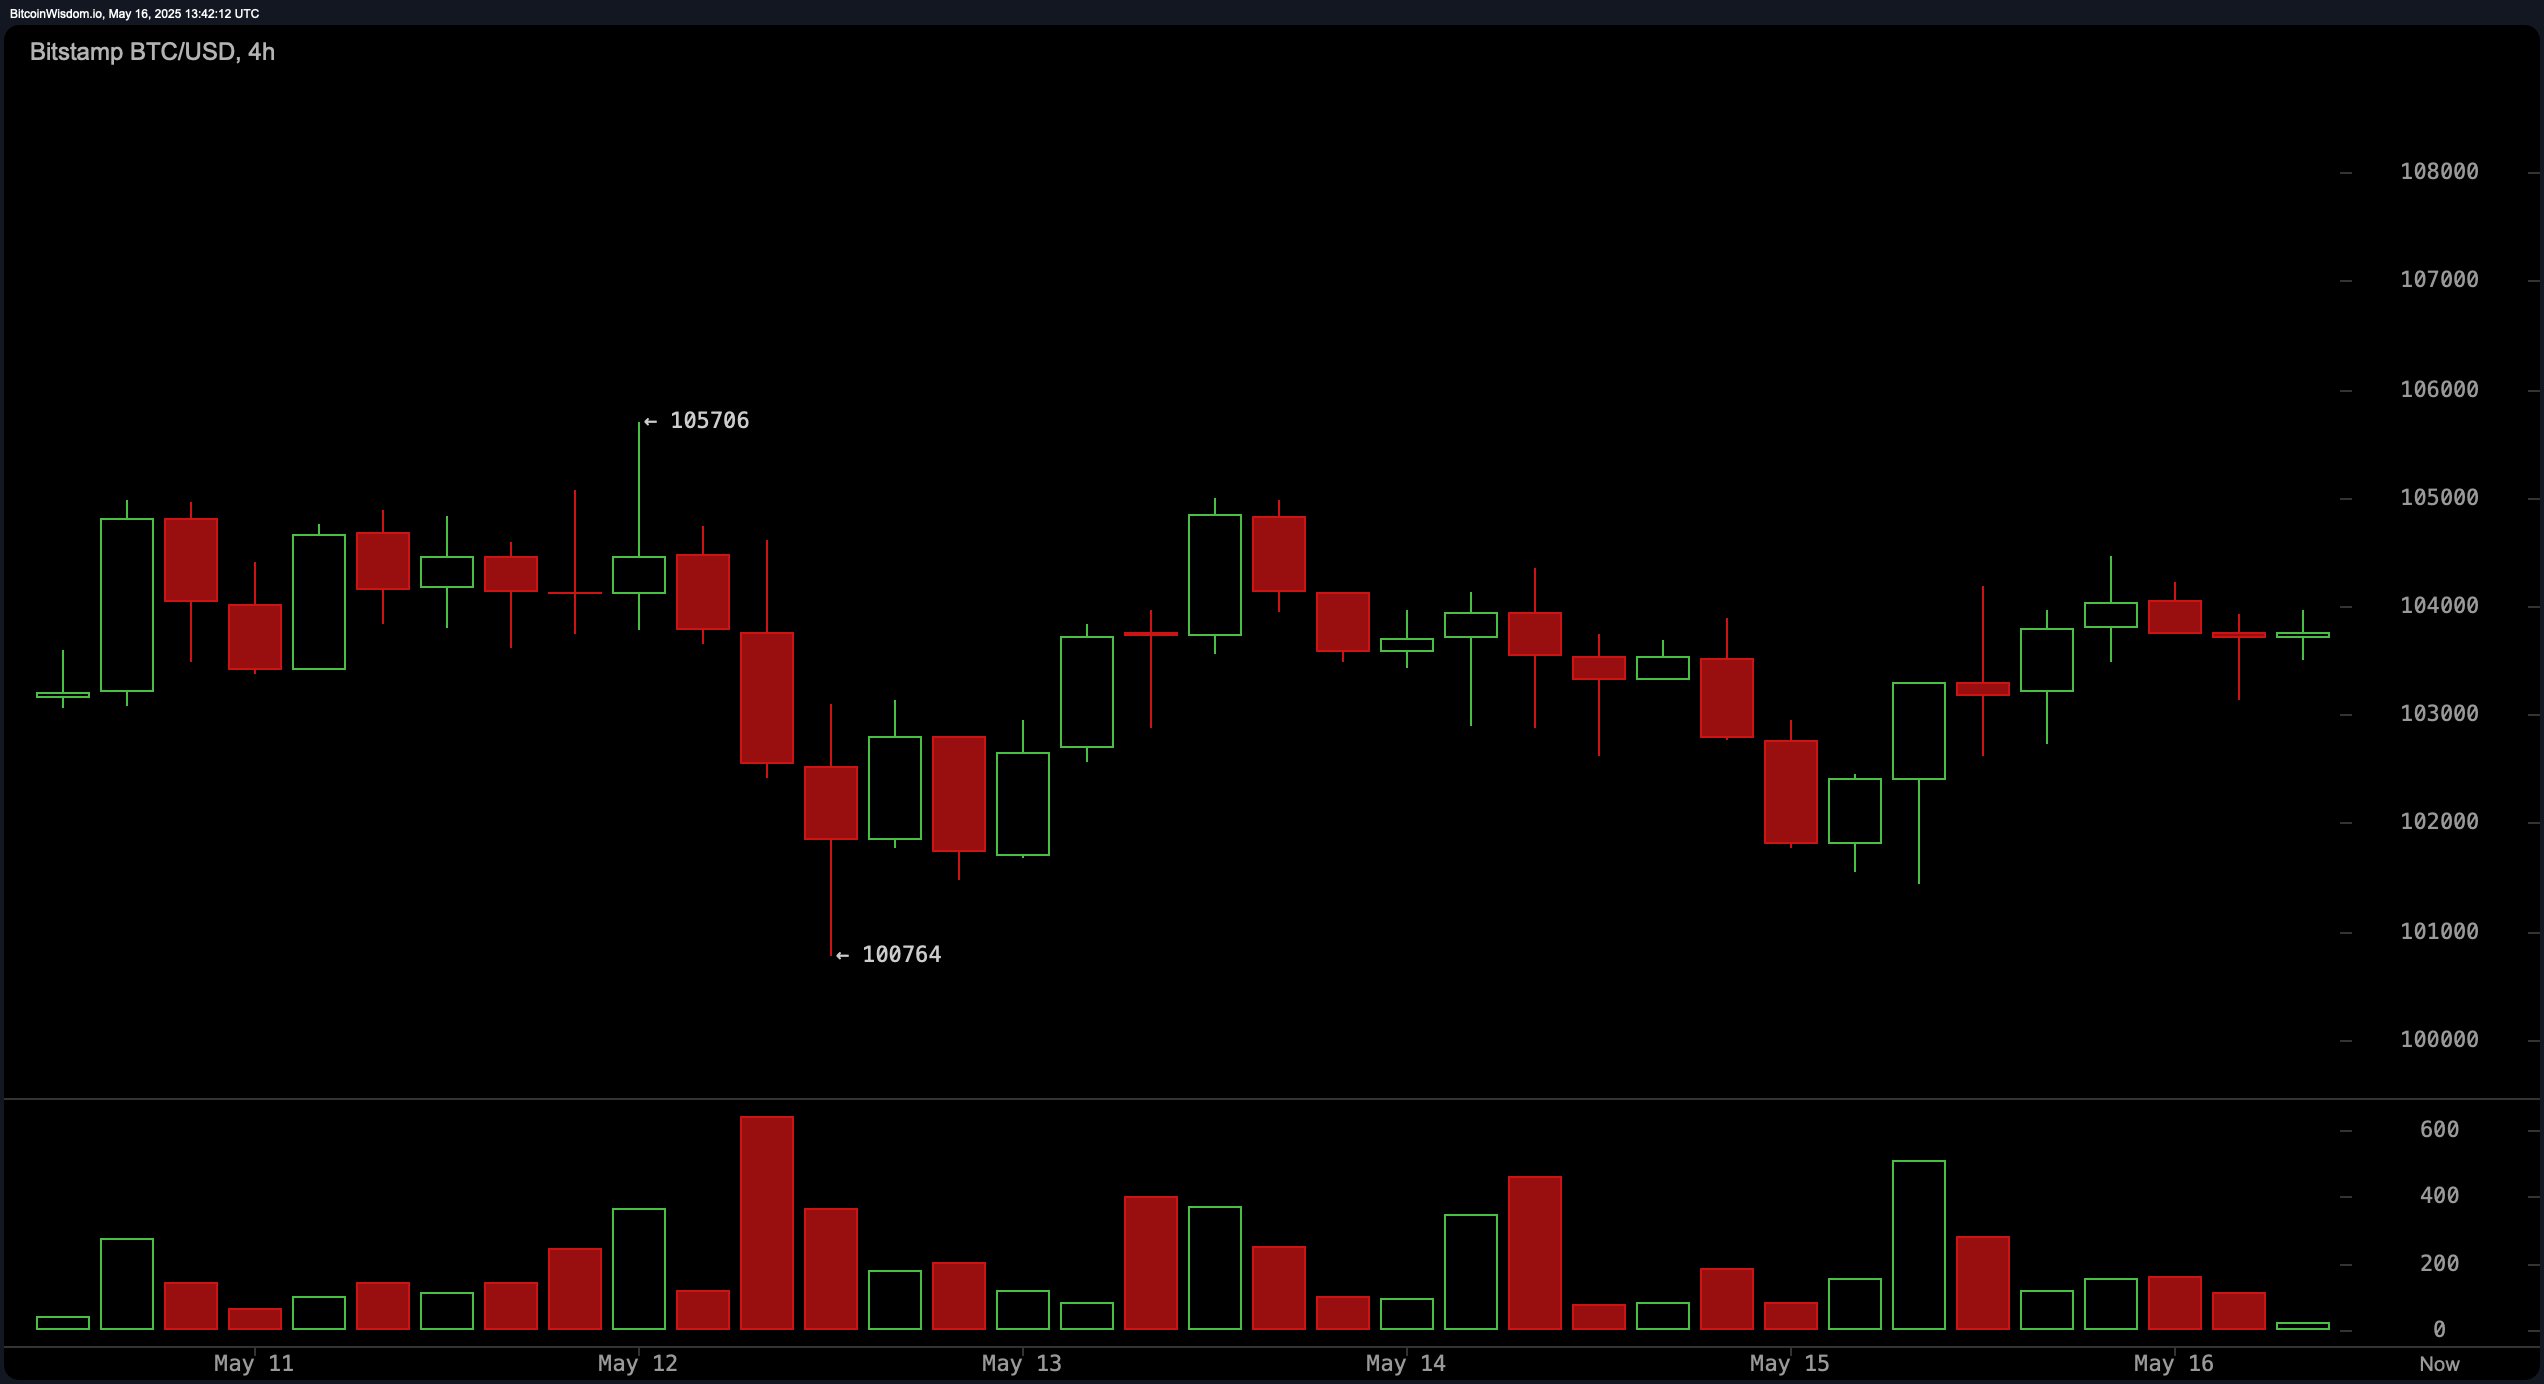
On the 4-hour chart, bitcoin appears locked in a range-bound structure with bearish undertones. Resistance persists around the $105,000 mark, while support is defined near $100,000. Notably, selling volume spikes on downward moves point to strong supply pressure during dips. Following repeated rejections at resistance and a sequence of lower highs, the current price consolidation between $103,000 and $104,000 could break to the downside. A recovery beyond $105,000 on robust volume may reestablish bullish momentum, but a dip under $100,000 would reinforce bearish sentiment.

BTC/USD 4H chart via Bitstamp on May 16, 2025.
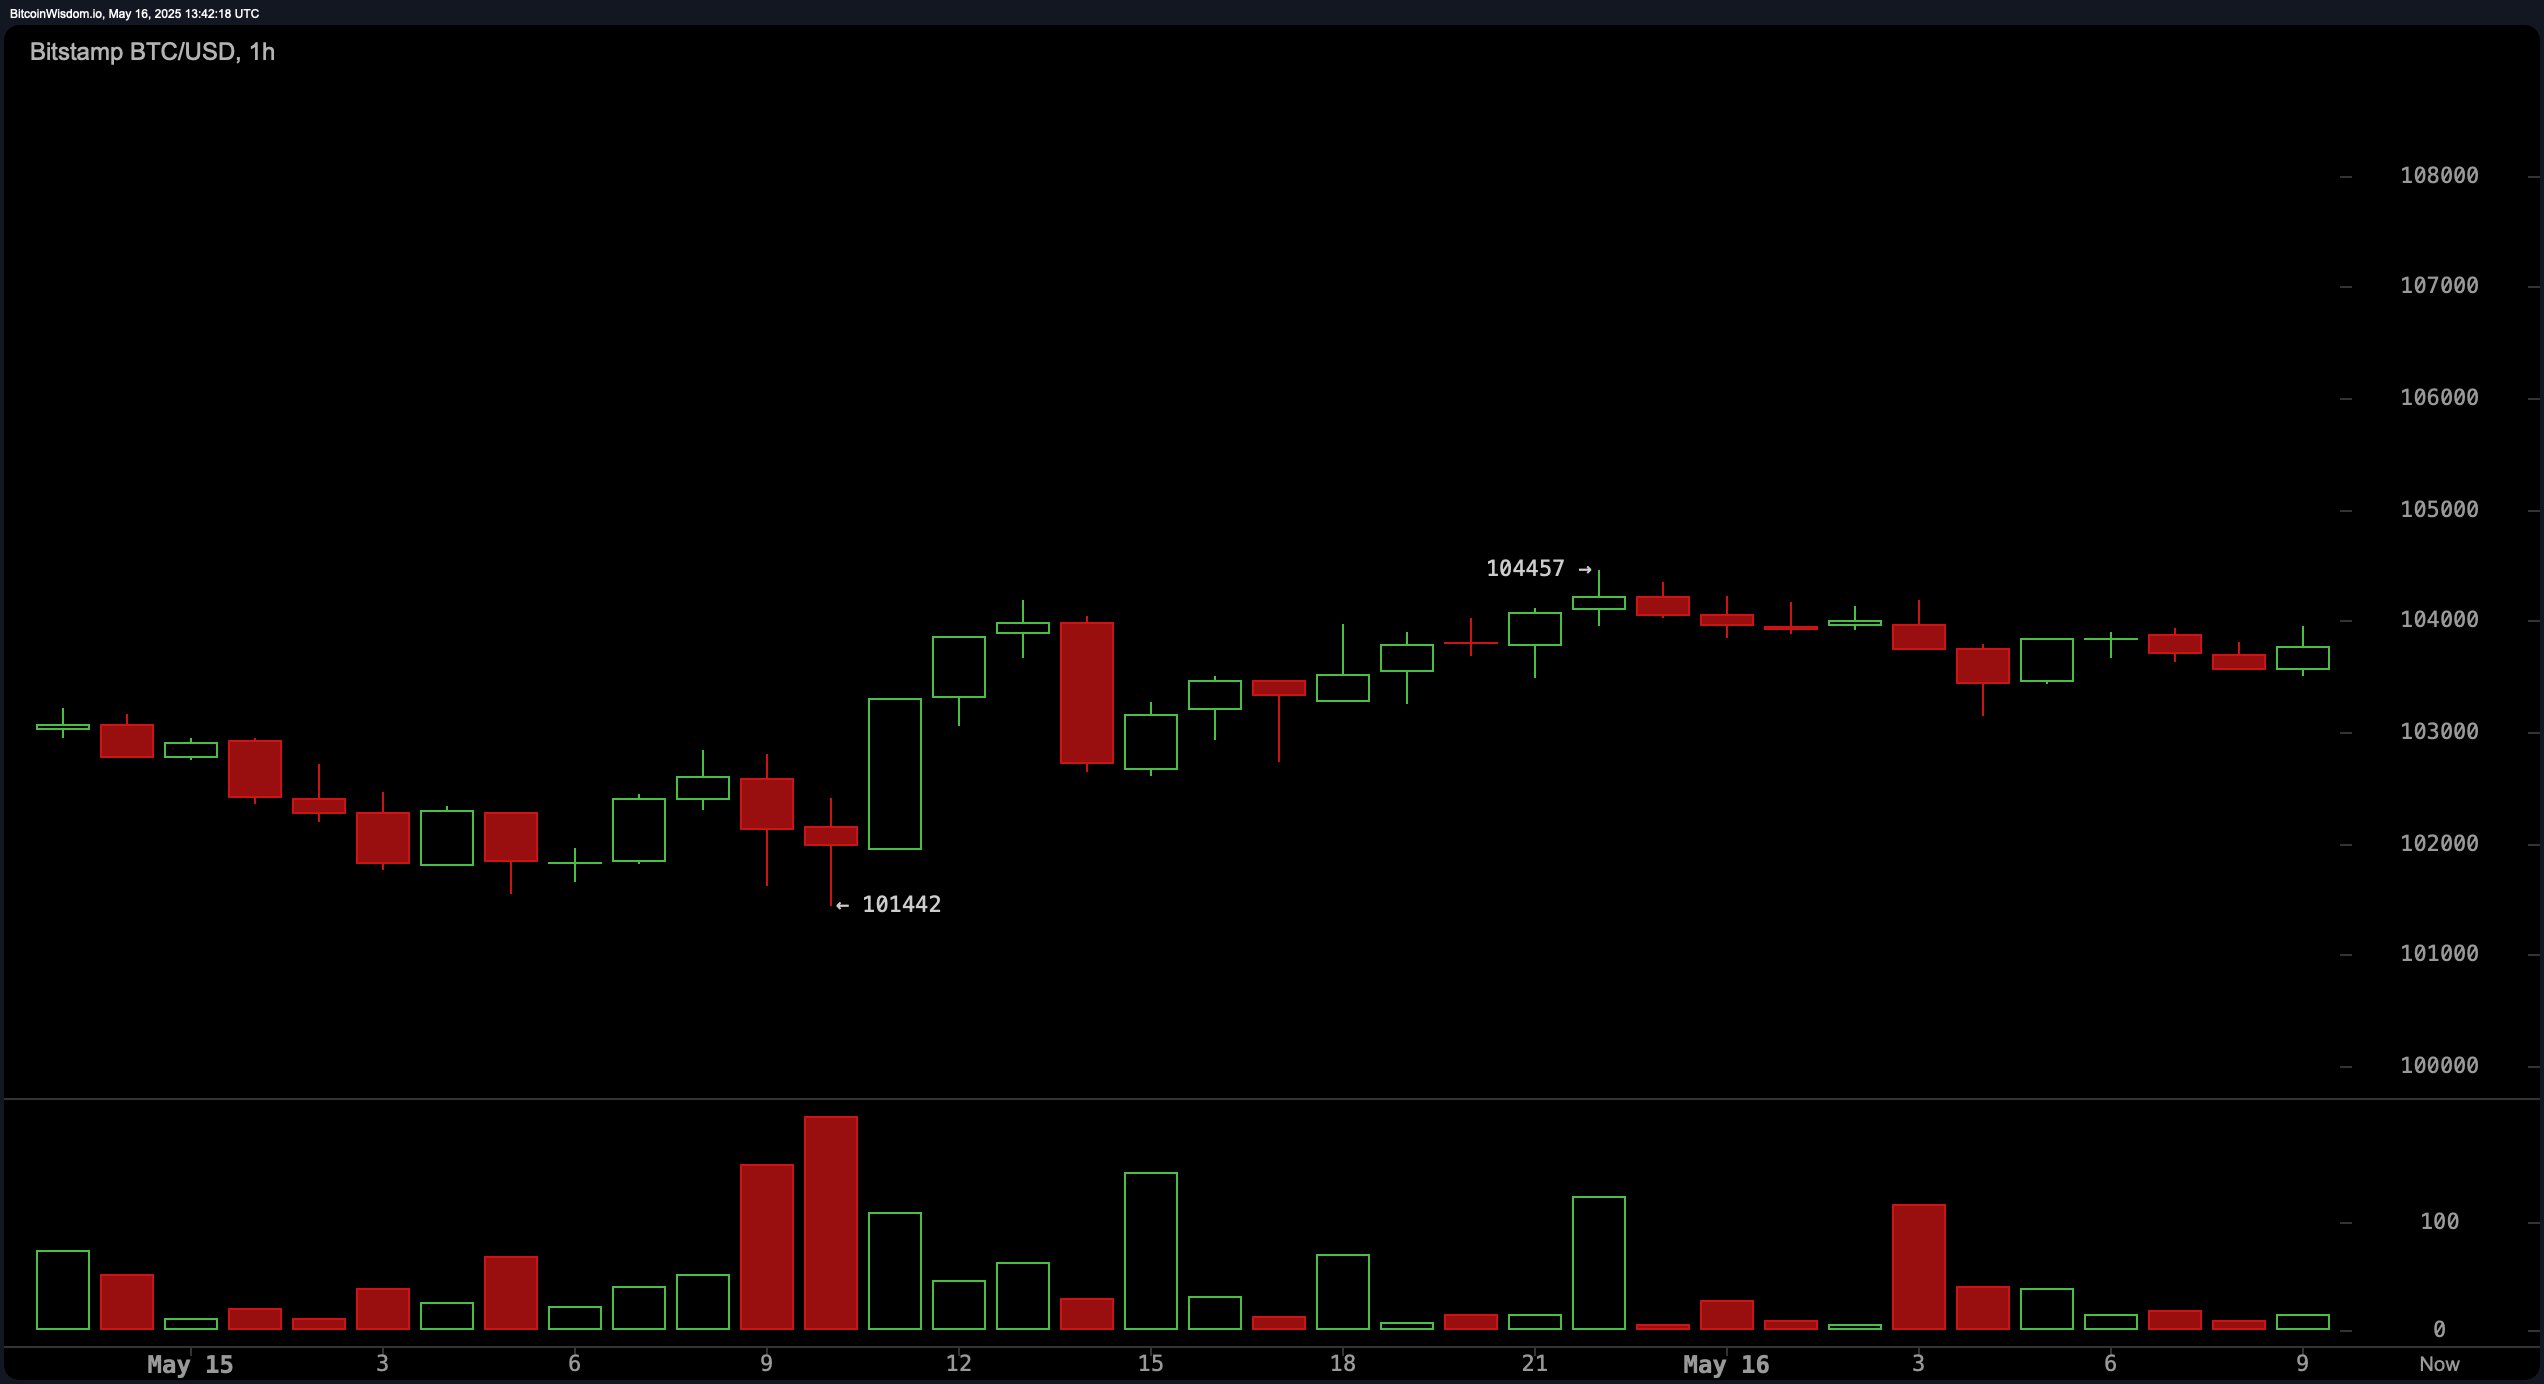
Bitcoin’s hourly chart shows weak consolidation behavior following a failed recovery attempt. After reaching a local high of $104,457, bitcoin has struggled to maintain upward traction, with its price confined to a narrow channel between $103,000 and $104,000. The decline in trading volume further hints at a pending volatility expansion. Seller dominance is evident, particularly after the rejection at $104,500. A strong move above that level with rising volume could indicate a potential intraday breakout, while failure to hold above $101,000 may prompt stop-loss activations.

BTC/USD 1H chart via Bitstamp on May 16, 2025.
Oscillator data reflects a market at a crossroads. The relative strength index (RSI) at 70, Stochastic at 84, commodity channel index (CCI) at 82, average directional index (ADX) at 34, and Awesome oscillator at 8,991 all signal neutral momentum. However, the momentum indicator at 7,102 leans bearish, while the moving average convergence divergence (MACD) level at 3,884 suggests a positive signal. This divergence between indicators underscores a conflicted market outlook, reinforcing the importance of price action and volume analysis for confirming directional bias.
Support from moving averages (MAs) remains consistently bullish. All short- to long-term averages—ranging from the 10-period exponential moving average (EMA) at 102,359 to the 200-period simple moving average (SMA) at 92,316—are in bullish territory. This alignment signals underlying strength, though the immediate consolidation necessitates vigilance. With the broader trend intact but short-term direction uncertain, traders are advised to maintain disciplined risk controls and await confirmation before initiating sizable positions.
Bull Verdict:
Bitcoin maintains a structurally bullish backdrop supported by strong positioning above all major exponential moving averages (EMAs) and simple moving averages (SMAs), from short to long timeframes. The MACD (moving average convergence divergence) remains in buy mode, suggesting latent upward momentum. If price can decisively break and hold above the $105,000 resistance with a surge in volume, a renewed rally toward new highs is likely.
Bear Verdict:
Despite longer-term strength, bitcoin shows short-term vulnerability through neutral-to-bearish oscillator readings and repeated failures at the $105,000 resistance. Consolidation with low volume on the hourly and 4-hour charts, alongside increasing sell pressure on dips, hints at a potential correction. A breakdown below $100,000 would validate a bearish shift and could trigger a decline toward the $95,000–$90,000 support region.
免责声明:本文章仅代表作者个人观点,不代表本平台的立场和观点。本文章仅供信息分享,不构成对任何人的任何投资建议。用户与作者之间的任何争议,与本平台无关。如网页中刊载的文章或图片涉及侵权,请提供相关的权利证明和身份证明发送邮件到support@aicoin.com,本平台相关工作人员将会进行核查。


