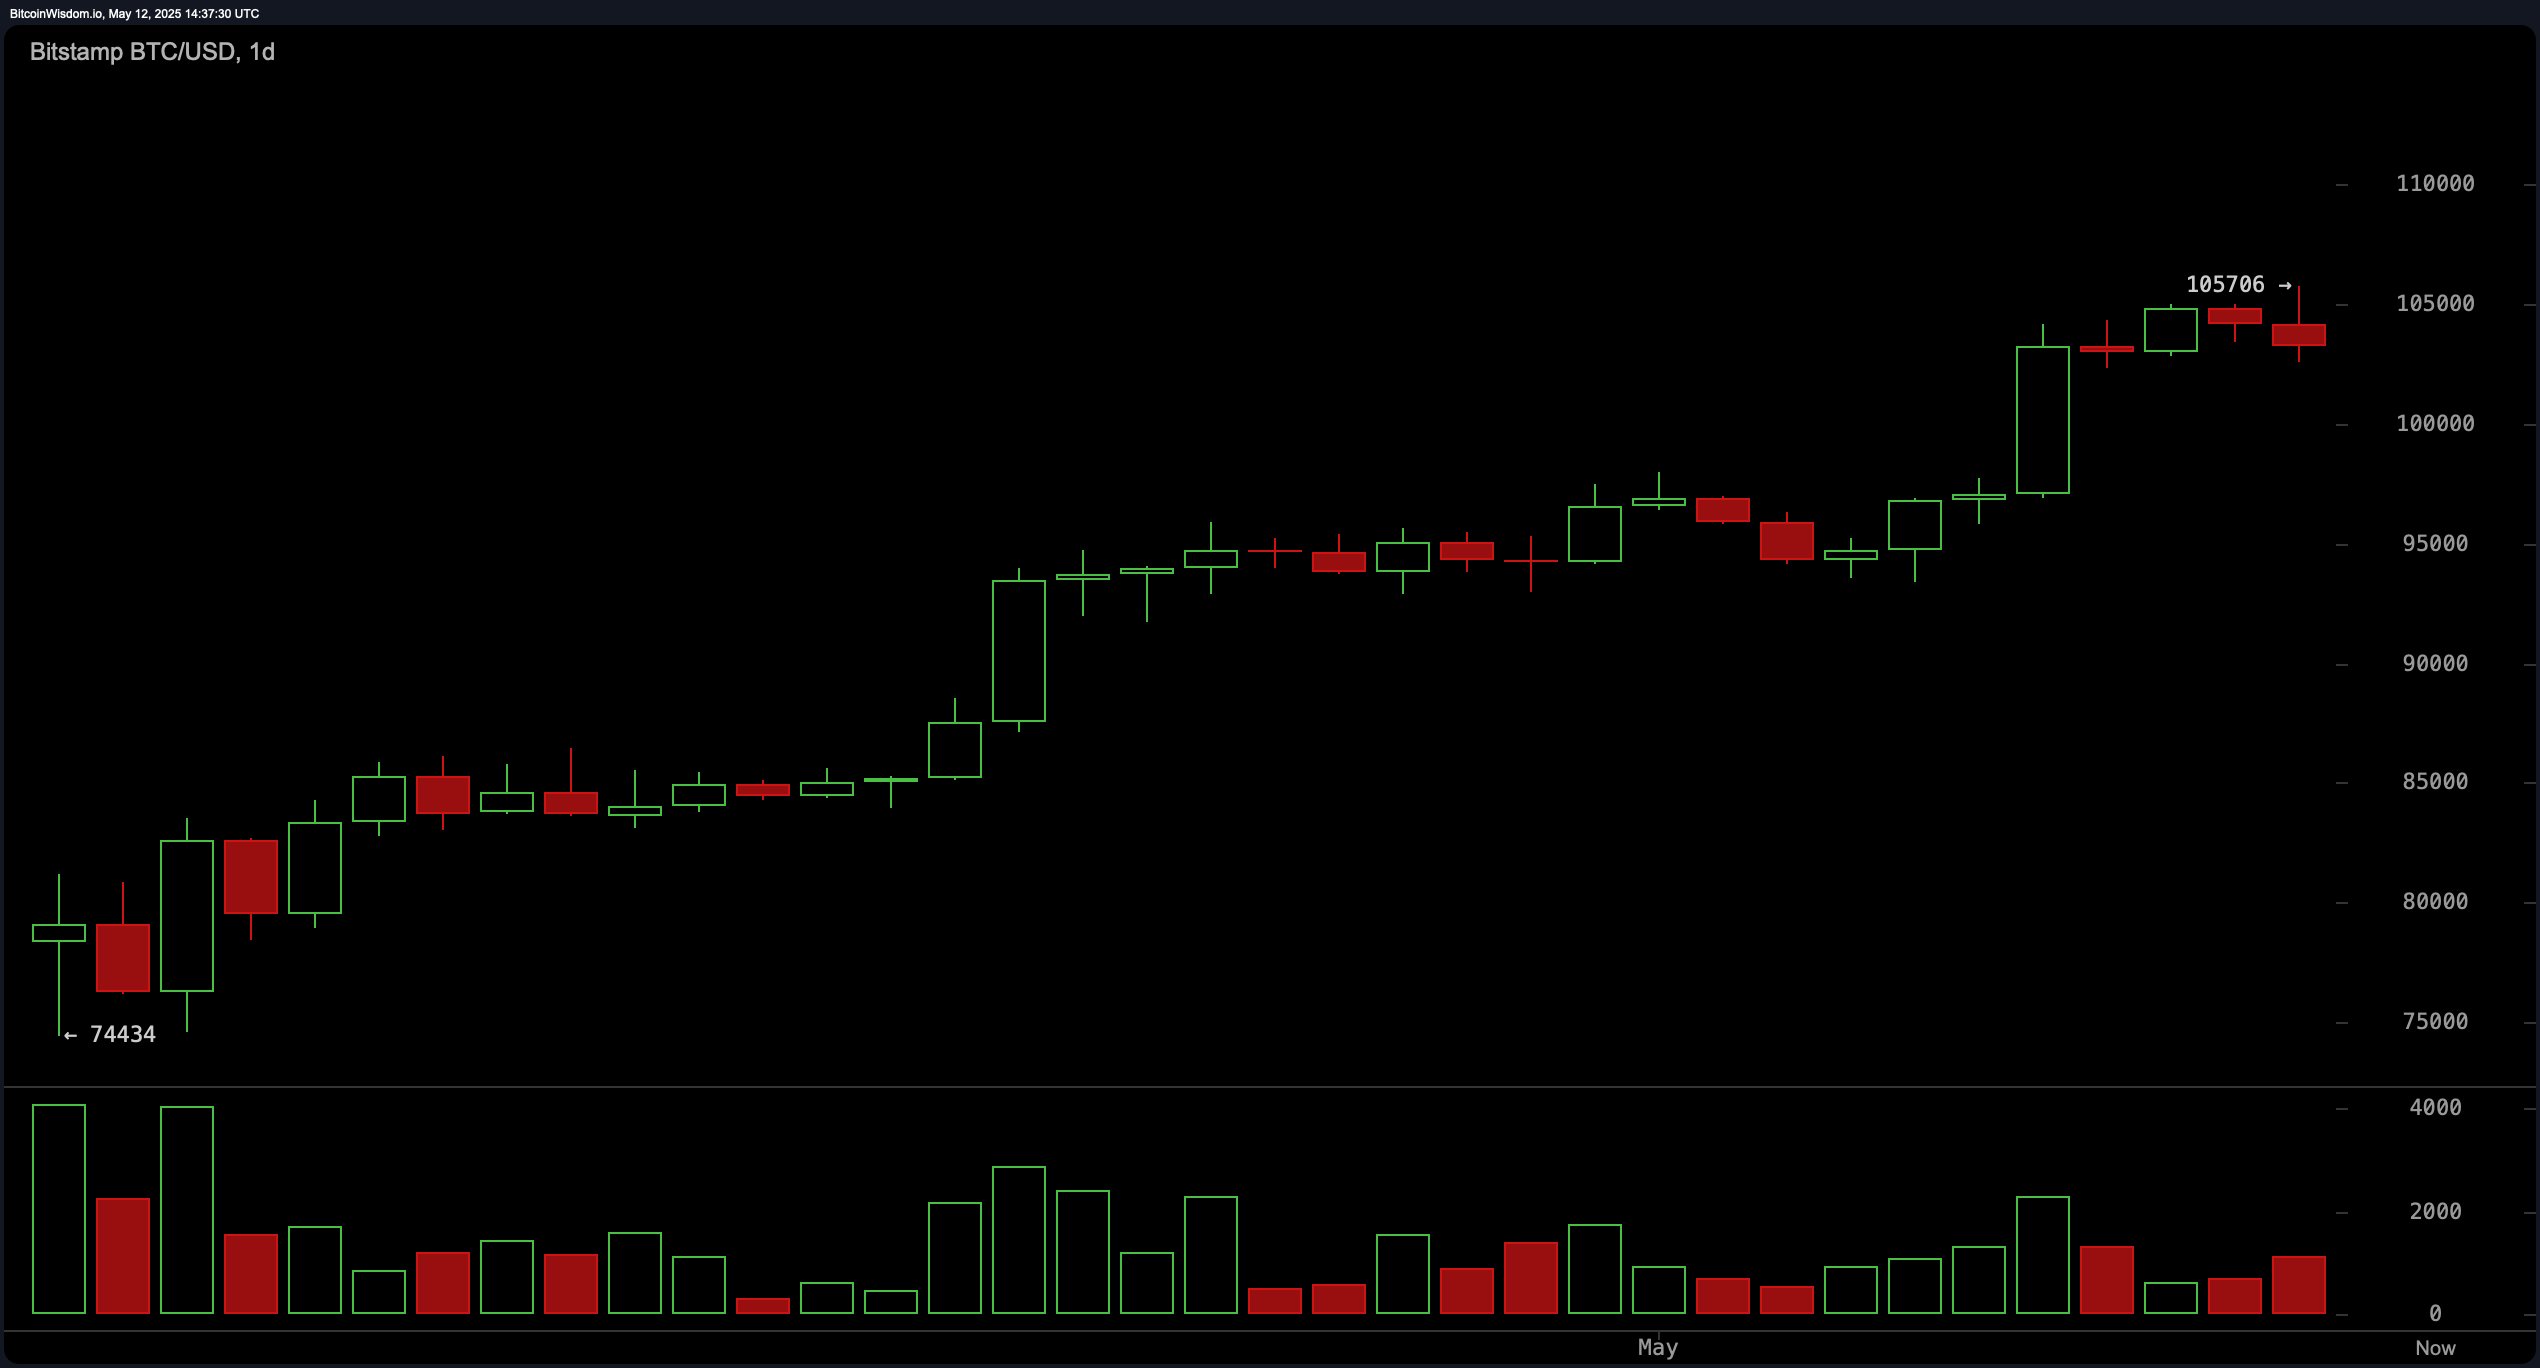
The daily chart underscores bitcoin‘s strong bullish structure, with price action maintaining higher highs and higher lows after breaking above the $74,000 level. However, recent candlestick behavior suggests increased resistance near $105,700, with a slight dip in volume that may signal a distribution phase. All major moving averages, including the exponential moving average (EMA) and simple moving average (SMA) across 10 to 200 periods, are firmly aligned with buy signals, reinforcing the uptrend. Among oscillators, the moving average convergence divergence (MACD) shows a buy with a positive value of 4,184, but others like the momentum and commodity channel index (CCI) register sell indications, revealing an underlying divergence.

BTC/USD daily chart on May 12, 2025.
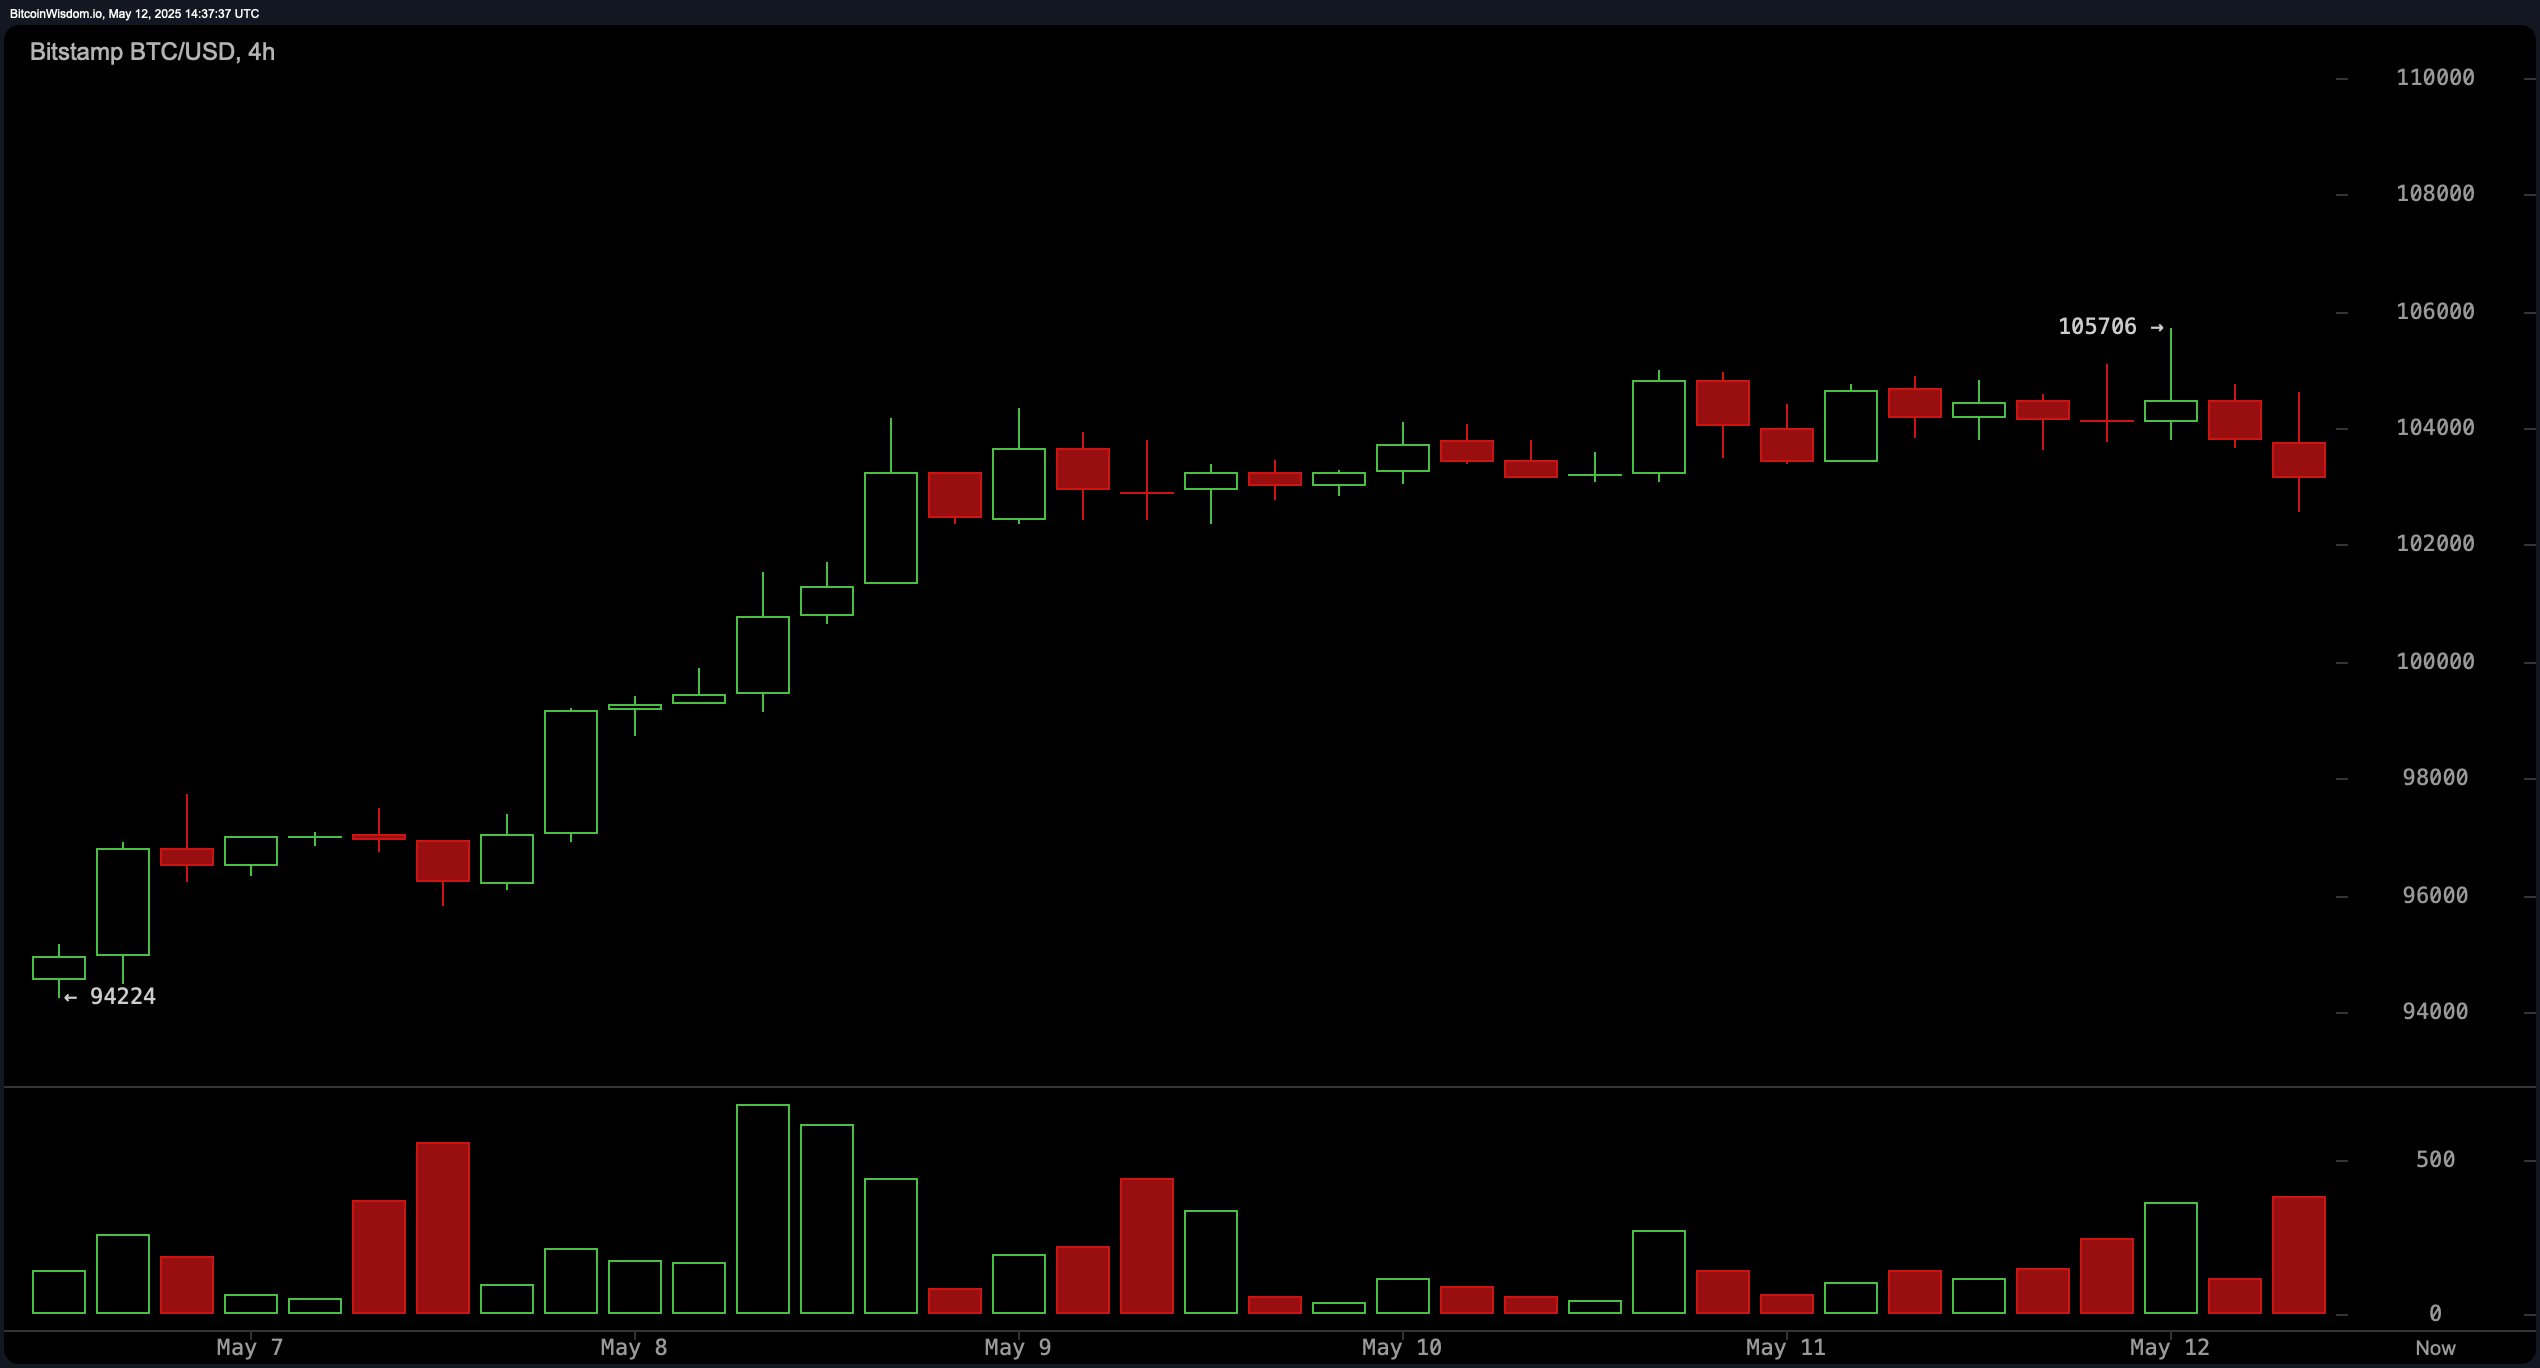
On the 4-hour chart, bitcoin has rallied sharply from $94,000 to its current range but is now consolidating beneath the $105,700 resistance ceiling. This range-bound behavior may indicate waning bullish momentum, as evidenced by the tapering volume since the peak. Multiple rejections at the upper boundary suggest a potential double-top formation, a classic technical pattern pointing to price hesitation. The 4-hour exponential moving averages and simple moving averages still support upward movement, but the oscillators, particularly the CCI and momentum, remain cautious. A breakout above $105,700 with strong volume would validate renewed buying interest, while a drop below $103,000 could undermine the current bullish setup.

BTC/USD 4H chart on May 12, 2025.
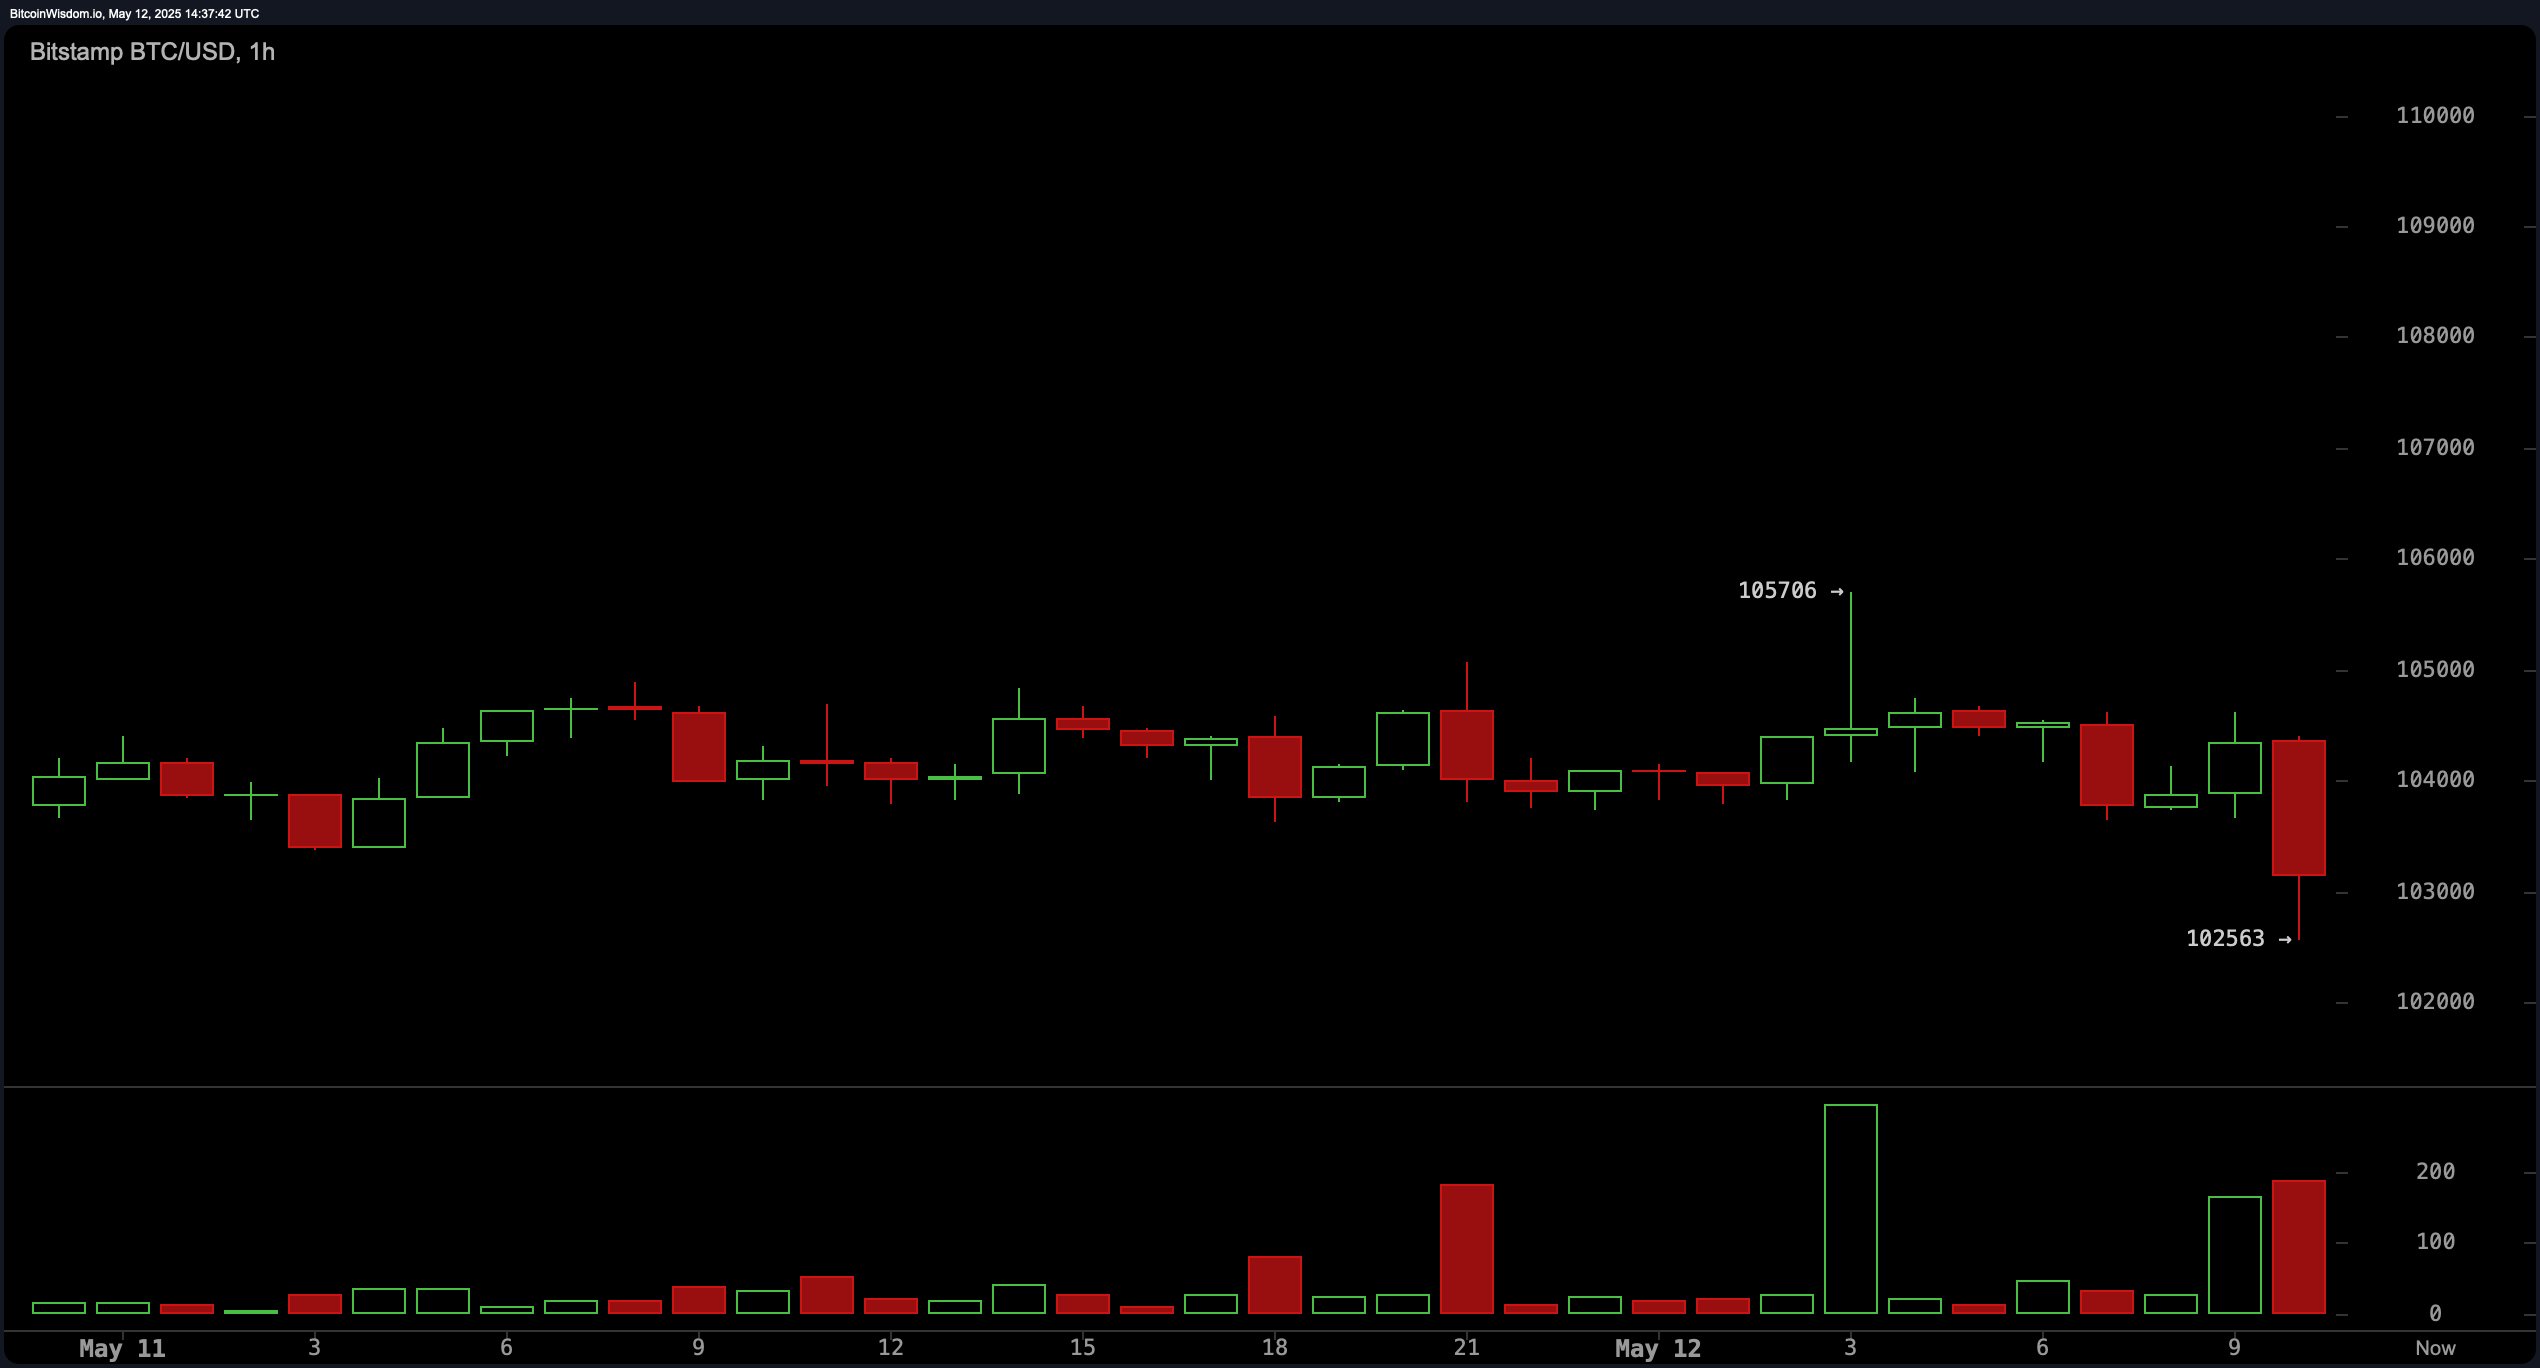
The 1-hour chart reveals tighter consolidation between $103,300 and $105,700, highlighting near-term indecision and increased intraday volatility. Despite a brief spike to $105,700, price action quickly reversed, hinting at a bull trap scenario unless confirmed by volume expansion. Volume patterns reinforce this skepticism, as activity has declined following the surge—often an early sign of short-term exhaustion. Oscillator signals remain mixed: relative strength index (RSI) and stochastic are neutral, while the momentum indicator is flashing negative sentiment.

BTC/USD 1H chart on May 12, 2025.
The oscillator panel presents a nuanced picture, with indicators such as RSI at 75 and stochastic at 94—both firmly in neutral territory. Meanwhile, the CCI at 155 and momentum at 7,368 are issuing sell signals, which conflict with the MACD’s bullish reading. This divergence suggests underlying hesitancy despite surface-level strength. These mixed technical signals imply that while the broader trend is still upward, momentum may be faltering, and further gains will likely require strong volume to sustain price beyond current resistance. Close monitoring of oscillator behavior will be crucial in determining near-term directional conviction.
Across all moving averages (MAs), bullish sentiment dominates, with all key EMAs and SMAs from 10 to 200 periods showing buy signals. The price remains well-supported above the exponential moving average (10) at $100,813 and the simple moving average (10) at $99,834, reinforcing technical strength. Additionally, the longer-term exponential moving average (200) at $87,362 and simple moving average (200) at $91,604 establish a solid bullish foundation, limiting downside risk. This comprehensive alignment of moving averages confirms sustained institutional accumulation, likely underpinning the current macro uptrend. However, traders should remain vigilant for any divergence between price and volume, as that may precede a deeper correction.
Bull Verdict:
Bitcoin’s sustained price above all major moving averages, coupled with a strong macro uptrend and supportive buy signals from the moving average convergence divergence (MACD), confirms robust upward momentum. A confirmed breakout above $105,700 on strong volume could trigger a new leg higher, with the potential to test uncharted price levels in the coming sessions.
Bear Verdict:
Despite the prevailing uptrend, weakening volume near resistance, sell signals from momentum and commodity channel index (CCI), and potential double-top formation on lower timeframes suggest a fragile rally. Failure to break above $105,700 or a dip below $103,000 could trigger a broader short-term correction, putting pressure back on the $98,000–$100,000 support zone.
免责声明:本文章仅代表作者个人观点,不代表本平台的立场和观点。本文章仅供信息分享,不构成对任何人的任何投资建议。用户与作者之间的任何争议,与本平台无关。如网页中刊载的文章或图片涉及侵权,请提供相关的权利证明和身份证明发送邮件到support@aicoin.com,本平台相关工作人员将会进行核查。


