Massive Bitcoin Bull Run Ahead? Two Chart Patterns Mirror BTC's Rally to $109K

CN
coindesk
Follow
12 hours ago


This is a daily technical analysis by CoinDesk analyst and Chartered Market Technician Omkar Godbole.

Crypto bears might want to closely watch bitcoin’s (BTC) recent chart patterns, which mirror those that preceded the late 2024 rally from $70,000 to $109,000.

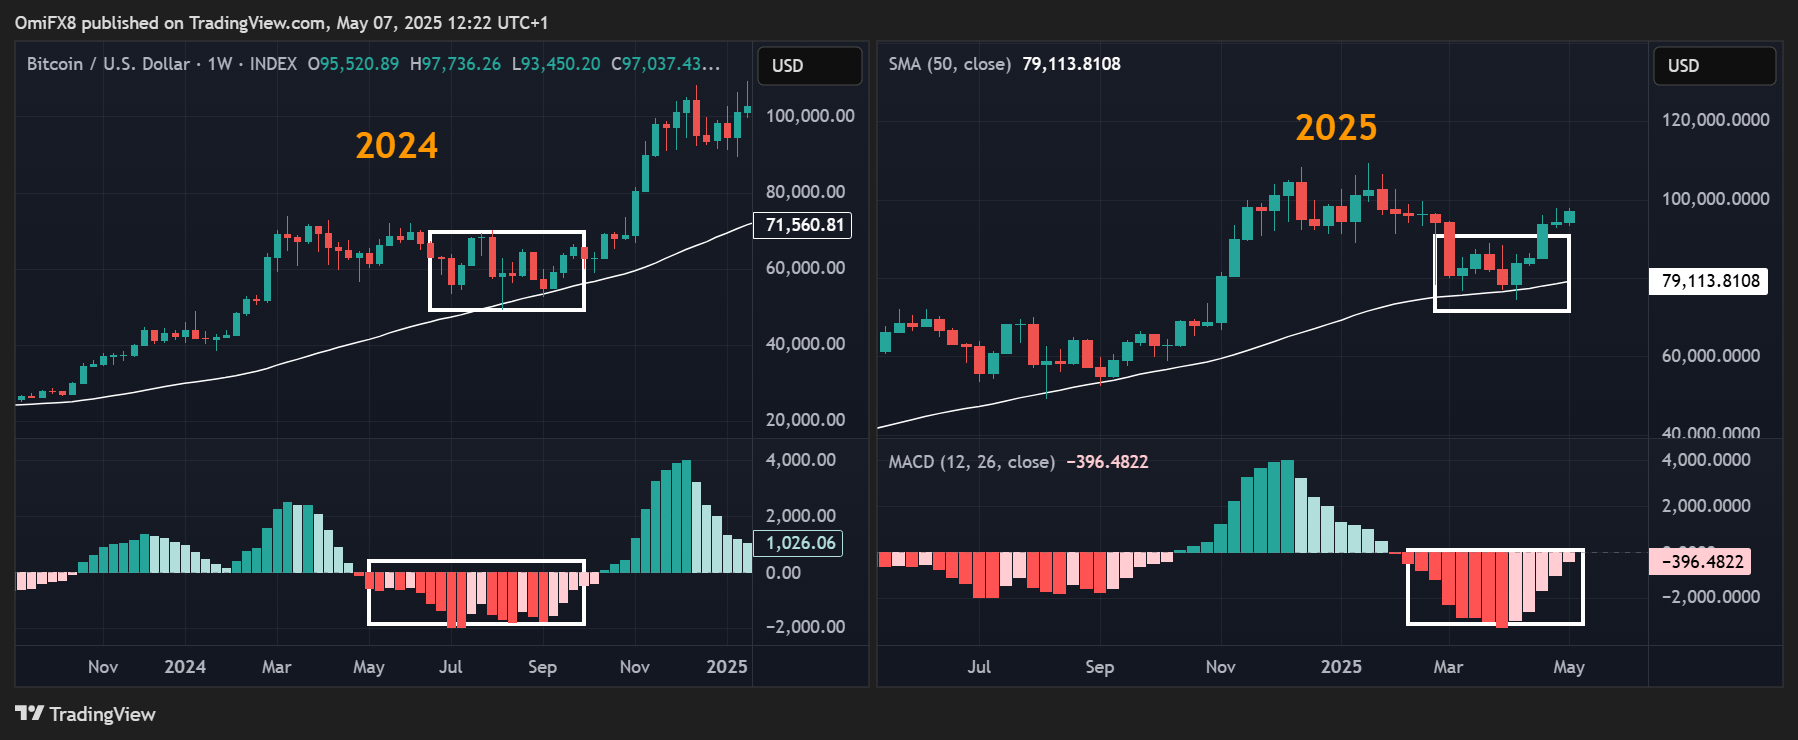
The first pattern involves the weekly chart’s Moving Average Convergence Divergence (MACD) histogram, a momentum indicator used to identify trend changes and reversals. MACD crossovers above or below the zero line typically signal bullish or bearish shifts in momentum.

However, traders interpret these signals in context with price action. A bearish crossover, for example, needs validation through weakening prices; otherwise, it could indicate underlying strength and a bear trap. Currently, that seems to be the case in BTC.

The cryptocurrency initially fell after the MACD flipped negative in mid-February, but quickly found support at the 50-week simple moving average (SMA) in March and has since bounced back above $ 90k. All the while, the MACD has held below zero.

This pattern is reminiscent of last August and September, when prices held the SMA support amid persistent bearish MACD signals. The indicator flipped bullish around mid-October, confirming the trend with a rally from $70K to $100K by December.

BTCs weekly charts. (2024 vs 2025). (TradingView/CoinDesk)

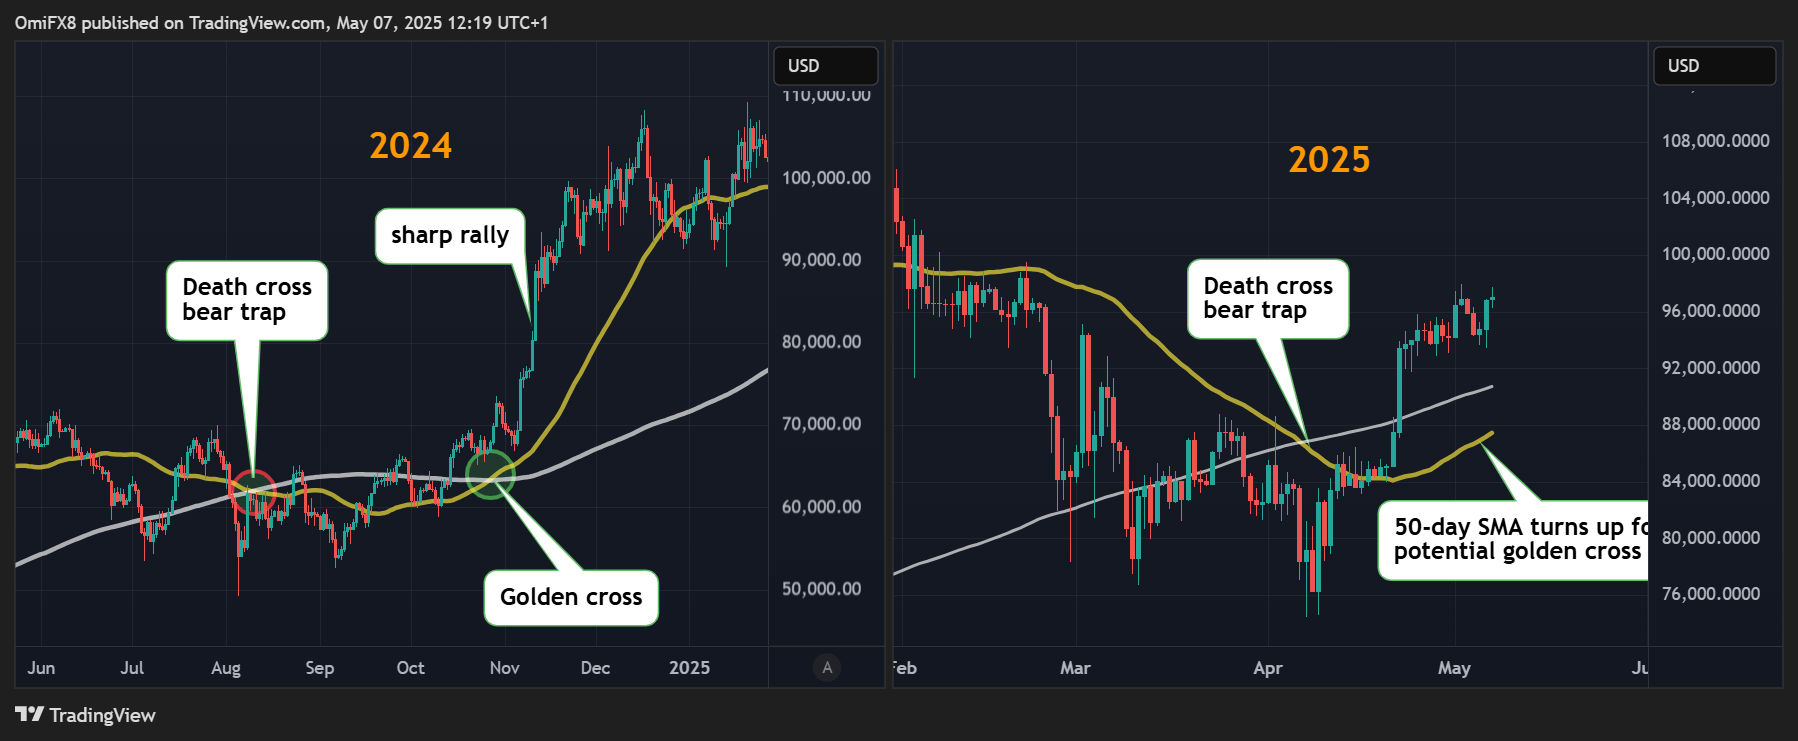
The second pattern involves the 50- and 200-day SMAs. About four weeks ago, these averages formed a bearish crossover—commonly known as the death cross—signaling a potential long-term downtrend. However, this turned out to be a bear trap, with bitcoin finding support around $75K and reversing course.

Recently, the 50-day SMA has begun to rise again and could soon cross above the 200-day SMA, setting up a bullish golden cross in the coming weeks.

This pattern closely mirrors last year’s trend: the death cross in August marked a bottom, quickly followed by a golden cross that sparked a breakout above $70K and ultimately led to a rally above $109K to new highs.

In other words, bullish volatility could be on the horizon, potentially taking bitcoin well past the January high of $109K.

Chart patterns are commonly used to assess market strength and forecast future movements. However, it’s important to remember that history doesn’t always repeat itself, and macroeconomic factors can rapidly swing market directions, making chart analysis far from foolproof.

BTC's daily chart. (2024 vs 2025). (TradingView/CoinDesk)

免责声明:本文章仅代表作者个人观点,不代表本平台的立场和观点。本文章仅供信息分享,不构成对任何人的任何投资建议。用户与作者之间的任何争议,与本平台无关。如网页中刊载的文章或图片涉及侵权,请提供相关的权利证明和身份证明发送邮件到support@aicoin.com,本平台相关工作人员将会进行核查。

Gate:注册解锁$6666
Ad
Share To
APP

X

Telegram

Facebook

Reddit

CopyLink