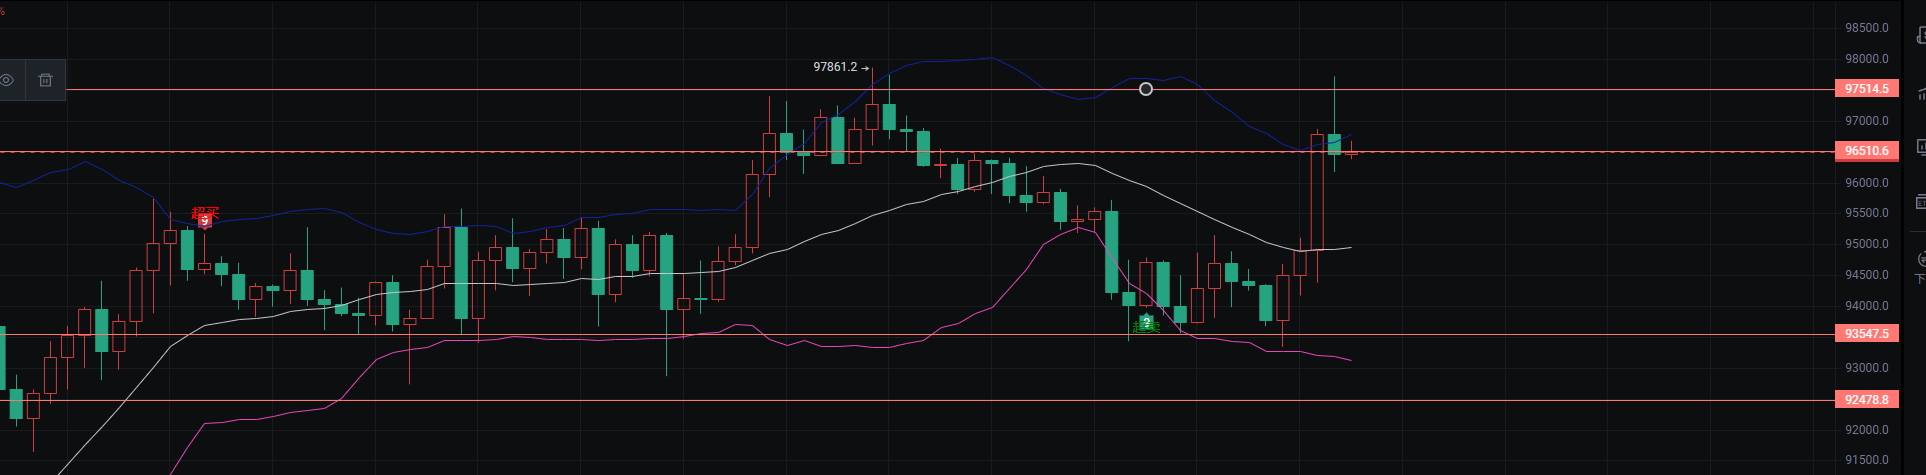
大饼K线四小时级别整体分析
近期价格走势方面显示出震荡上行的趋势特征,当前价格在96400附近波动。整体市场情绪偏向积极,虽然辨识度不明朗,也出现了强劲上涨的征兆。 短期来看,价格存在一定的上涨动力,尤其是受到布林带扩张以及例如红三兵形态的短期买方力量显现,可能继续冲击阻力,但同时需注意多个TD卖出设置标志及TD9的警告信号,这些或预示着市场的反转或趋势减缓。
建议:短期投资者可选择在短线支撑位附近介入,但需警惕阻力位97800的压力,一旦价格不能突破此阻力并出现涨势减弱的迹象,应考虑获利了结或止损离场。对于高风险承受能力的投资者,需时时审视TD指标对于趋势反转的预示,设定相应保护措施以防范潜在的市场回调压力。长线投资者在目前市场不确定性加重,需要保持谨慎观望。
技术分析 K线形态:震荡上行趋势,近期出现看涨吞没和红三兵表明短期买方力量强;但十字星可能暗示趋势减缓或反转。
TD: 高点出现TD9标志,提示反转或趋势结束,需警惕卖出信号。
BOLL: 布林带开口扩张,价格突破中轨后强劲上涨,市场乐观但波动加剧,需关注后续表现。
5.7大饼买卖点位
大饼买入点可以继续延续昨日的策略,昨日给出的多单策略也是完美接上
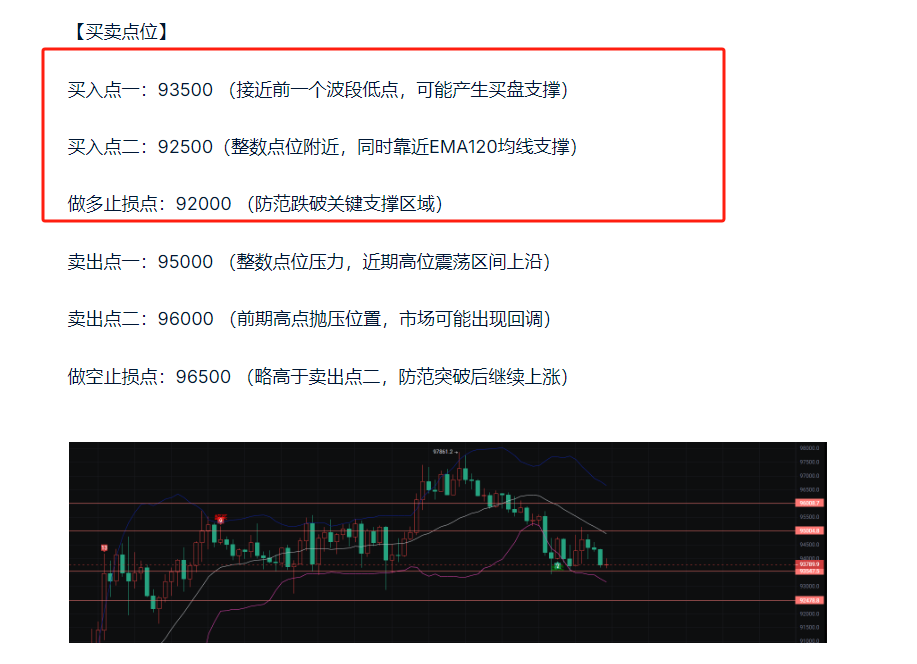
卖出点:96500 -97500(达到近期局部高点,面临潜在抛压。) 做空止损点:98000 (突破近期高点,并可能确认进一步上行趋势。)
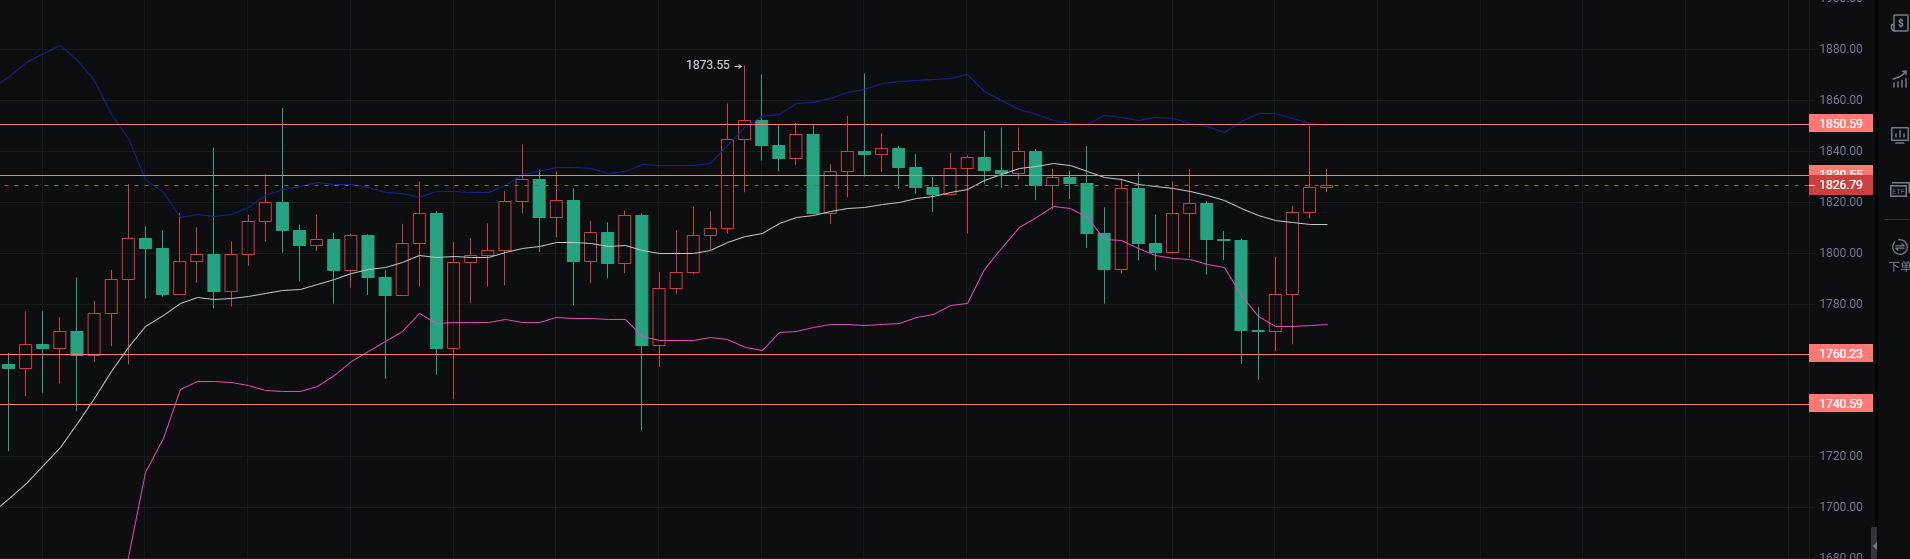
以太四小时级别K线整体分析
近期价格在1825附近,市场处于震荡趋势,波动区间在1740和1850之间。近期市场虽然有反弹迹象,但面临上方1850的强阻力,布林带通道收窄显示市场波动性暂时降低。 短期来看,市场可能处于整固阶段,价格可能继续在震荡区间内波动,缺乏明确突破信号。
建议:在现阶段观察市场关键点位突破情况,尤其关注是否能有效突破阻力位1850和支撑位1740.。若价格突破1850.59并形成新的支撑,可考虑适度看涨;若价格跌破1740,则需警惕进一步下行风险。在未有明确方向前,宜保持观望或采取区间交易策略。
技术分析 K线形态:近期出现了十字星、黑三兵和看涨吞没等关键形态,提示市场方向不明朗,关注价格在一个稳定区间内波动。
TD: TD序列“9”频繁出现暗示潜在反转点,尤其在接近阻力位1850附近时表现出较强压力。
BOLL: 整体布林带通道收窄指示市场波动性降低,K线处于中轨附近巩固调整阶段,需观察突破上下轨以判断下一步走势。
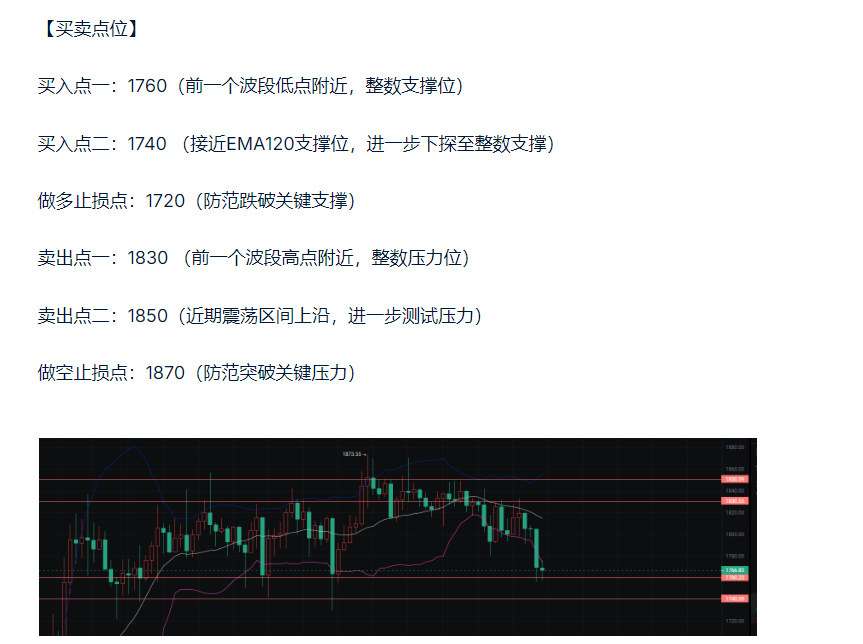
5.7以太买卖点位
可以继续延续昨日的策略,昨日的以太策略多单也是完美接上,目前是到了给出空单策略的位置附近
【以上分析及策略仅供参考 风险请自担,文章审核发布或有滞后策略不具备及时性,具体操作以比特大熊实时策略为准】

(注:📣 由于公开平台的信息时效性和深度有限,市场瞬息万变,关键拐点、精准操作策略、突发风险提示,等内容需在(公众号——比特大熊)第一时间同步。在这里,你能获得: 实时策略推送,深度分析支持、互动答疑,针对个人持仓提供风险预警和优化建议。 🚨 谨记:市场永远奖励行动更快、信息更准的人!做少数派的赢家。)
免责声明:本文章仅代表作者个人观点,不代表本平台的立场和观点。本文章仅供信息分享,不构成对任何人的任何投资建议。用户与作者之间的任何争议,与本平台无关。如网页中刊载的文章或图片涉及侵权,请提供相关的权利证明和身份证明发送邮件到support@aicoin.com,本平台相关工作人员将会进行核查。


