Original Title: "On-Chain Data Academy (10): Market Barometer RUPL (II) - The Strongest Top Signal & Detailed Analysis of Historical Cycles"
Original Author: Mr. Beggar, On-Chain Data Analyst
This article is the 10th in the On-Chain Data Academy series, which consists of 10 articles. It will guide you step by step in understanding on-chain data analysis. Interested readers are welcome to follow this series.
Related Reading: “On-Chain Data Academy (9): Market Barometer RUPL(I) Data Introduction & Bottom Fishing Application”
You may not know that there is a top signal that has never failed in historical cycles, and it is currently brewing…
TLDR
- The RUPL series consists of two articles, this is the second one.
- This article will share how to analyze market tops by simultaneously observing RUP and price trends.
- Building on that, this article will analyze the tops of each cyclical phase using the aforementioned method.
- From the perspective of RUP, the market is currently very close to a top position.
1. Simple Review of RUPL
RUPL stands for Relative Unrealized Profit and Loss, which can be split into RUP and RUL, representing Relative Unrealized Profit and Relative Unrealized Loss, respectively. The main use of this data is to indicate the current overall profit and loss status of the market. For a detailed explanation of the RUPL indicator, please refer to the previous article: “On-Chain Data Academy (9): Market Barometer RUPL(I) Data Introduction & Bottom Fishing Application”.
2. Application of RUPL in Top-Taking
As mentioned in the conclusion of the previous article, today I will share a powerful application of RUPL in top-taking. In this application, we only need to use RUP and temporarily disregard RUL:
When RUP diverges from the price trend of $BTC, it likely indicates a top has formed.
Specifically, when the price of $BTC reaches a higher high, but RUP reaches a lower high, a divergence is established.
The logic behind this is:
As mentioned in the previous article, the calculation of RUP requires summing the Unrealized Profit in the market. The Unrealized Profit of large holders is far higher than that of small holders. Logically, when the price reaches a higher high, RUP should also rise. However, if the aforementioned divergence occurs (higher price, but lower market profit status), the only possibility is that "large holders have begun to sell their holdings and distribute."
- This logic is similar to Realized Profit and can serve as a cross-validation reference. For an introduction to Realized Profit, please refer to the following article: “On-Chain Data Academy (3): Have the Bottom Accumulators Taken Profits?”.
This explains the logic of "why RUP divergence can serve as a top signal." However, it is still necessary to note: For market phase judgment, the most accurate approach should be to observe other on-chain indicators together to avoid the pitfall of "seeing the sky through a tube."
3. Detailed Analysis of Historical Cycle Tops
Having understood the logic of RUP divergence, if we do not verify it in practice, it remains mere theory. Therefore, in this section, I will take you through the historical tops of $BTC:
2013 Bull Market Top
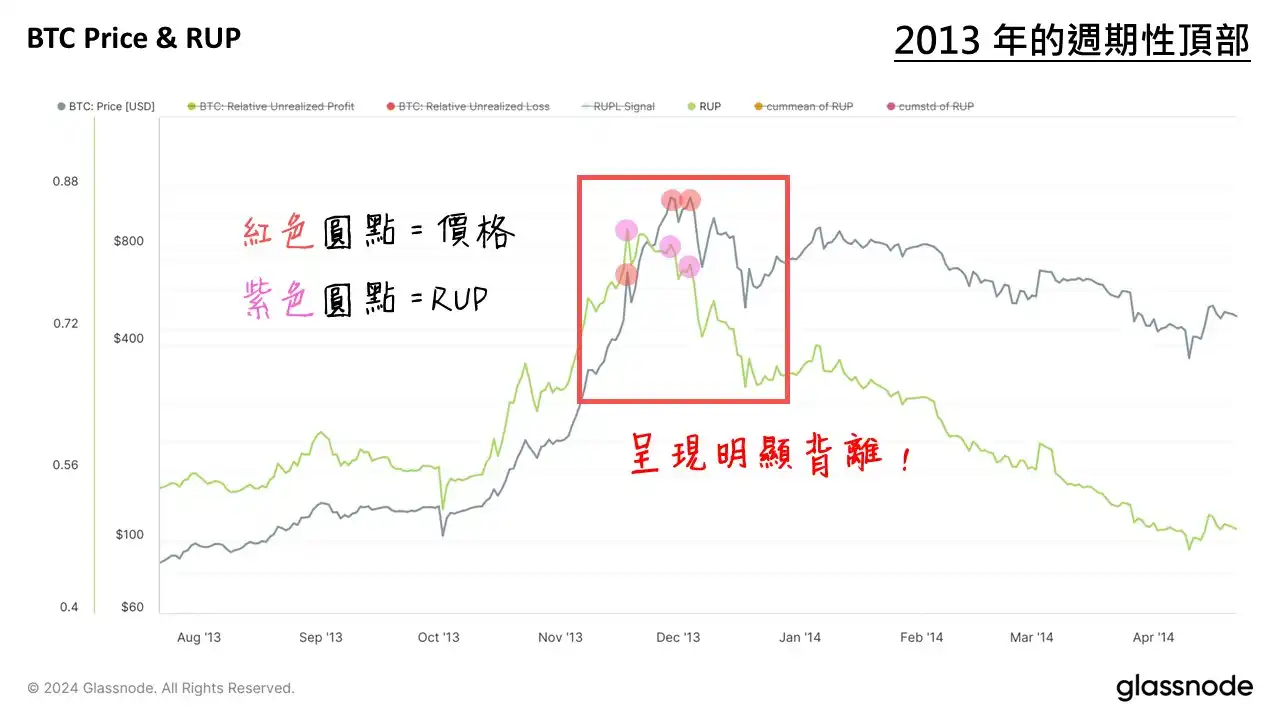
As shown in the figure, the green line represents RUP, and the black line represents BTC price. At the top, there was a "three-stage divergence" where the price continuously reached two higher highs, while the corresponding RUP continuously reached lower highs, perfectly aligning with the previously described RUP divergence top signal.
2017 Bull Market Top
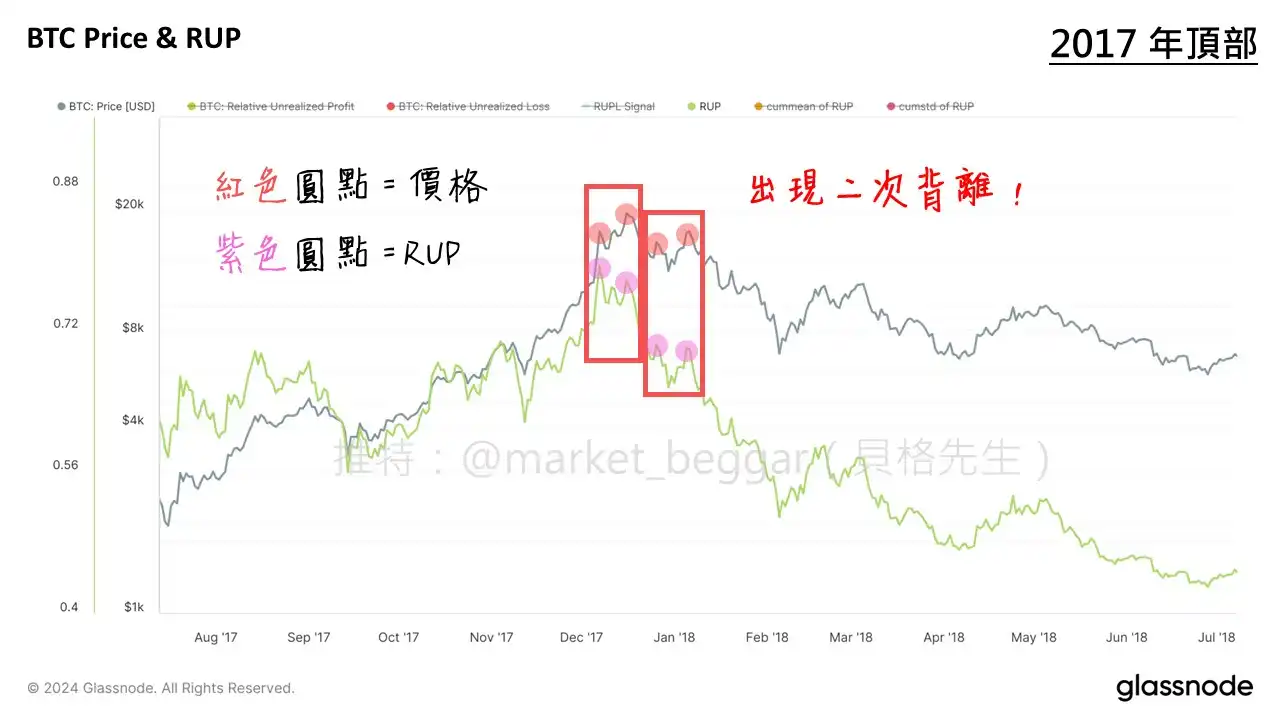
As shown, the 2017 top also exhibited RUP divergence signals. At this top, RUP diverged when the price reached its peak; subsequently, as the price struggled to rebound, a second divergence occurred, providing ample opportunity to escape.
2021 Bull Market Top
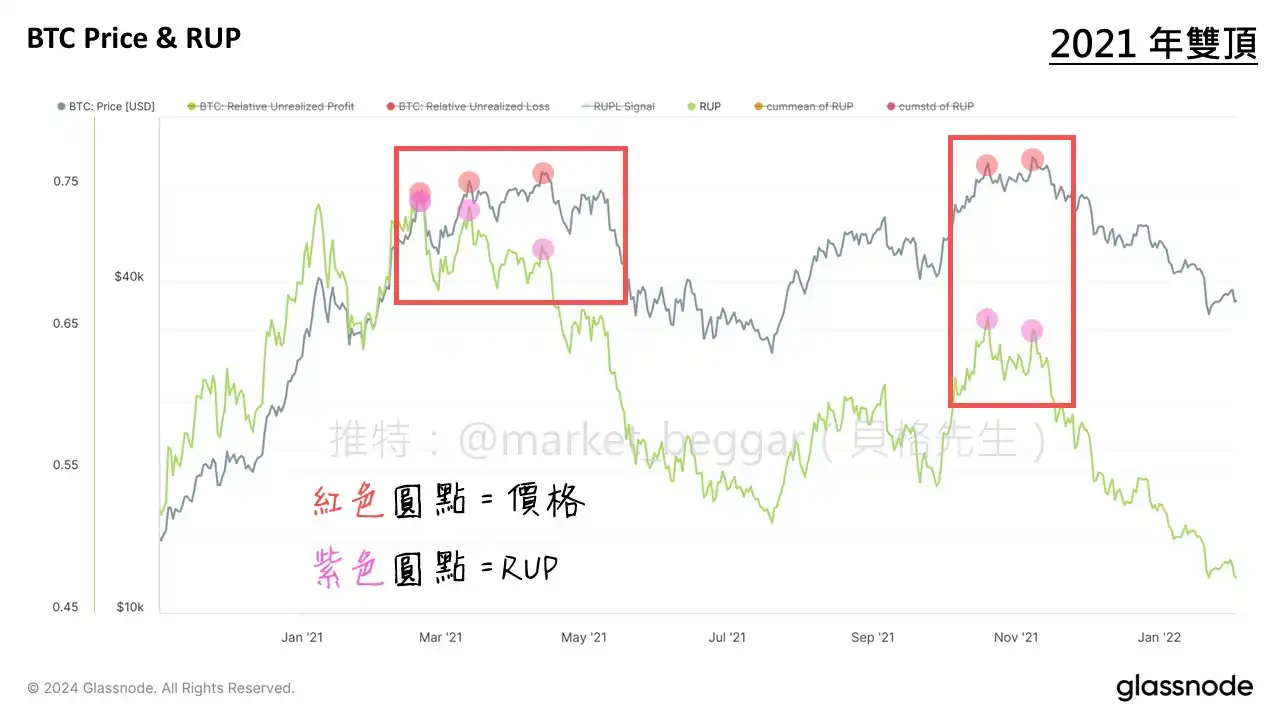
As shown, 2021 presented a somewhat unique "double top structure." I analyzed the two tops separately. The first top was similar to 2013, showing a "three-stage divergence"; the second top also exhibited RUP divergence during the top phase.
Thus far, all three historical cycle tops have shown RUP divergence without exception. Of course, this does not mean that every future top will necessarily show divergence, but based on current data, there has been no exception. So… what about this round?
4. Potential Top in 2025: Current Market Phase Analysis
Here’s the chart:
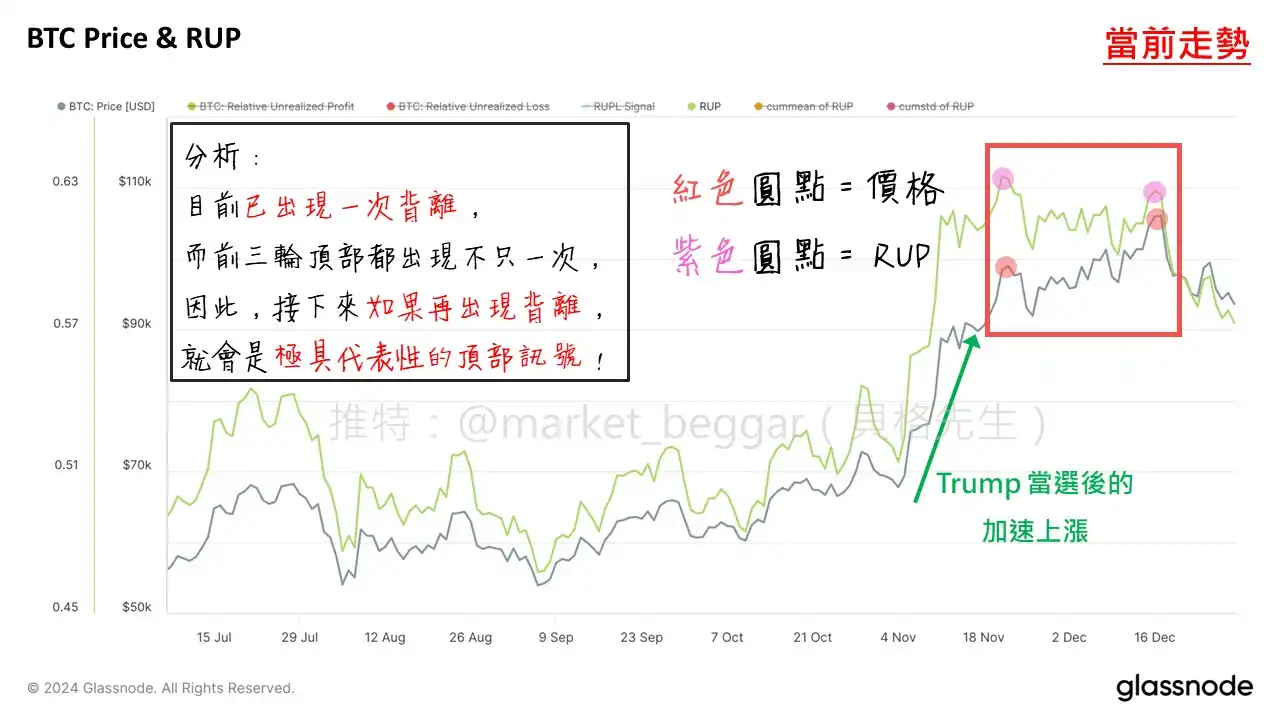
It can be seen that in this cycle, a "single" RUP divergence top signal has already appeared. Combining this with the content of the top-taking weekly report, or from data such as URPD, Cointime Price, Realized Profit, etc., one can find some signs of a top emerging.
A slightly optimistic note: Based on the previous three tops, except for the second top in 2021, the first tops in 2013, 2017, and 2021 all exhibited at least two divergences, while currently, only one has appeared.
Therefore, based on historical patterns, if the price of $BTC reaches a new high in the short term, it is highly likely that a three-stage divergence similar to the first tops of 2013 and 2021 will occur. At that time, it will undoubtedly be a top-taking opportunity worth focusing on for all readers.
Supplement 1: Current latest data chart can be referenced in the comments section.
Supplement 2: Related materials mentioned in the article
- Cointime Price Series (three articles in total, see links in citations): “On-Chain Data Academy (8): A New, Ark Participated Research on BTC's Magical Pricing Methodology (III)”
- URPD Introduction: “On-Chain Data Academy (4): Visualized BTC Chip Price Distribution Chart”
免责声明:本文章仅代表作者个人观点,不代表本平台的立场和观点。本文章仅供信息分享,不构成对任何人的任何投资建议。用户与作者之间的任何争议,与本平台无关。如网页中刊载的文章或图片涉及侵权,请提供相关的权利证明和身份证明发送邮件到support@aicoin.com,本平台相关工作人员将会进行核查。


