原文标题:《链上数据详细分析:或许你需要做好随时逃顶的准备》
原文作者:貝格先生,链上数据分析师
TLDR
- 本文将从链上数据的视角,详解个人判断接近顶部的依据
- 历史上的周期大顶都有「2 次明显的派发阶段」,目前是第 2 次
- 解释市场见顶的原理:低成本筹码的派发完成
- 判断顶部会出现在 Q1
- 从交易员的视角,解释如何观察并动态修正交易模型
一、 $BTC 市场顶部形成的底层原理
每轮熊市阶段都会有大量参与者默默在累积筹码,俗称「吸筹」,随著市场情绪进入极端冰点、交易冷清、价格甚至跌破长期持有者的平均成本时,即是见底之际。相关阅读资源:《链上数据学堂(六):一套崭新、Ark 参与研究的 BTC 神奇定价方法论 (I)》
随著牛市启动,价格飙涨,这些在熊市时期积累的筹码就会开始不断派发。当派发结束时,市场上剩余的筹码都是「相对高价接盘」的参与者。由于这些参与者的成本价较高,因此一旦后续价格没有继续上涨,甚至仅仅是维持宽幅震荡,都会加剧他们的持仓压力,引发抛售的可能性就会大幅增加(相对低成本筹码而言),最终,一旦某些高价接盘的筹码开始恐慌卖出,导致价格下跌,就会进一步引发其他高成本筹码卖出,产生连锁反应,牛市宣告结束。
补充:这点在 $BTC 市场中更为明显,因为在股票市场中,多数公司都有基本面做支撑,股价是根据折现率将公司未来的现金流折算成当前的价值。
二、周期大顶总是伴随 2 次派发
理解市场见顶的原理后,接着读者们可以先看下图:
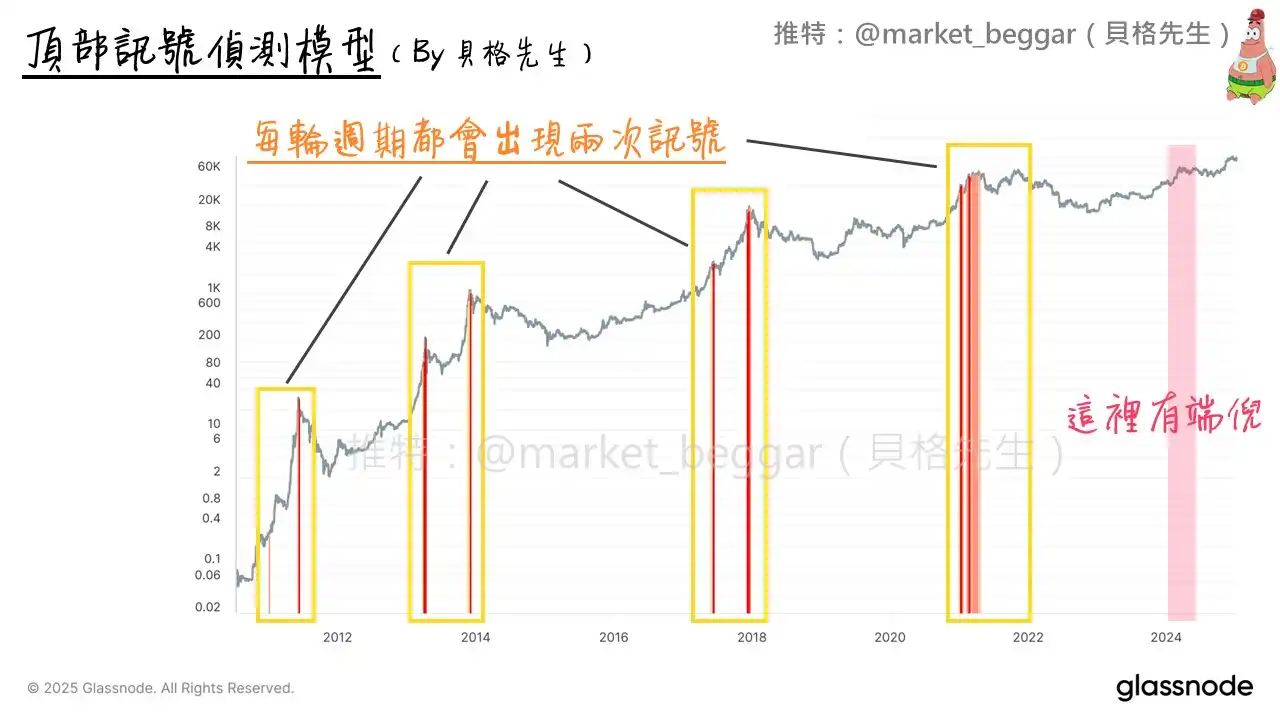
这是敝人根据链上数据设计的顶部讯号模型,也是每周的逃顶周报中会附上的内容。可以看到,历史上每一轮周期见顶之前,都会出现 2 次讯号。
单纯刻舟求剑去说「因为以前都这样」肯定是不行的。
逻辑上,会出现 2 次派发的根本原因在于:
· 第 1 次派发代表价格开始飙涨,低成本筹码开始出货
· 第 1 次派发结束后,价格开始回调,引入大量抄底买盘
· 市场情绪继续推动至极端高昂,大量买盘涌入,承接了剩余低成本筹码的派发
由于低成本筹码的量体巨大,通常无法在第 1 次完成,因此需要透过牛市情绪带入的巨量买盘,再次进行第 2 次派发。
三、这轮牛市周期发生了什么?
各位可以再看一次上面的顶部模型讯号图,应该会发现这轮周期其实还没有出过顶部讯号。
但敝人在设计模型、研究市场动态的时候,其实有发现一些「端倪」。我将发现端倪的区域标註,用半透明红色标註在图中右侧。接着,我将向各位读者说明,我看到了什么警讯:
1.Realized Profit
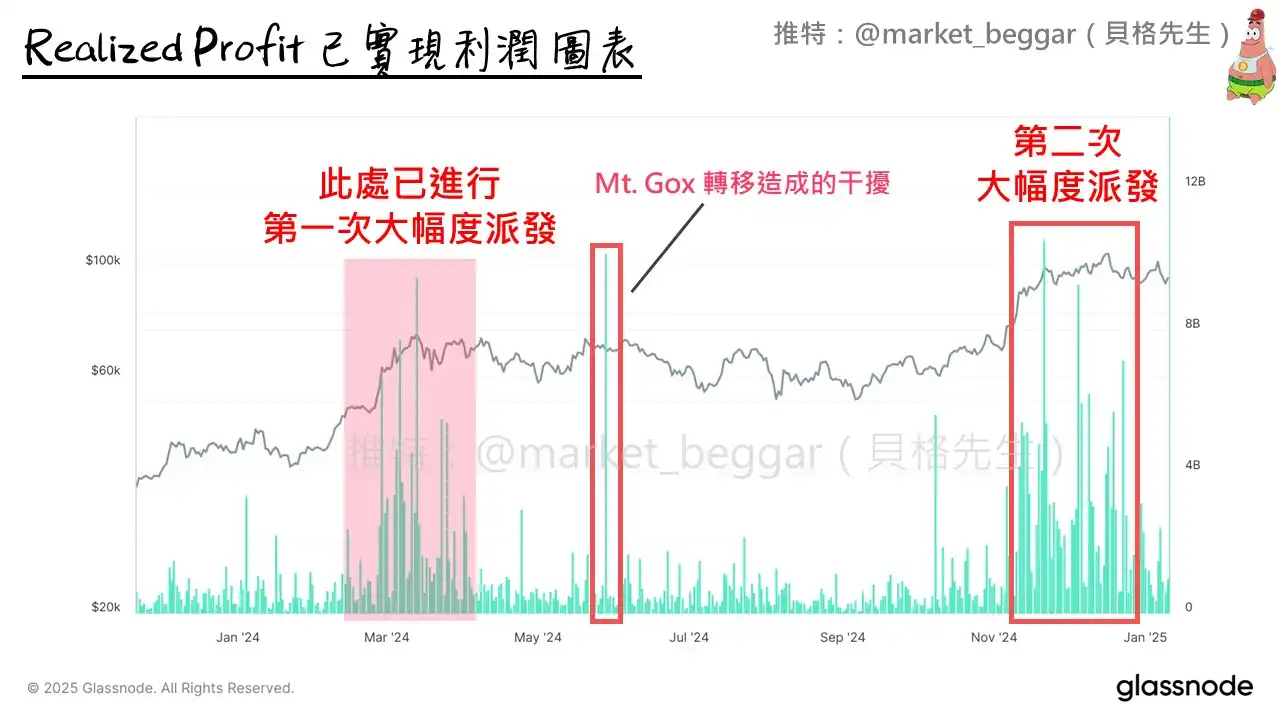
上图是 Realized Profit(已实现利润图表),我将图一中「有端倪的区域」一样用半透明红色标註。
可以看到在 2024 年三、四月,价格暴涨超过 70k 时,已出现过一次巨量的获利了结(第一次派发)。而在去年年底,随著价格冲破 10 万大关之时,Realized Profit 中再次出现巨量(第二次派发)。因此,从 Realized Profit 的视角,其实已经出现了 2 次派发。
相关阅读资源:《链上数据学堂(三):底部吸筹的庄家们获利了结了吗?》
2.AVIV Heatmap
AVIV Heatmap 也是每周周报都会放置的内容,主要目的是观察市场当前是否处于「过热」阶段。AVIV 数值,可暂时理解为「更为精确」的 MVRV,详细的原理解说,我会在未来单独写成一篇文章做说明。
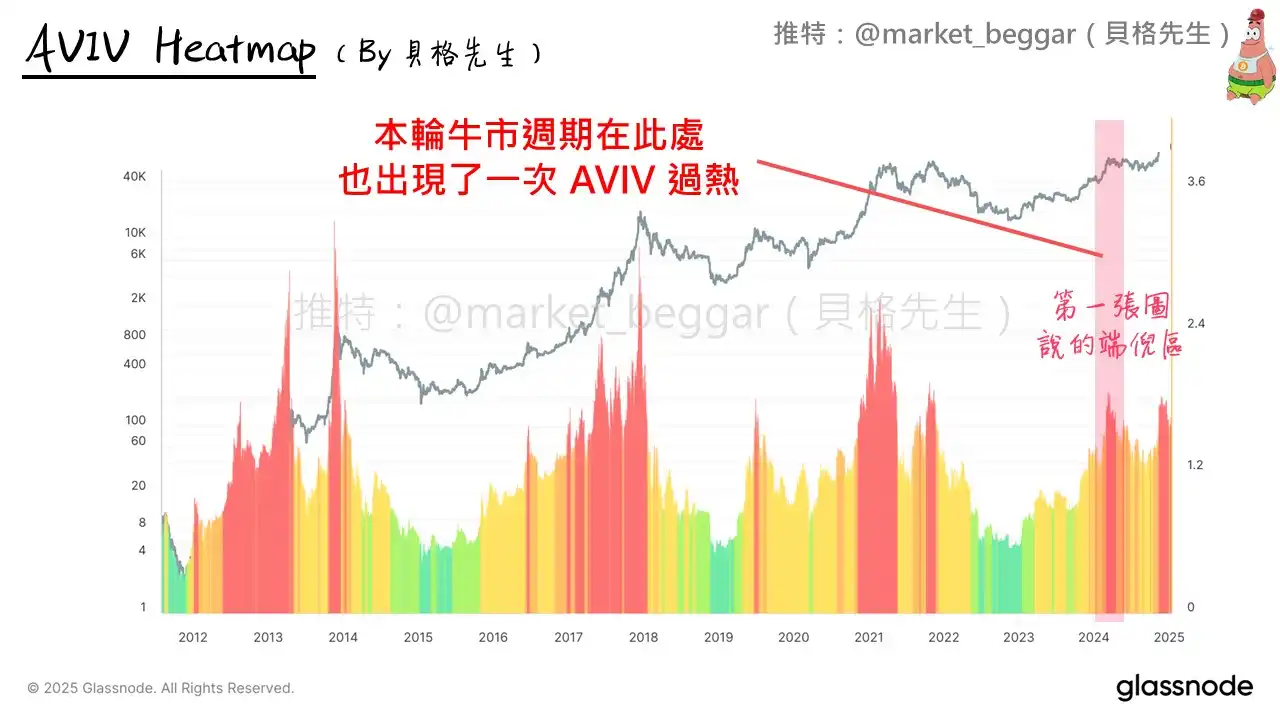
如图所示,我一样将「端倪区」,也就是今年的三、四月左右标记出来。可以看到当时在 AVIV Heatmap 上出现了一段时间的「过热」,随后经过半年左右的宽幅震荡,化解了过热状态;而后当价格突破 10 万大关时,AVIV 再次显示过热。
因此,从 AVIV 的视角,仍然表明当前我们处在「第二次派发」的阶段。
3.Cointime Price Deviation 顶部模型
敝人曾在去年 12/27 写过一篇文章,内容是解释我如何利用 Cointime Price 设计出一套顶部的筛网模型:
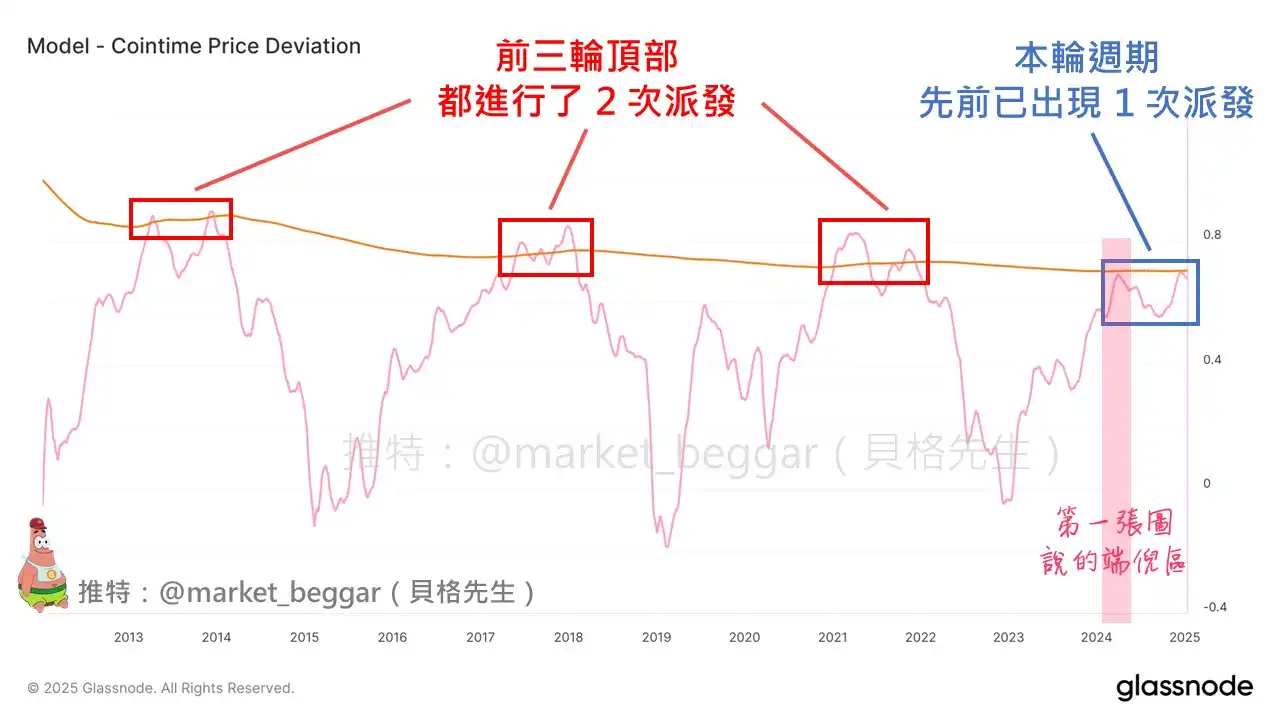
目前模型的状况如上图,可以看到:历史上的每次周期性顶部,都会对应 2 个明显峰值(2 次派发),这与本文第二段所阐述的概念相互印证。
而在本轮周期中,第一个明显的峰值(端倪区)已然产生,目前正处在第二个峰值处(且已经出现拐头的迹象)。
四、为什么图一的顶部讯号模型没有跳讯号?
藉由本文,顺便向各位读者说明这个问题。由于顶部讯号模型中,包含诸多参数,这些参数是由我主观设定的。个人在研究、设计时,其实有刻意将讯号的触发条件放宽,但仍未让去年三、四月时的派发产生讯号。
不过这点无伤大雅,因为作为一名交易员,在分析市场时,不可能仰赖单一模型或讯号。特别是这类包含主观参数的模型,敝人在使用上只会将其作为参考依据,在实务判断上,仍会综合各类指标与数据一併分析。
最后多嘴一句:「这轮牛市,是很好用来考验市场上各类顶部讯号的时机,因为多数的顶部讯号都只是单纯的刻舟求剑,失效概率极高」。
五、结语
本文篇幅稍嫌有些长了,还请各位谅解。非常感谢耐心阅读至此的读者,希望本篇文章对你有帮助。
除了本篇文章提及的内容以外,先前个人撰写的 RUP 顶部讯号也是一个极具代表性的迹象:《链上数据学堂(十):市场晴雨表 RUPL (II) - 最强顶部讯号 & 历史周期顶部详细分析》
并且在后续价格出现下跌后,敝人也基于在 RUP 顶部讯号撰写的内容,紧急加更了一篇「右侧逃顶策略」:https://x.com/market_beggar/status/1876836457555616173
如果你认可我的观点,那么此时此刻,或许你应该做好随时逃顶的准备 ...
免责声明:本文章仅代表作者个人观点,不代表本平台的立场和观点。本文章仅供信息分享,不构成对任何人的任何投资建议。用户与作者之间的任何争议,与本平台无关。如网页中刊载的文章或图片涉及侵权,请提供相关的权利证明和身份证明发送邮件到support@aicoin.com,本平台相关工作人员将会进行核查。


