昨天早上喉咙就开始不舒服了,今天比昨天更加严重,刚刚试了一下说话含混不清像鸭子一样,视频是录不了了,只能发个短文简单说一下行情。另外过两天就是清明节,后面两天也打算停更休息两天,清明过完再继续搬砖。提前祝大家清明安康!
回到行情当下,既然大饼4小时级别三卖已经出现,那我们就耐心等待三卖向下一段内部出现结构再考虑要不要开始介入。一般情况下4小时要走一段最少也是10天半个月的,所以从时间周期上看从24日88765高点开始算起到今天4月1日只走了一个星期,除向下线段内部还没结构之外时间周期也不够。直接上图:
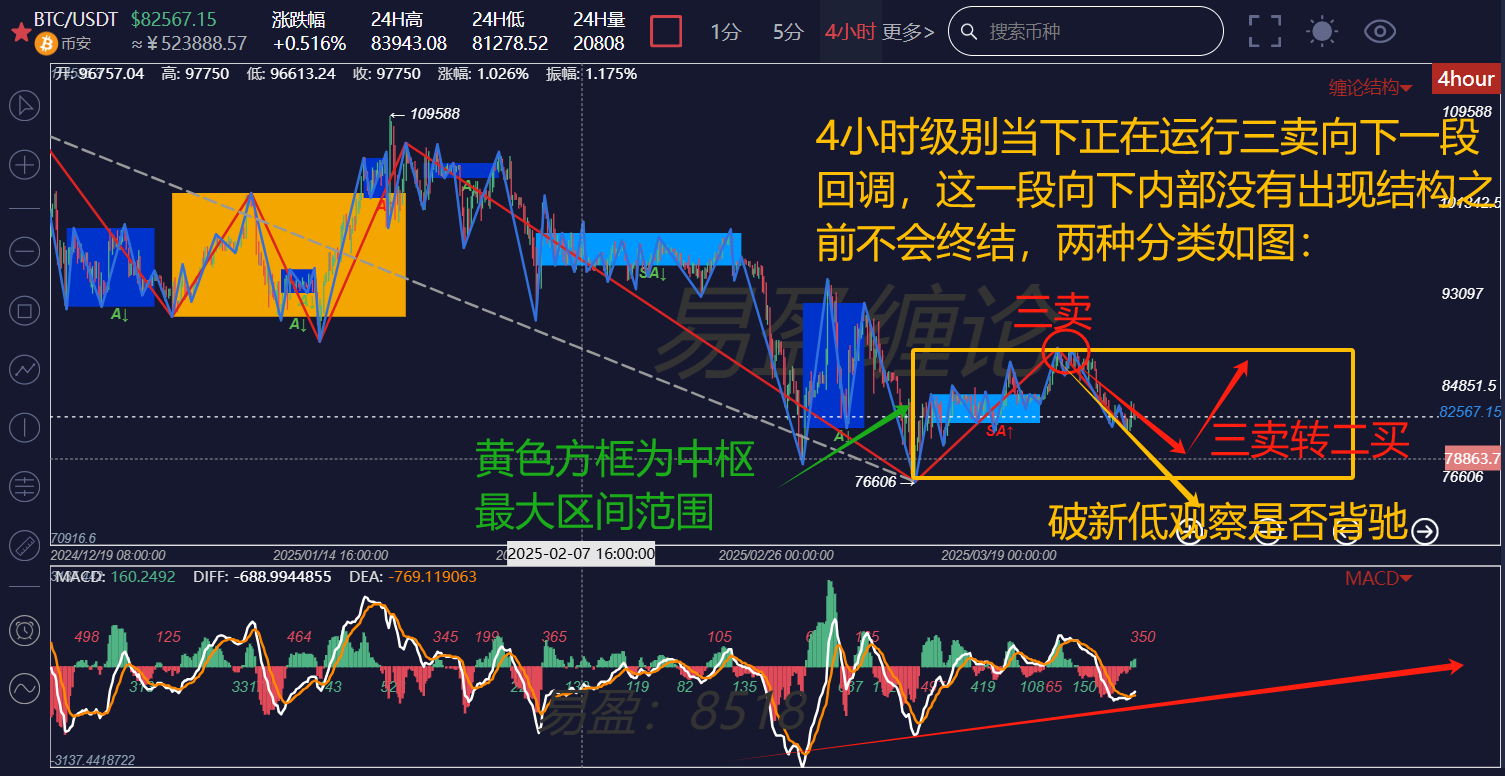
站在4小时级别观察,三卖的出现说明大饼4小时向下走势类型已经由一个中枢的盘整向下生长成为两个中枢的下跌趋势,当下正在构造第二个中枢。在第二个中枢构造完成之前没有大的操作机会!大的操作机会在于4小时级别第二个中枢构造完成破新低趋势背驰的买点机会,这个时间最快也要4月下半个月到5月初去了。
接下来需要关注的就是三卖之后的买卖点转换关系:是三卖转不创新低二买还是破新低背驰一买。至于市场会选择哪种走势我们无须预测,只需要跟随次级别30分钟向下走势类型的生长演变即可。
至于什么时候抄底比较安全,一个最基本的判断标准就是日线底分型。日线底分型不出现下跌不会终结,更具体的解释为日线底分型不出现日线级别不可能走出向上一笔,通俗点说是没有日线级别的上涨,只有4小时级别的次级别或者次次级别的反弹。这里有涉及到级别的问题篇幅有限今天就不再多言了。
下个礼拜见!
以上分析仅供参考不构成任何投资建议!
朋友们如果对缠论感兴趣,想免费获取缠论学习资料,收看公开直播,参加缠论线下训练营,学习缠论精进自己交易技术,构建自己交易体系达到稳定盈利目标,利用缠论技术及时逃顶和抄底。可以扫码关注以下公众号私聊获取和添加本号微信!

免责声明:本文章仅代表作者个人观点,不代表本平台的立场和观点。本文章仅供信息分享,不构成对任何人的任何投资建议。用户与作者之间的任何争议,与本平台无关。如网页中刊载的文章或图片涉及侵权,请提供相关的权利证明和身份证明发送邮件到support@aicoin.com,本平台相关工作人员将会进行核查。