该来的终究还是来了,虽迟但到!
在上周五文章《走势延伸》里已经再次预警BTC高位风险!大饼在23日凌晨创下新高99588之后,包括周末在内连续多天高位震荡。昨天下午5点钟反弹出30分钟二卖98871,在凌晨放量下跌,最低打到了92600,当下价格为94000。
风险都是涨出来的,这一次大饼大回调之前给足了减仓时间。当然高位没有来得及减仓的也不必恐慌,现在只是4小时级别向下一段回调,牛市只走到了中后期,大方向仍然是看涨,长线仓位仍然可能继续持有不动,等待大级别结构出信号。
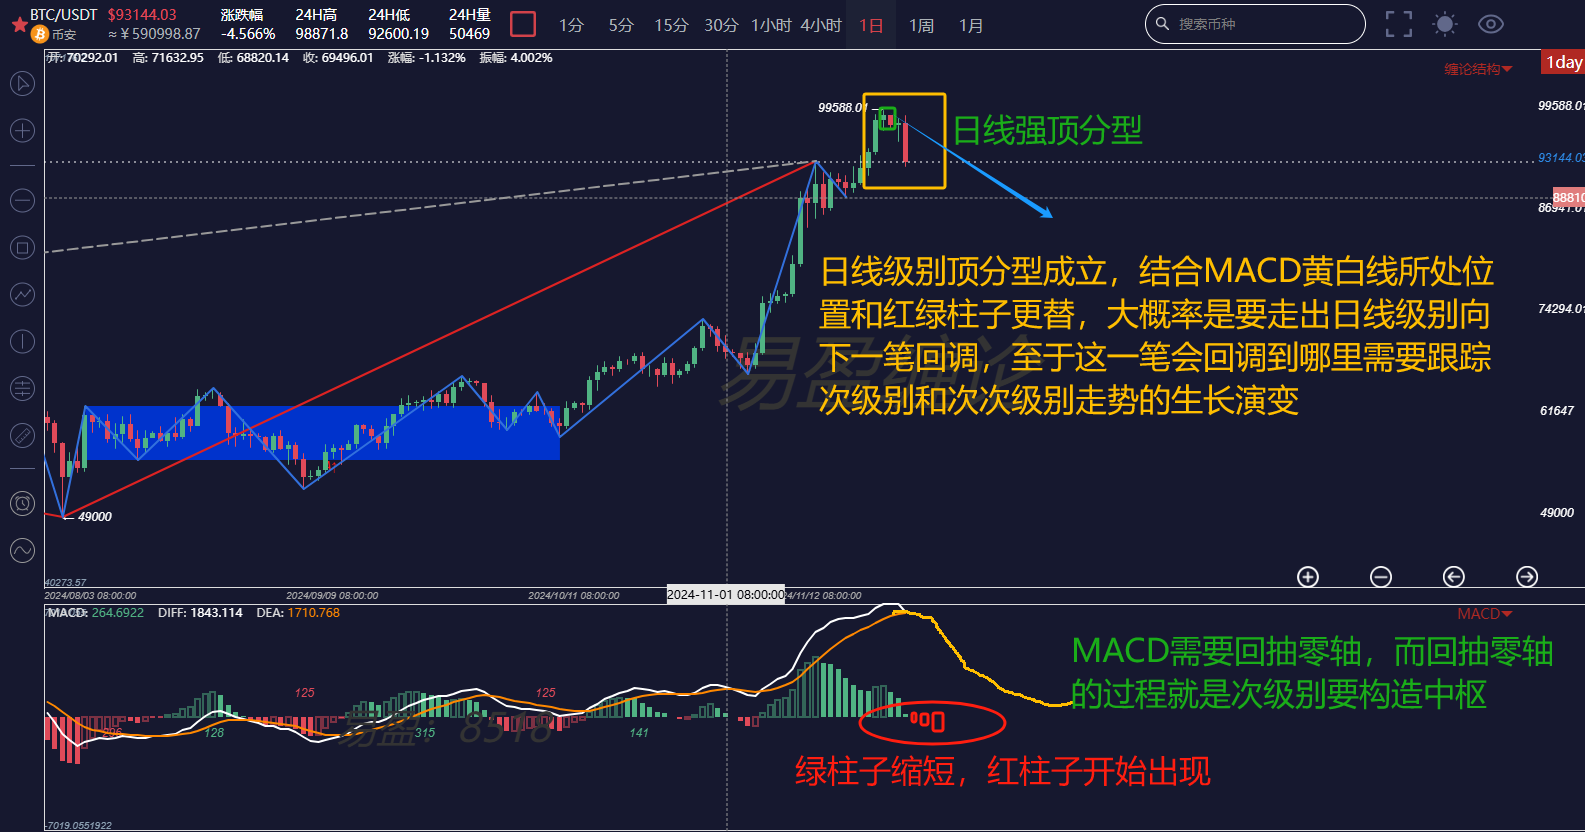
先看大饼日线图,图中可以看出日线出现强势顶分型,结合MACD所处位置和红绿柱子交替来研判最少是要回调日线一笔向下。而站在本级别看,高悬的MACD回抽零轴意味着次级别需要构造中枢。也就是说次级别中枢构造完成之后大概率还会继续向上突破。
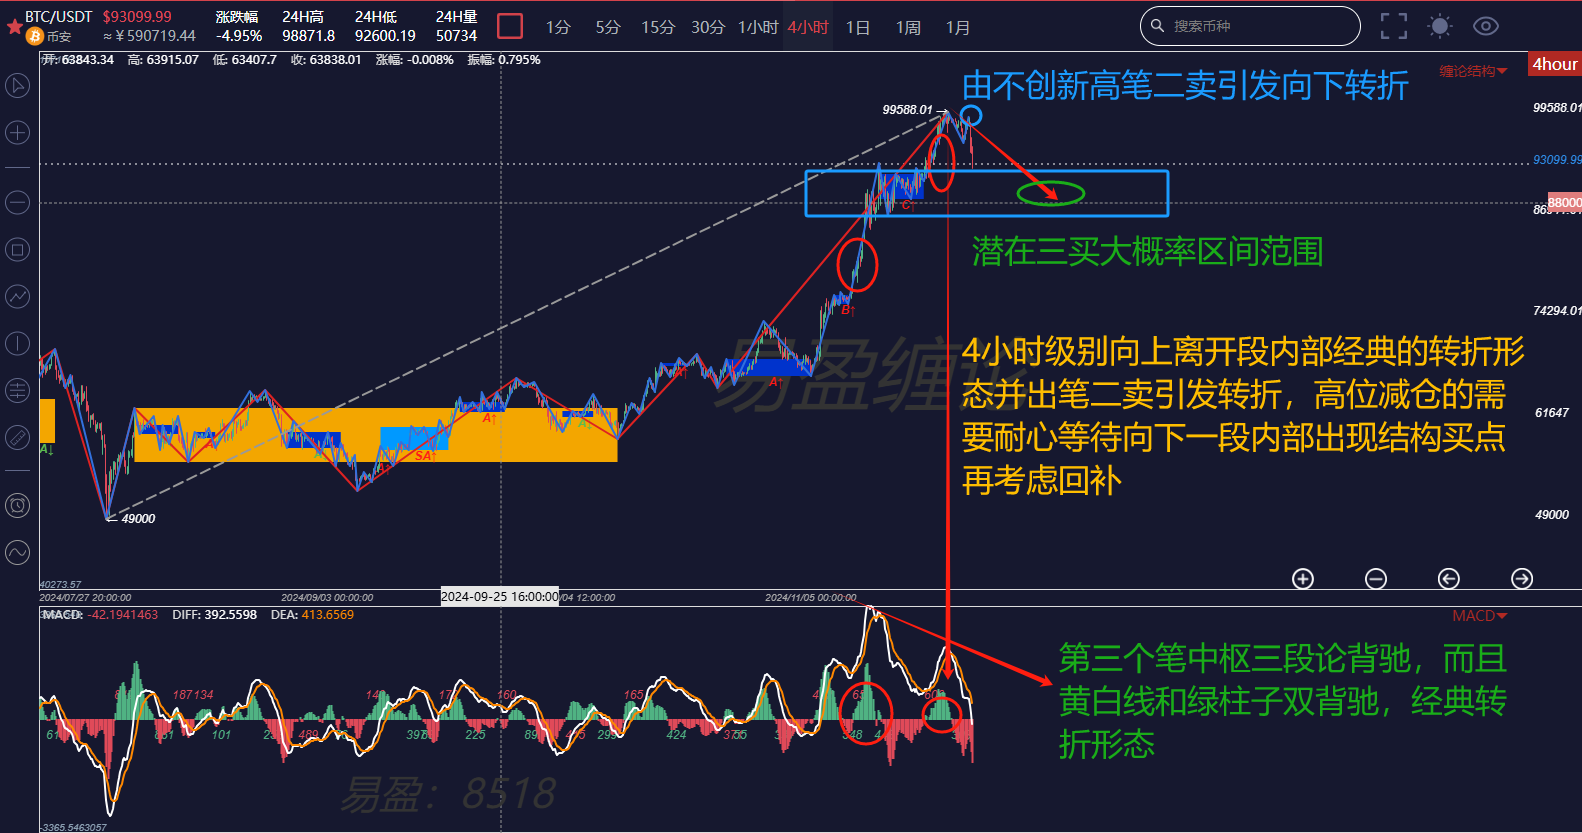
再看4小时图,图中可以看出4小时向上离开段内部出现三段论背驰形态,而且是缠论技术里经典的转折形态。这里将要走出4小时向下一段回调,这一段回调的区间可以参考左侧笔中枢区间范围,大概率还会出三买之后再走向上一段。至于具体回到位置则需要关注次级别走势类型的生长演变。
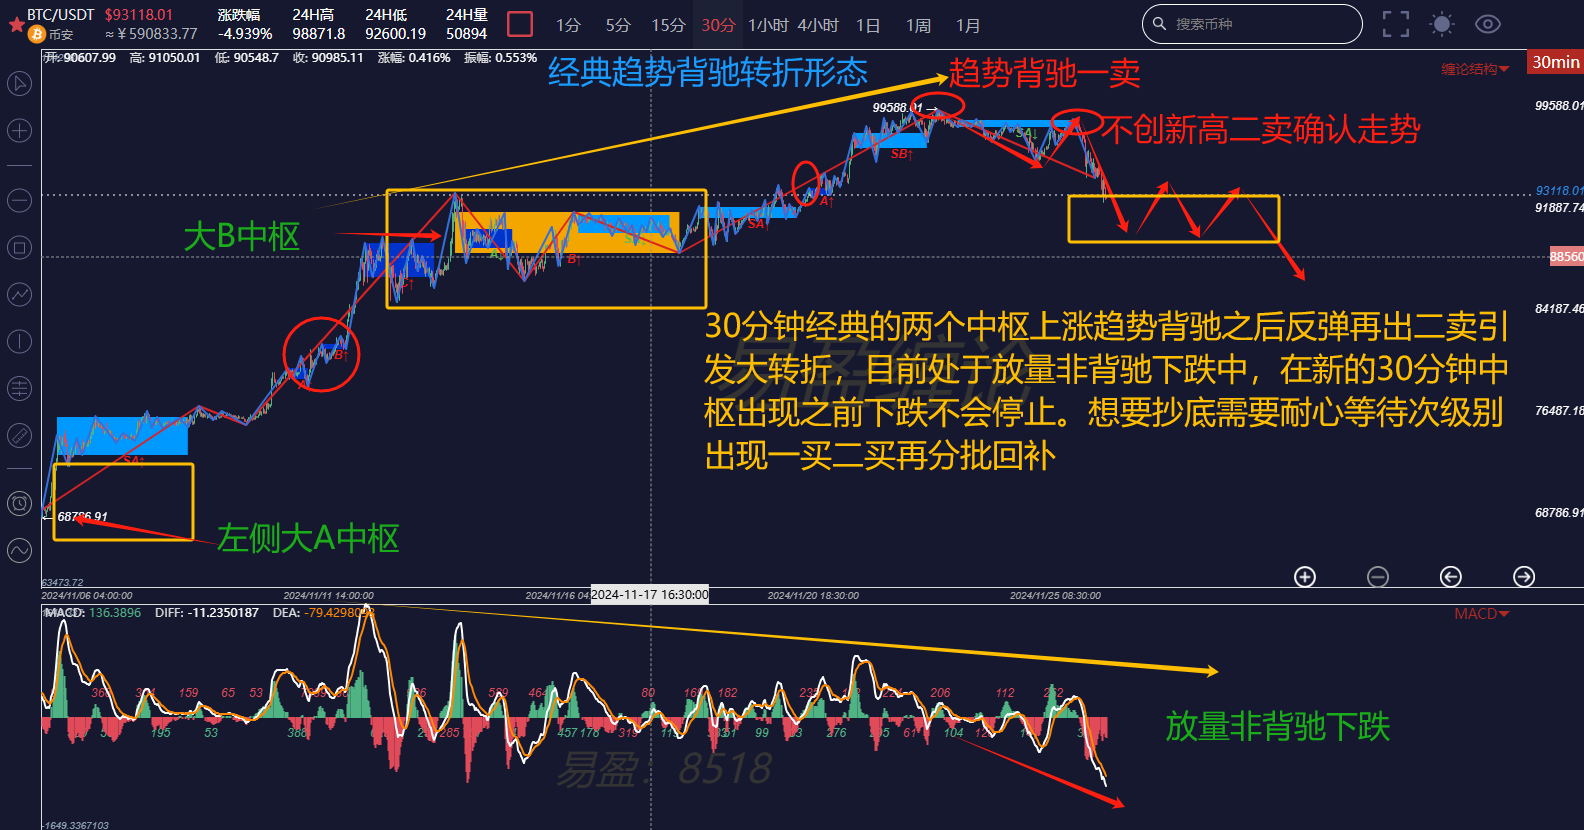
最后看30分钟级别,4小时向上离开段内部结构在本级别里就能看得非常清楚。经典的两个中枢上涨趋势背驰向下回调之后反弹出二卖确认回调走势。
总结:从当下回调的力度来看处于放量非背驰下跌状态,因此可以得出结论:在新的30分钟中枢出现之前下跌不会终结。想要抄底的现在只是30分钟级别及以下小级别的底,大级别机会需要耐心等待,从时间周期看最少是7到10天时间。
交易是一套系统
交易口诀,有诗曰:
策略为本,逻辑为纲,
指标为辅,结构为王。
计划为矛,纪律为盾,
风险为首,心态为防。
以上分析仅供参考不构成任何投资建议!
朋友们如果对缠论感兴趣,想免费获取缠论学习资料,收看公开直播,参加缠论线下训练营,学习缠论精进自己交易技术,构建自己交易体系达到稳定盈利目标,利用缠论技术及时逃顶和抄底。可以扫码关注以下公众号私聊获取和添加本号微信!

免责声明:本文章仅代表作者个人观点,不代表本平台的立场和观点。本文章仅供信息分享,不构成对任何人的任何投资建议。用户与作者之间的任何争议,与本平台无关。如网页中刊载的文章或图片涉及侵权,请提供相关的权利证明和身份证明发送邮件到support@aicoin.com,本平台相关工作人员将会进行核查。