BTC
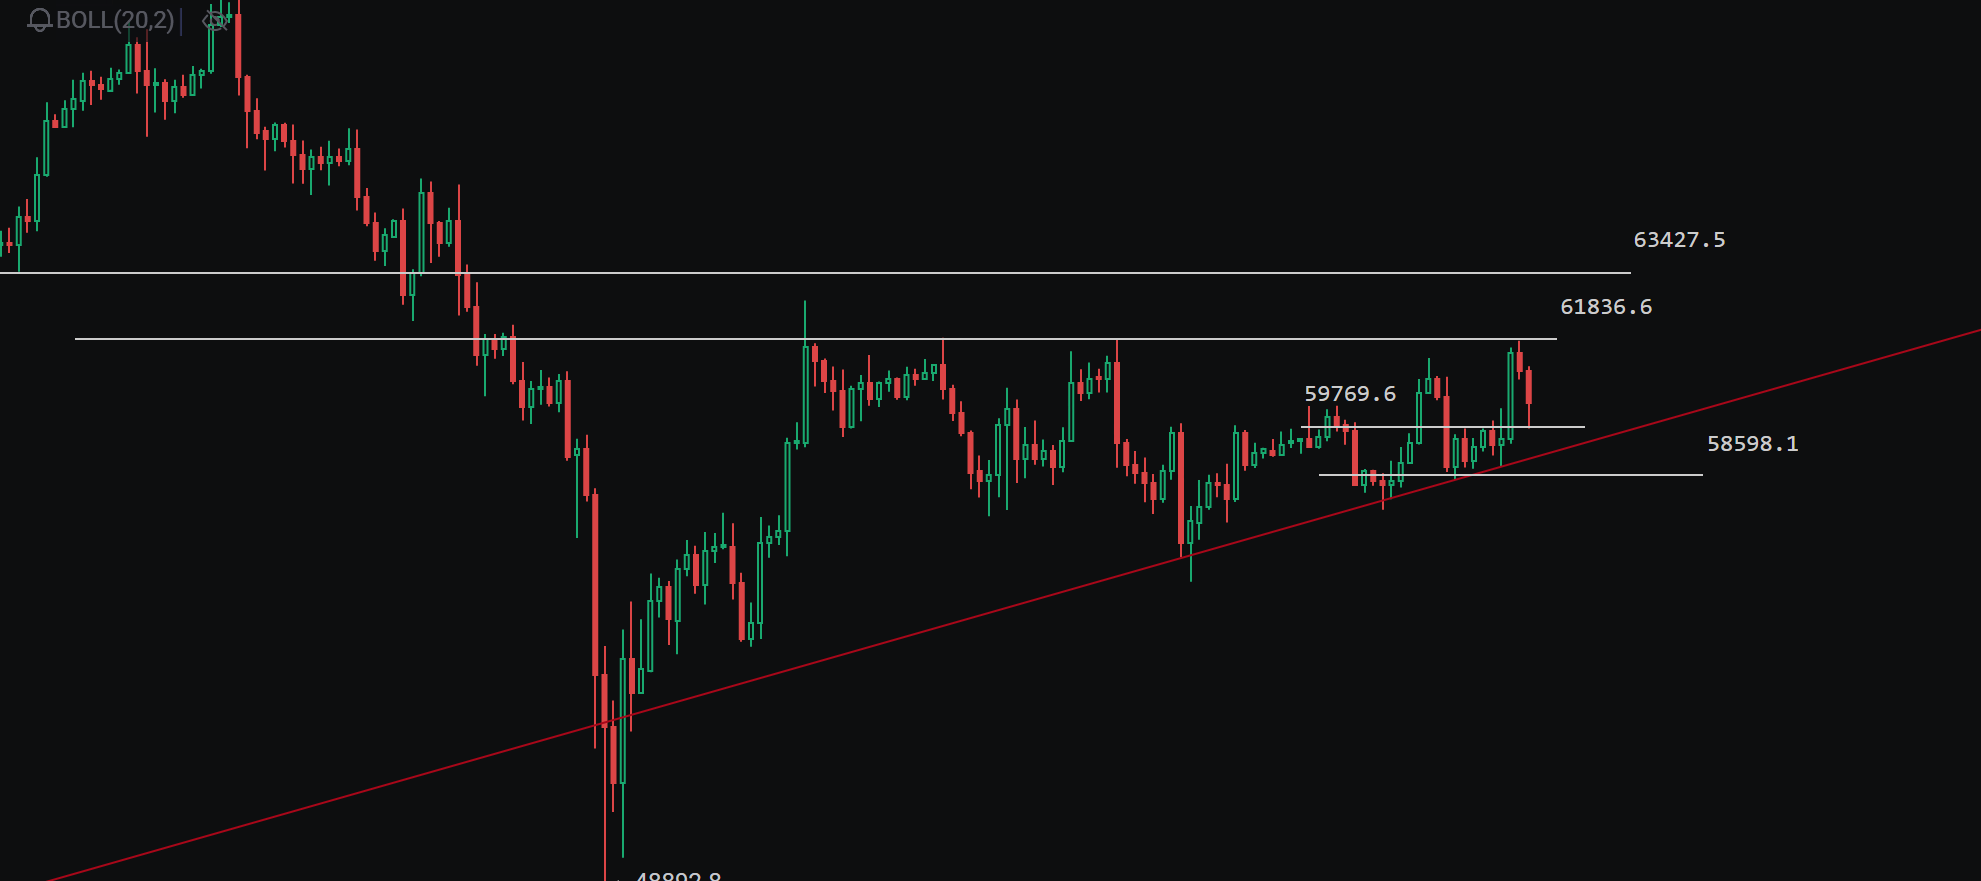
As for Bitcoin, the current daily chart shows that the naked K-line structure has not yet broken through the previous high point of 61800, and has not stabilized above the daily EMA144 moving average. In terms of BOLL, the closing price yesterday has already stabilized around the middle track position, and there has not been a significant retracement in the current price. Overall, the performance looks good. In the short term, it may experience a pullback due to resistance at the upper level. Looking at the 4-hour chart, the naked K-line structure shows that the retracement low is gradually rising, but the upper resistance level remains unchanged. Currently, the price has risen above the 4-hour EMA144 moving average. In the short term, attention can be paid to the support at the halfway point between the 4-hour EMA144 moving average and the naked K-line large bullish candle body. If it cannot be effectively supported, the market may once again retest the position near the 4-hour upward trend line at around 59100. The bottom MACD has already formed a golden cross and is in the stage of increasing volume, but it has not continued to increase significantly. On the hourly chart, after the price fell below the EMA144 moving average yesterday, there was no sustained increase in volume, and after oscillating and recovering, it once again experienced a short-term rise. Currently, the bullish volume of the MACD on the hourly chart is starting to decrease. If the price can once again test the resistance level at the top without breaking it, short-term operations can be considered. In summary, overall, the daily chart has not yet broken through the key resistance level, so short-term operations should still be the focus.
Resistance: 61800-63500
Support: 59800-58500
ETH
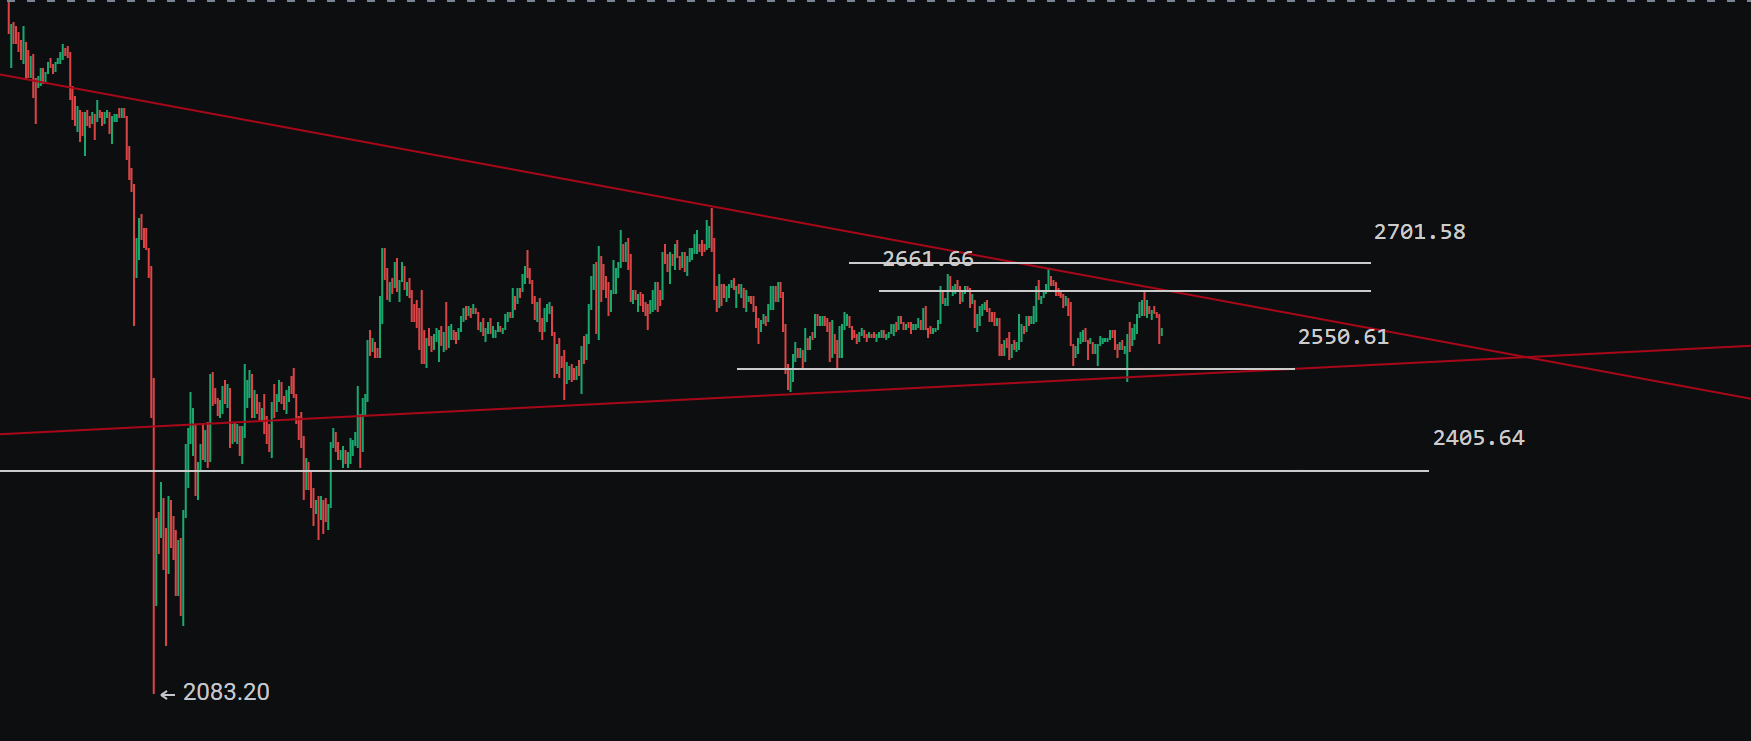
As for Ethereum, the overall performance is relatively weak. Currently, on the daily chart, it has not broken through the top of the range. Looking at BOLL, the price broke through the middle track and then fell back below it. Although the bottom MACD has formed a golden cross, it has not continued to increase significantly in bullish volume. Looking at the 4-hour chart, the high point of the naked K-line structure is gradually decreasing, and the retracement low is gradually rising, forming a 4-hour triangular convergence pattern. In the short term, attention can be paid to the range of 2550-2660, and trading in the direction of the breakout of this range can be considered. Looking at BOLL, the price continues to oscillate around the upper and lower track ranges, and the volume at the bottom of the MACD is gradually decreasing. In the short term, if it once again tests the top resistance level, short positions can still be considered. On the hourly chart, after the price broke through the EMA144 moving average yesterday and experienced a short-term rise, the price has once again retraced below the moving average. Therefore, in the short term, the bullish trend on the hourly chart may not continue, and the future market may continue to oscillate or continue to decline. Overall, it is suggested to focus on short-term trading as long as the 4-hour range is not broken.
Resistance: 2660-2700
Support: 2550-2400
The above are personal opinions and are for reference only.
免责声明:本文章仅代表作者个人观点,不代表本平台的立场和观点。本文章仅供信息分享,不构成对任何人的任何投资建议。用户与作者之间的任何争议,与本平台无关。如网页中刊载的文章或图片涉及侵权,请提供相关的权利证明和身份证明发送邮件到support@aicoin.com,本平台相关工作人员将会进行核查。


