BTC
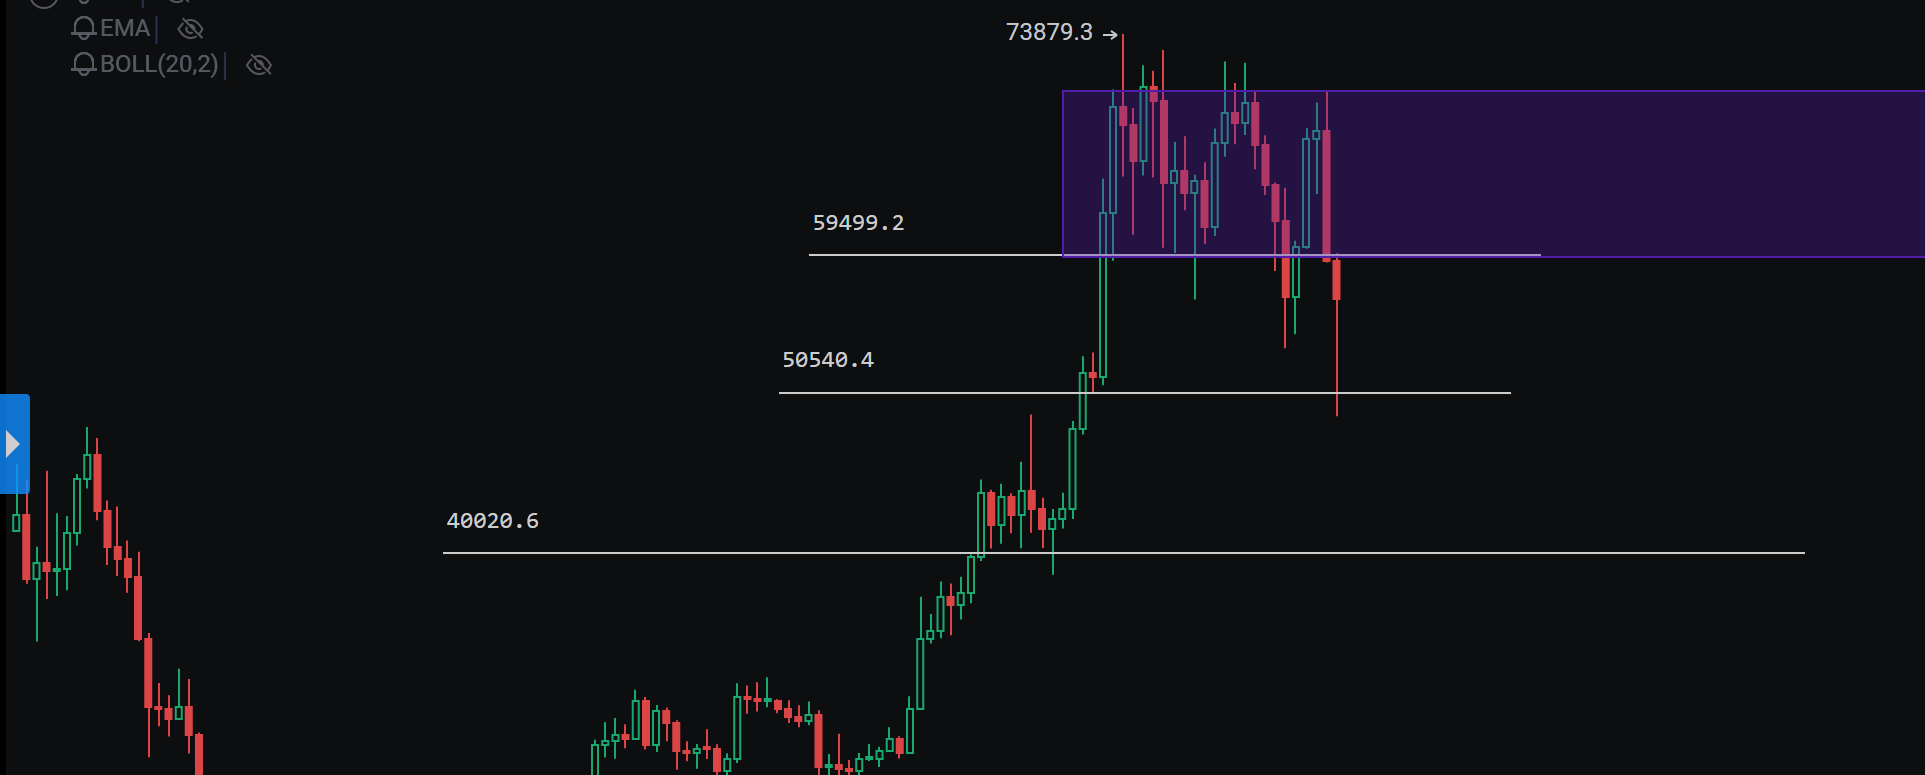
Recently, the price of Bitcoin experienced a temporary rebound after a global financial linkage caused it to plummet to around 48800. Currently, on the weekly chart, the price has fallen below the bottom of the weekly range at 59500 and continues to probe lower without showing a reversal signal. After breaking the support near 50500, the price rebounded and reclaimed the level above 50500. If the weekly price cannot sustain a substantial volume and effectively break below 50500, the market may continue to test the bottom and reverse. If it falls below, the price may retest around 40000, with limited downside potential. For those looking to enter the spot market, it is advisable to wait for a second confirmation of the bottom around 50000-51000 before establishing a position, and consider adding to the position if the price continues to probe near 40000.
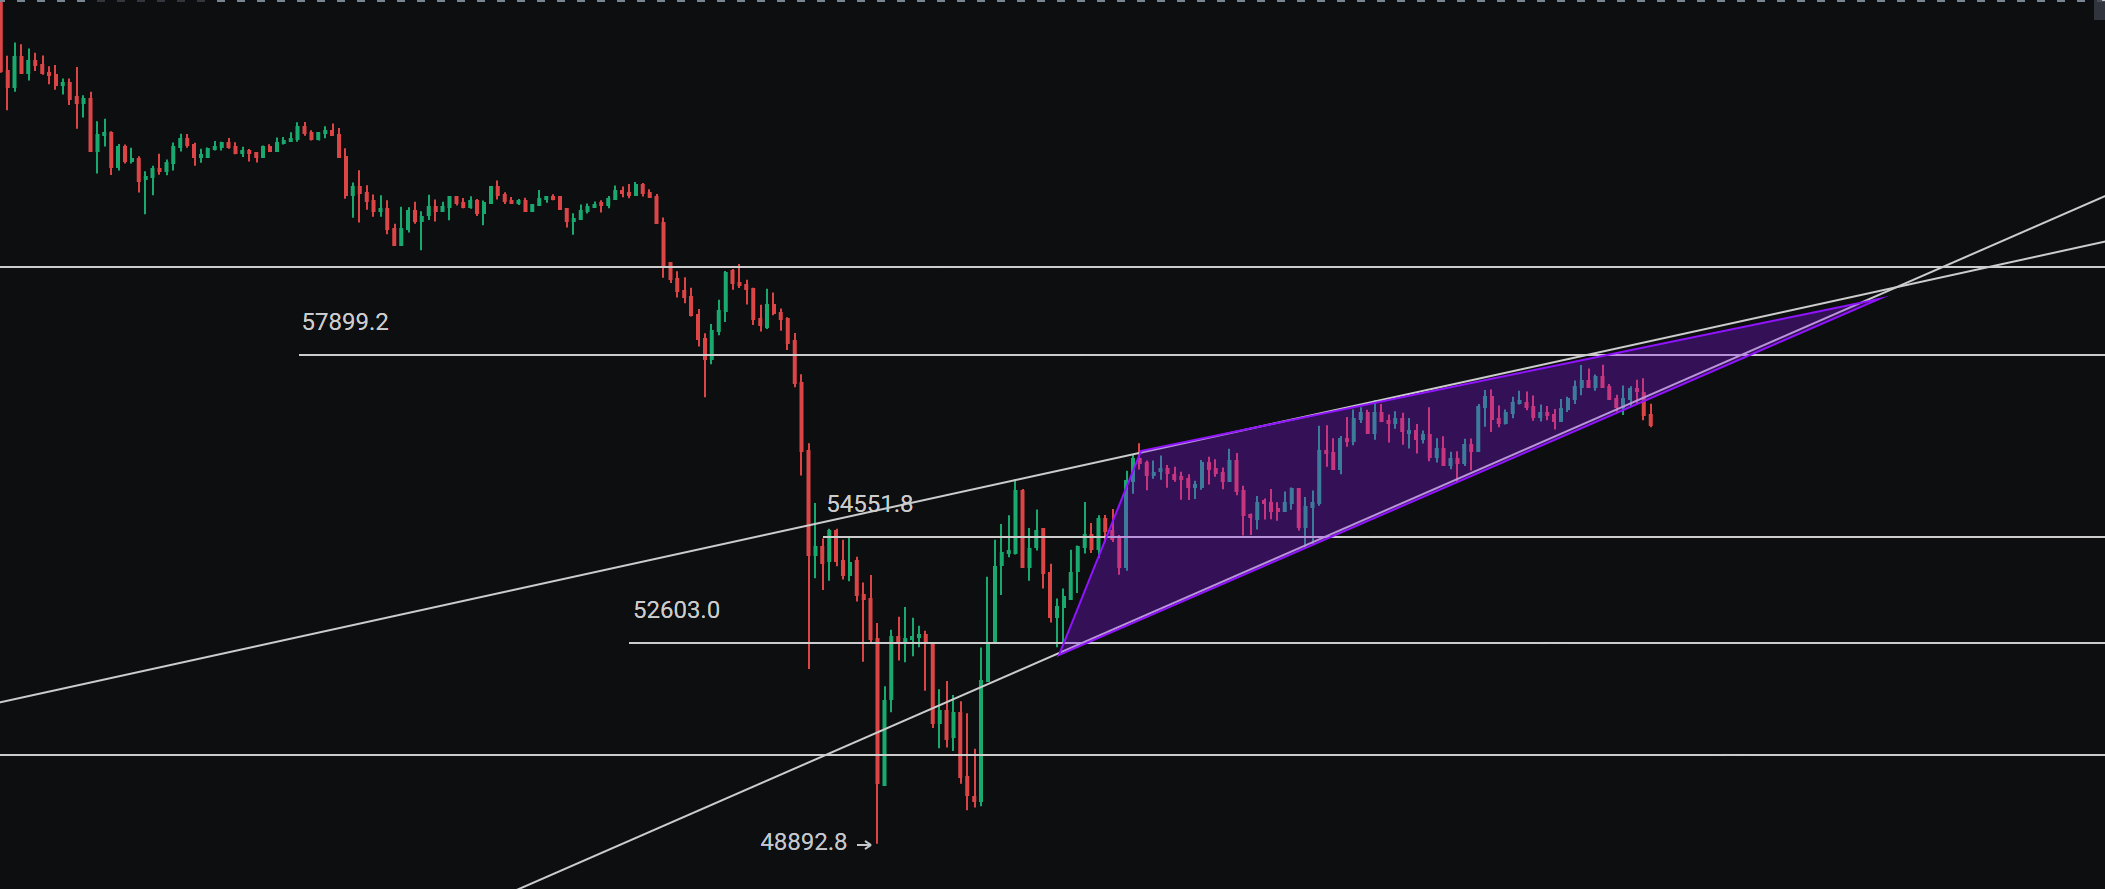
In terms of futures, after a rebound to around 57700 without sustained volume breaking above the 4-hour EMA30 moving average, the price continued to probe lower under pressure. Although the bottom MACD formed a golden cross, it is still below the zero axis, and the current bullish volume is starting to shrink, while the KDJ is turning downwards again. As shown in the 30-minute chart, the price has effectively broken the upward trend line and lacks strength in the rebound. In summary, the price is likely to make a second attempt at bottom support. Short-term operations can focus on key support levels at the bottom and top. If the price tests the weekly support near 50500 without breaking, it may be suitable for medium to long-term positioning.
Support levels: 55500-54500-52500
Resistance levels: 57000-57800
ETH
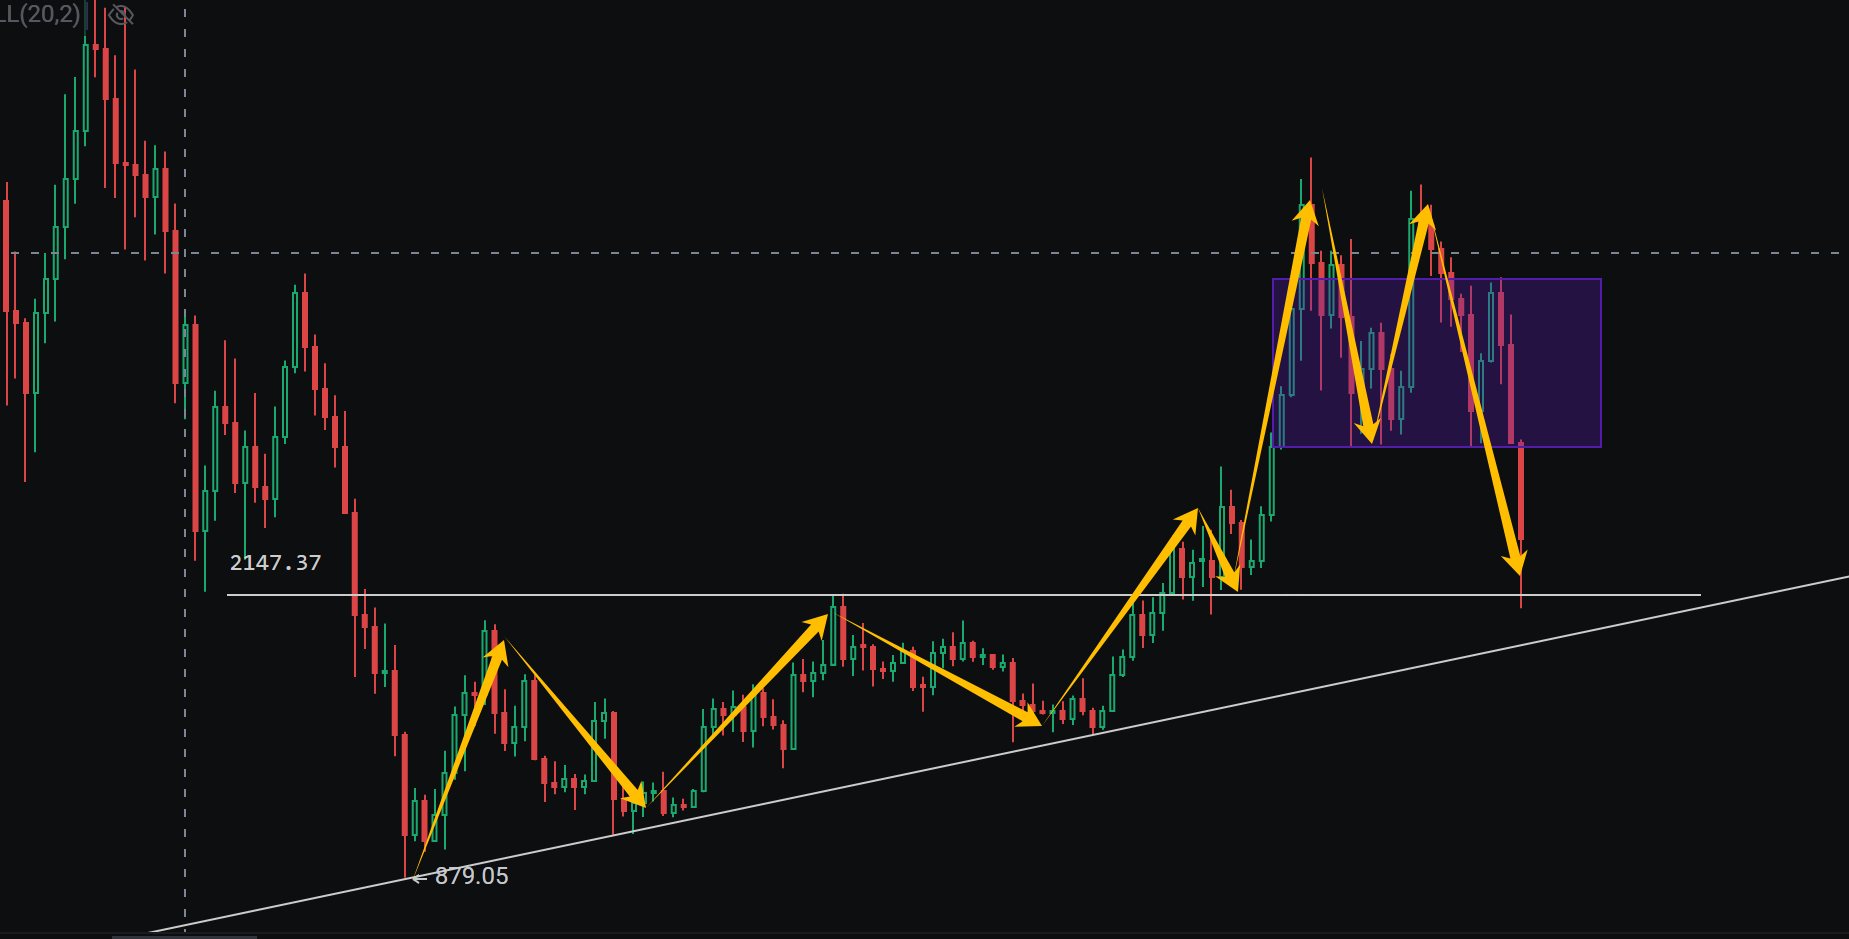
During this bull market, Ethereum has been relatively weak and has not yet surpassed its historical high. Currently, on the weekly chart, the price has formed strong support around 2800 and continued to probe lower after breaking the lowest point of the weekly range, reaching around 2080 before rebounding. Overall, the price is still above the strong support at 2150 on the weekly chart and has not broken the upward trend line on the weekly level. If it continues to break below 2150 or the previous low, the market may retest around 1900, near the weekly level upward trend line. Currently, strong support is forming around 2150, and the price has quickly reclaimed the level after breaking, with a confirmation of support on the short-term cycle, indicating effective bottom support. The secondary indicators show that the bearish volume has continued to probe lower with sustained volume, forming a contraction. If the price cannot sustain a break below 2150 after the weekly change, it will lead to a contraction of bearish volume on the weekly MACD and a rebound in price. In summary, it is advisable to gradually enter the spot market with a layout between 1900 and 2150.
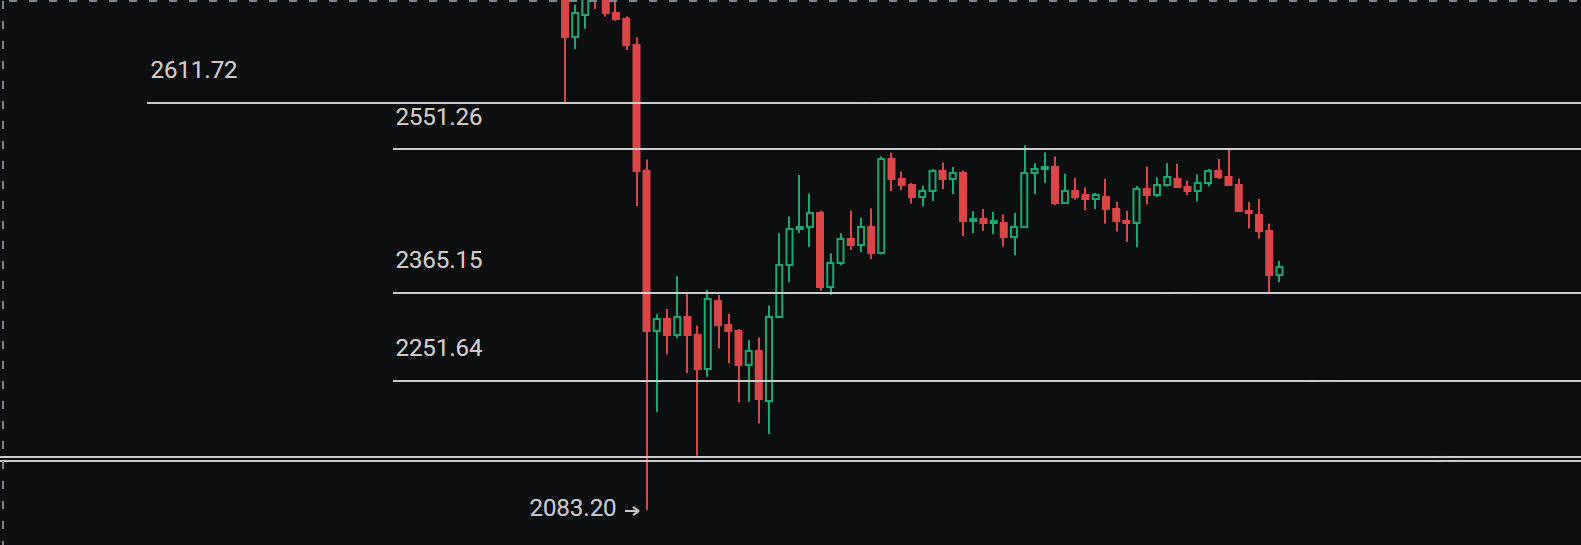
In terms of futures, after a short-term rebound, the price today formed multiple unsuccessful attempts to break above 2550 and faced pressure leading to a pullback. The group also explicitly provided a short entry position near 2530 today. Overall, the bottom on the daily chart has not yet provided a clear reversal signal, and the bottom MACD continues to show bearish volume. On the 4-hour chart, today's rebound also did not strongly break above the BOLL midline, and continued to face pressure for another pullback. Currently, based on the 4-hour naked K chart, the price is oscillating around the range of 2350-2550. In terms of operation, it is recommended to focus on short-term trading in the near future and not blindly take a bearish view, as the downside potential is limited.
Support levels: 2350-2250-2150
Resistance levels: 2450-2550
No brakes, no driving; no stop-loss, no trading
Disclaimer: The above are personal opinions for reference only! Investment carries risks, and market entry should be cautious. If you enter the market based on this information, you are responsible for your own gains and losses!
免责声明:本文章仅代表作者个人观点,不代表本平台的立场和观点。本文章仅供信息分享,不构成对任何人的任何投资建议。用户与作者之间的任何争议,与本平台无关。如网页中刊载的文章或图片涉及侵权,请提供相关的权利证明和身份证明发送邮件到support@aicoin.com,本平台相关工作人员将会进行核查。


