The market situation of BTC is indeed eye-catching. The big bullish candlestick from yesterday suddenly ignited the market atmosphere, instantly allowing me to recover from the loss I suffered from ETH last time. Standing on the sidelines and observing the market, everything becomes so clear! Let's first take a look at the current trend of BTC from the weekly chart.
Looking at BTC's trend this year from the weekly chart:
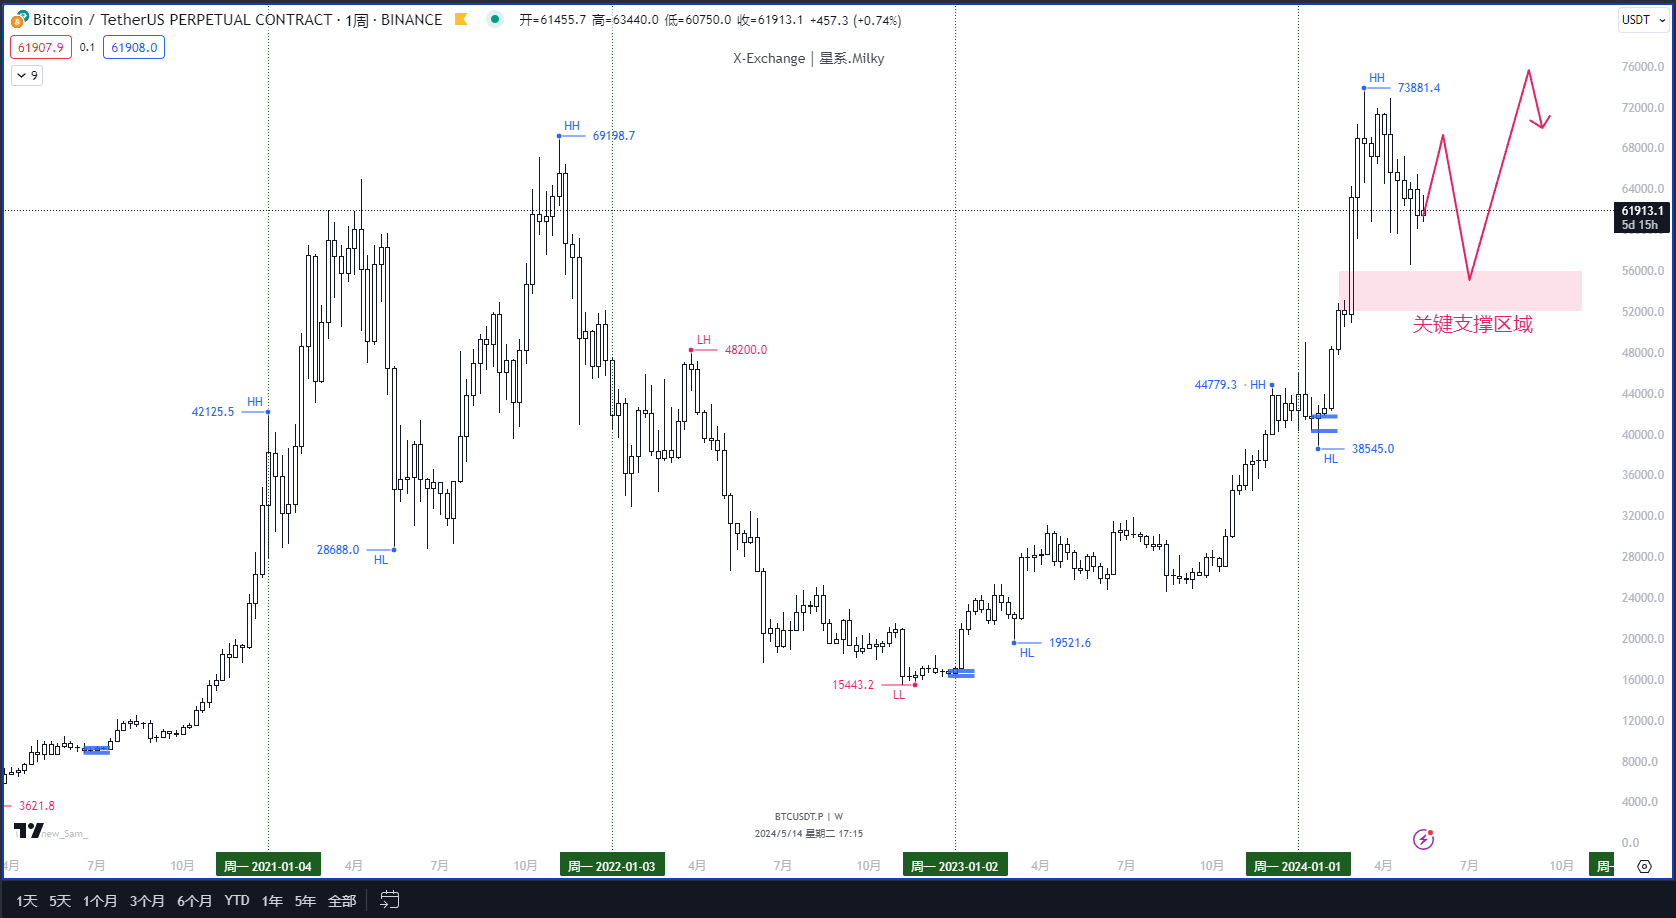
Since February 2024, seven consecutive weeks of uptrend have propelled BTC from a low of 38.5K to 73.8K, a nearly 100% increase. This can be described as the most exciting performance in the cryptocurrency industry! Half of 2024 has passed, and a seven-week consolidation has begun from the high point, accompanied by the hype of halving, making people inevitably ponder about the trend in the second half of the year. I believe the market will consolidate between 39K and 73K, especially on the upcoming May 19th. This day holds special significance in the cryptocurrency industry, and the market may once again create a downturn similar to 519, with panic emotions potentially triggering selling and stampedes, leading to intense volatility.
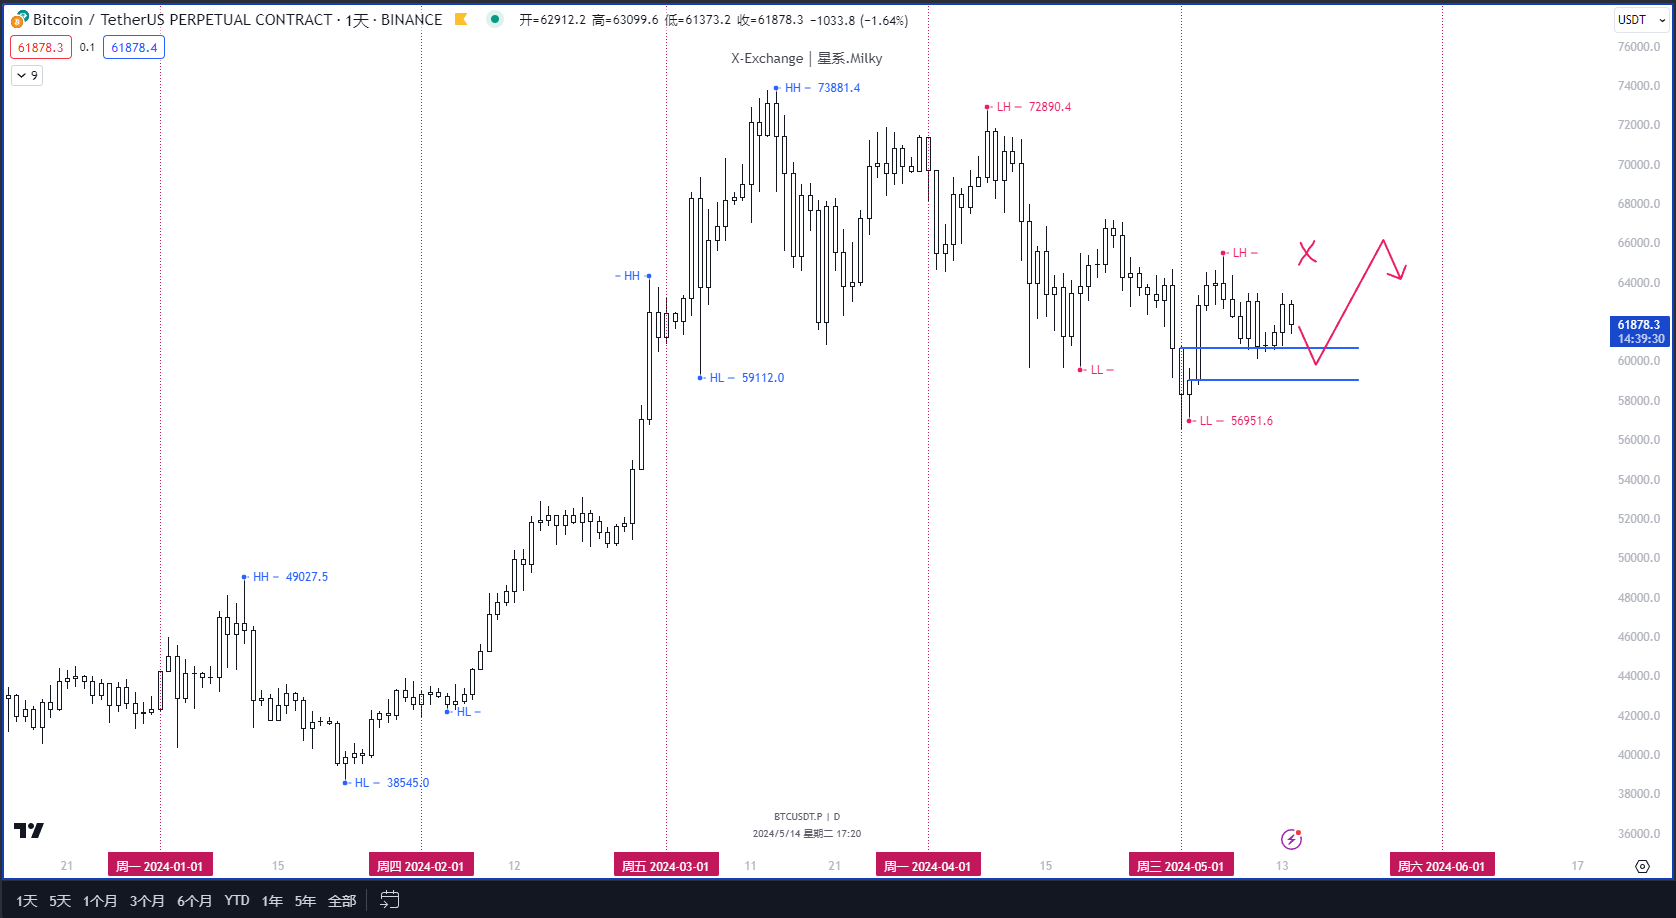
Next, let's take a look at the daily K-line chart, especially the high and low points in April and May, showing a downward trend. I am waiting for the market to effectively break through the high point of 65.5K. Once it retraces, I will consider continuing to go long. As for whether 56.9K is a protected range low, I will observe patiently.
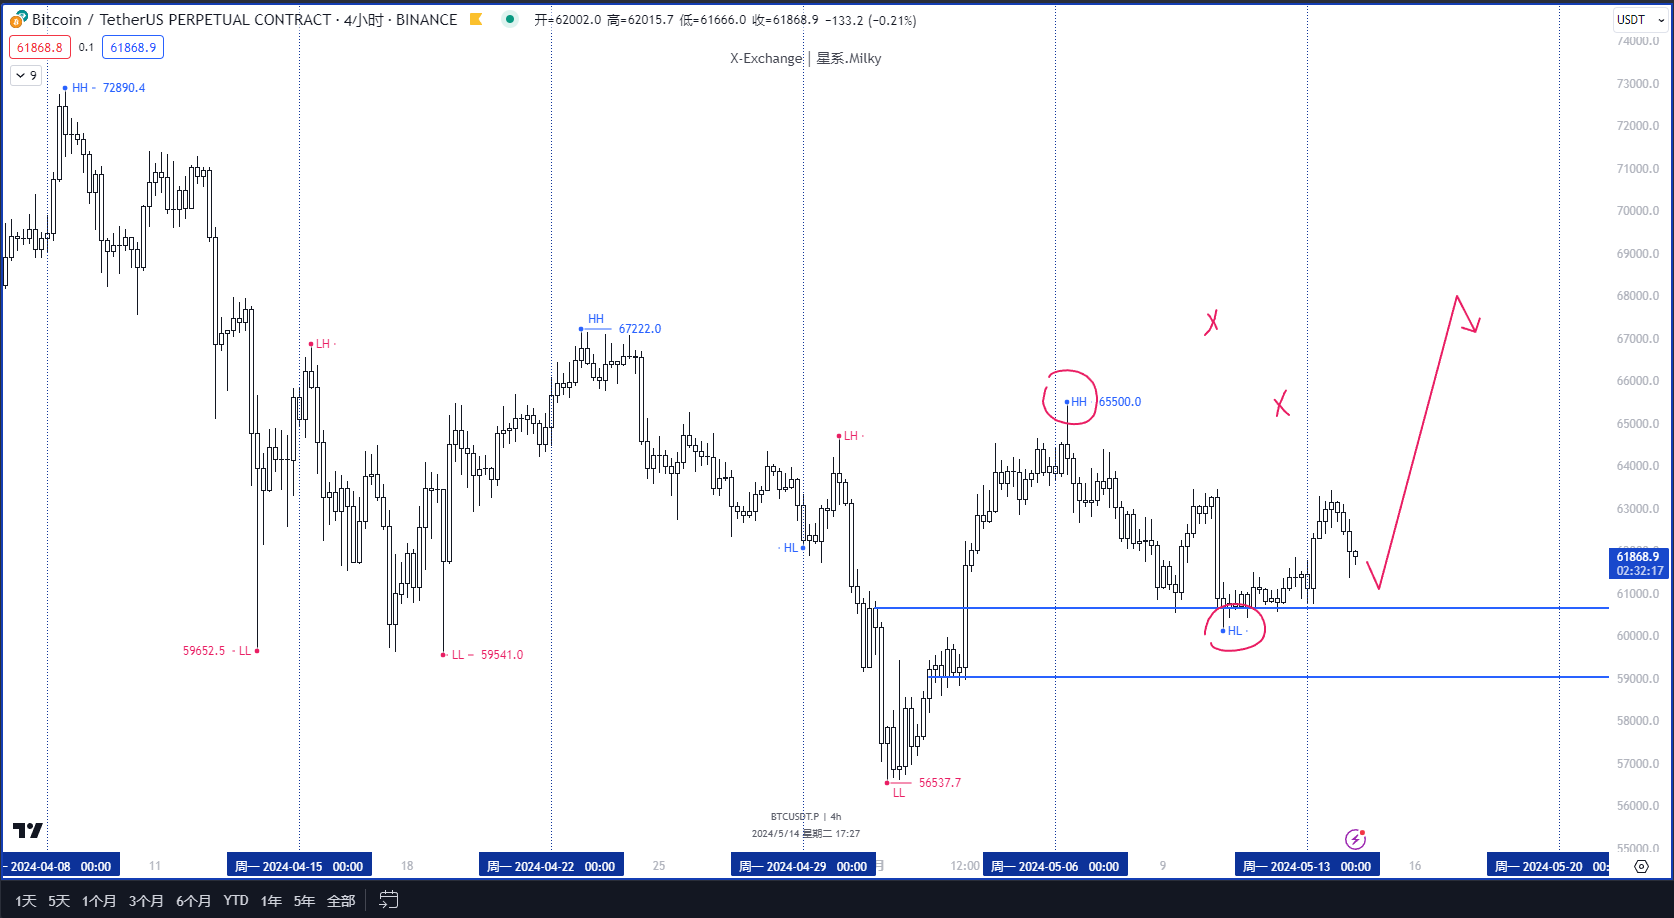
Finally, let's take a look at the 4-hour K-line chart. The high point from last week has risen, the low point has also increased, and it has successfully held above 61K, which makes me optimistic about continuing to set new highs.
Keep a keen observation of the market and conduct rational analysis, while remembering to strictly implement risk management strategies in trading.
Documenting my daily trading routine, sharing the most immediate thoughts and trading details, updated every trading day.
免责声明:本文章仅代表作者个人观点,不代表本平台的立场和观点。本文章仅供信息分享,不构成对任何人的任何投资建议。用户与作者之间的任何争议,与本平台无关。如网页中刊载的文章或图片涉及侵权,请提供相关的权利证明和身份证明发送邮件到support@aicoin.com,本平台相关工作人员将会进行核查。