Bitcoin Technical Analysis: BTC Faces Growing Uncertainty Amidst Market Fluctuations

11天前
标签:比特币0292
文章来源: bitcoin.com

The technical analysis from the 1-hour and 4-hour BTC/USD charts on May 8 paints a predominantly bearish picture. The 1-hour chart underlines a strong downward trend, starting near $64,389 and dropping sharply to about $62,054.

Bitcoin Technical Analysis: BTC Faces Growing Uncertainty Amidst Market Fluctuations

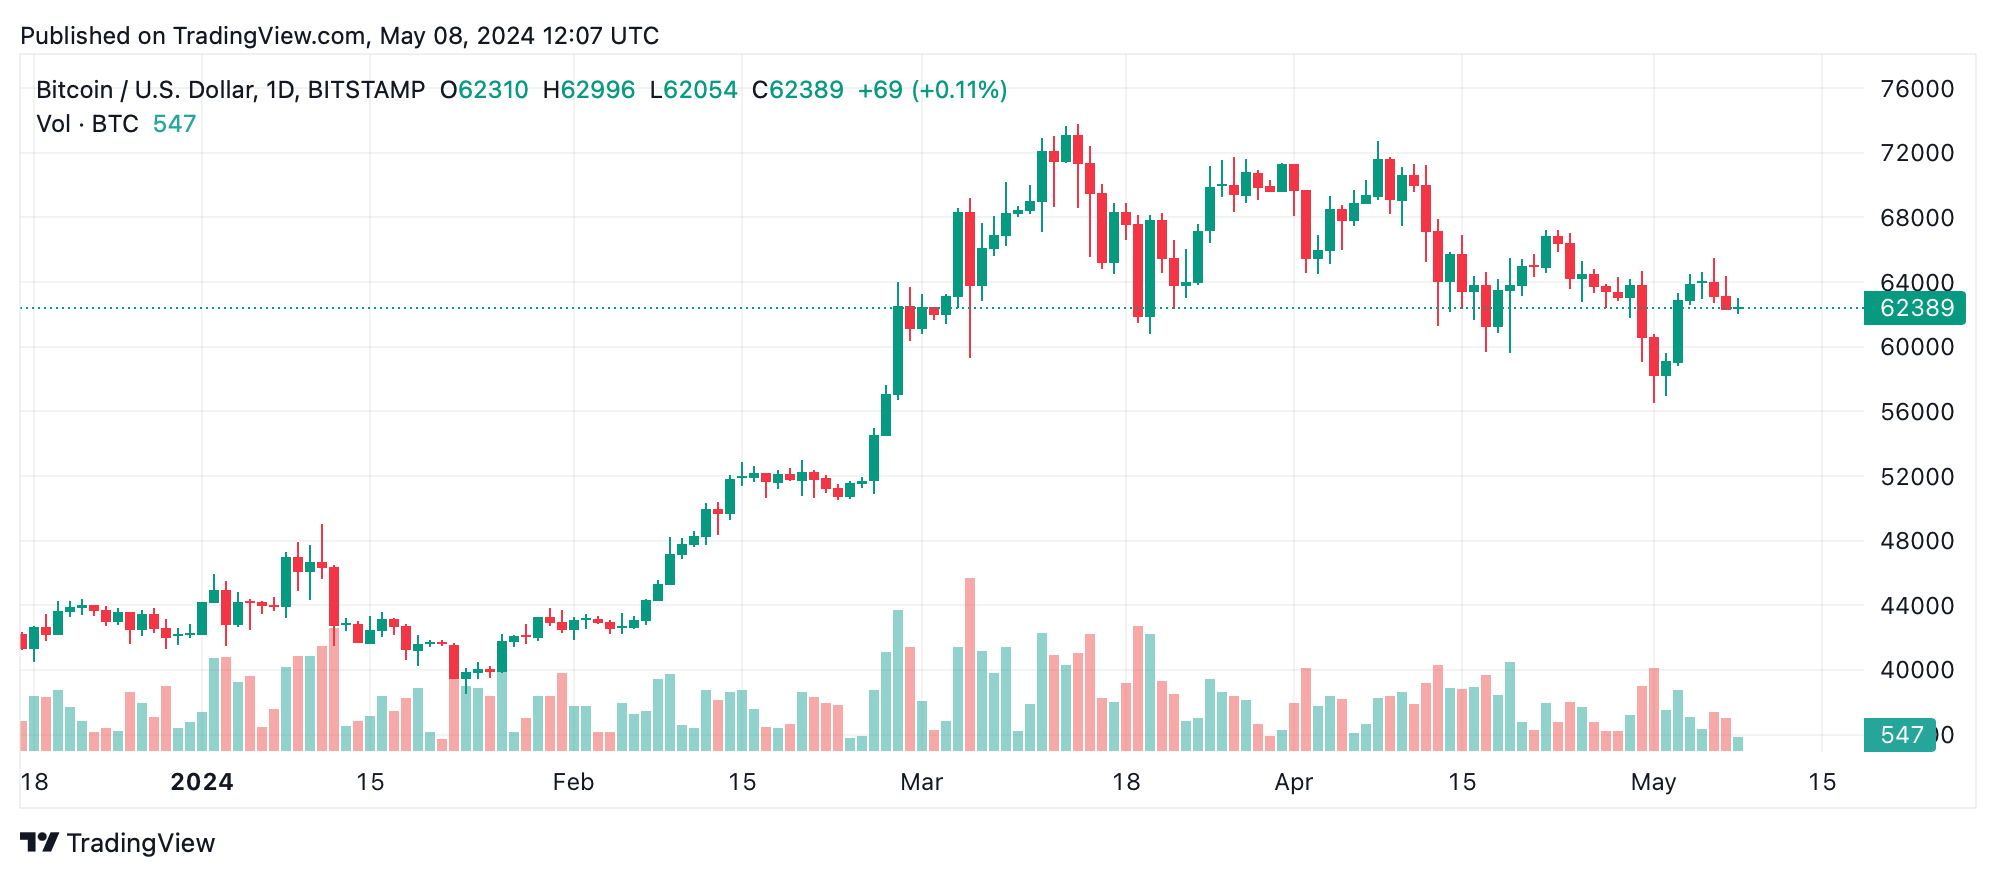
BTC/USD daily chart.

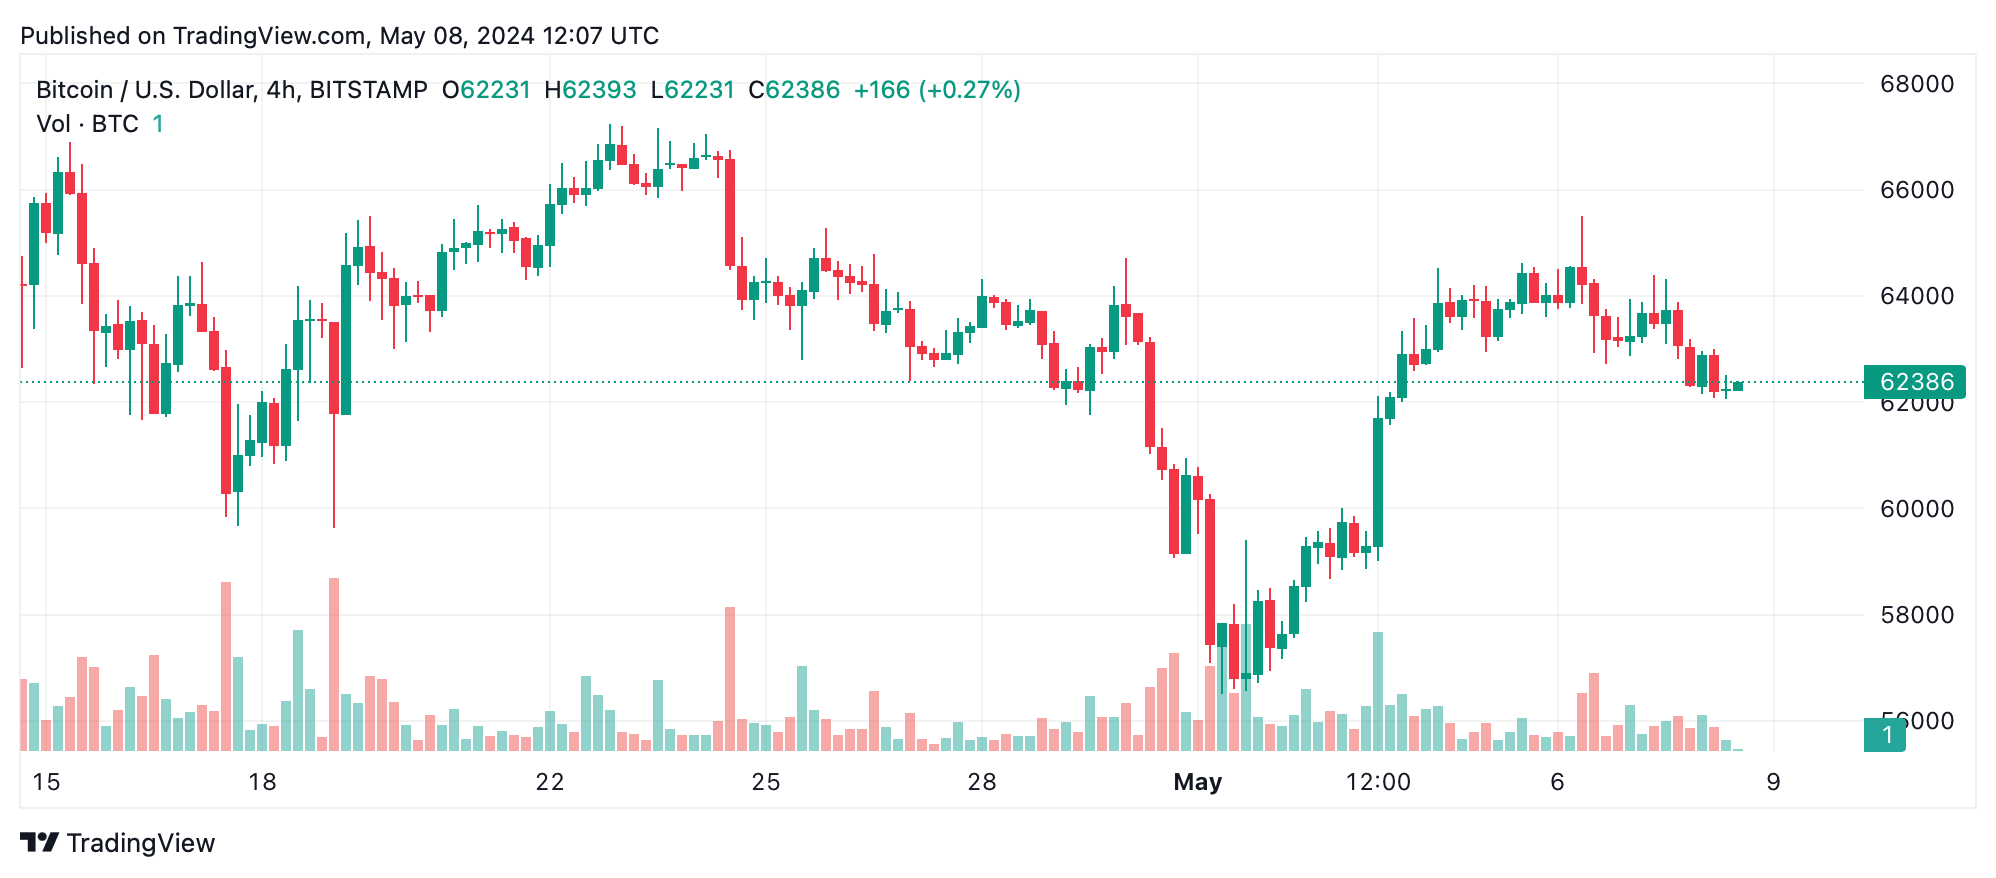
This strong negative momentum, indicated by a series of drops, suggests a sustained seller’s market at these levels. Transitioning to the 4-hour chart, we see similar sentiment with price variations, peaking at $65,513 before descending, signaling a short-term exit point for traders holding long positions.

Bitcoin Technical Analysis: BTC Faces Growing Uncertainty Amidst Market Fluctuations

BTC/USD 4-hour chart.

Wednesday’s charts further show mixed signals emerging from bitcoin’s oscillators—such as the relative strength index (RSI) and moving average convergence divergence (MACD) levels—which lean towards neutral to bullish signals, hinting at some buying momentum.

However, the moving averages from 10-day to 200-day periods show a significant tilt toward bearish sentiment, especially in shorter spans like the 30-day and 50-day averages. This divergence calls for a strategic analysis of entry and exit points, particularly for short-term trading.

A look at the daily chart offers a broader context, revealing a bearish sentiment with bitcoin’s price reaching a high of $72,756 on April 7, before a consistent downturn over the last four weeks. The presence of this long consolidation period points to strong selling pressure, reinforcing exit signals for long positions and potential entries for shorts below the $66,000 threshold, where recent attempts to rise above have so far failed.

Bull Verdict:

Despite the overarching bearish signals, key indicators on the oscillators such as MACD Levels and RSI hint at underlying strength. If bitcoin maintains support above the 200-day moving average and increased buying volumes, it could potentially pivot toward a bullish breakout. Traders should watch for reversal patterns and increased market participation to confirm the onset of a bullish phase.

Bear Verdict:

The predominance of bearish signals across most short to mid-term moving averages, combined with the negative patterns observed in the daily and hourly charts, underscores a strong bearish outlook. The failure to break past critical resistance levels suggests BTC could continue its downward trajectory.

Register your email here to get weekly price analysis updates sent to your inbox:

免责声明:本文章仅代表作者个人观点,不代表本平台的立场和观点。本文章仅供信息分享,不构成对任何人的任何投资建议。用户与作者之间的任何争议,与本平台无关。如网页中刊载的文章或图片涉及侵权,请提供相关的权利证明和身份证明发送邮件到support@aicoin.com,本平台相关工作人员将会进行核查。

评论

暂时没有评论,赶紧抢沙发吧!