Ethereum Technical Analysis: ETH Bulls Maintain Drive Amid Fluctuations and Uncertainty

12 天前
標籤:比特币0339
文章來源: bitcoin.com

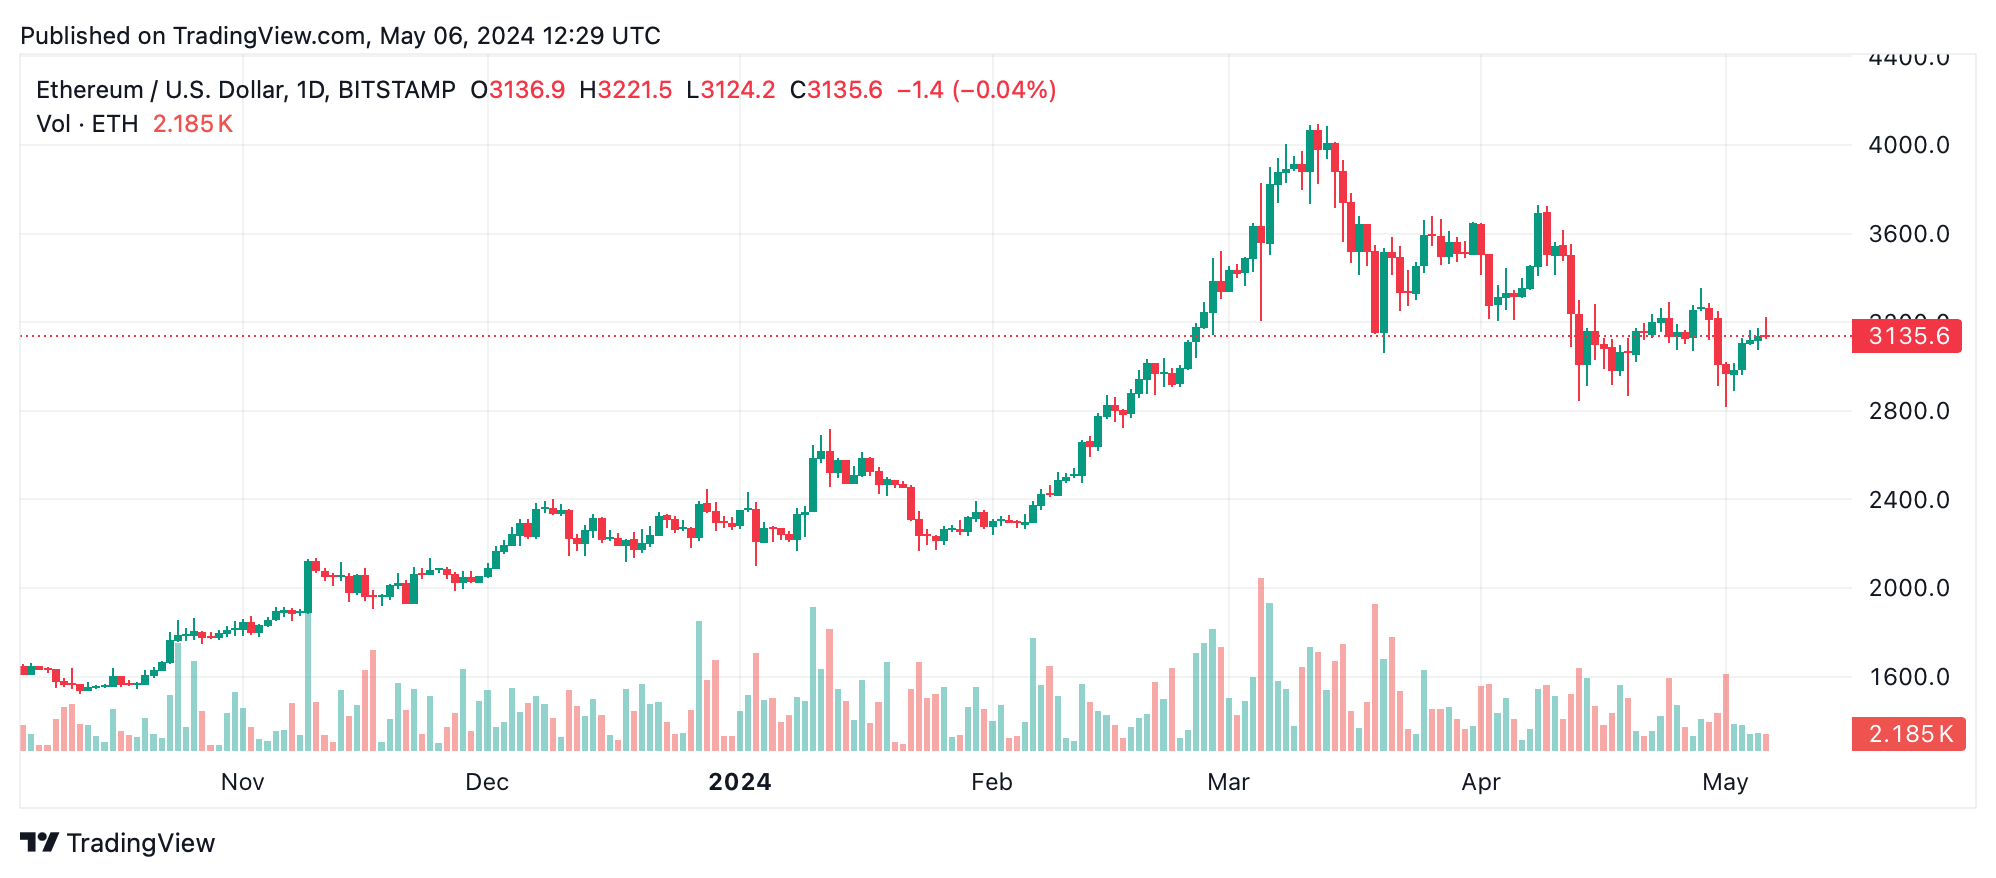
Ethereum’s current price is around $3,135 per unit, with an intraday range between $3,116 and $3,221, signals a temporary equilibrium between buyers and sellers. ETH’s market capitalization stands at $378 billion, supported by the day’s trade volume of $10.27 billion. The daily chart reveals a recent downturn, with ether’s price dropping from a high near $3,730 on April 8, to around $2,801 by April 12.

Ethereum Technical Analysis: ETH Bulls Maintain Drive Amid Fluctuations and Uncertainty

ETH/USD daily chart.

Following this decline, the market entered a consolidation phase around the $3,000 mark. A series of bullish signals hints at an emerging recovery, suggesting potential entry points if the price sustains above the $3,000 threshold. Resistance near $3,300 could cap upward movements, providing strategic exit points for traders.

Ethereum Technical Analysis: ETH Bulls Maintain Drive Amid Fluctuations and Uncertainty

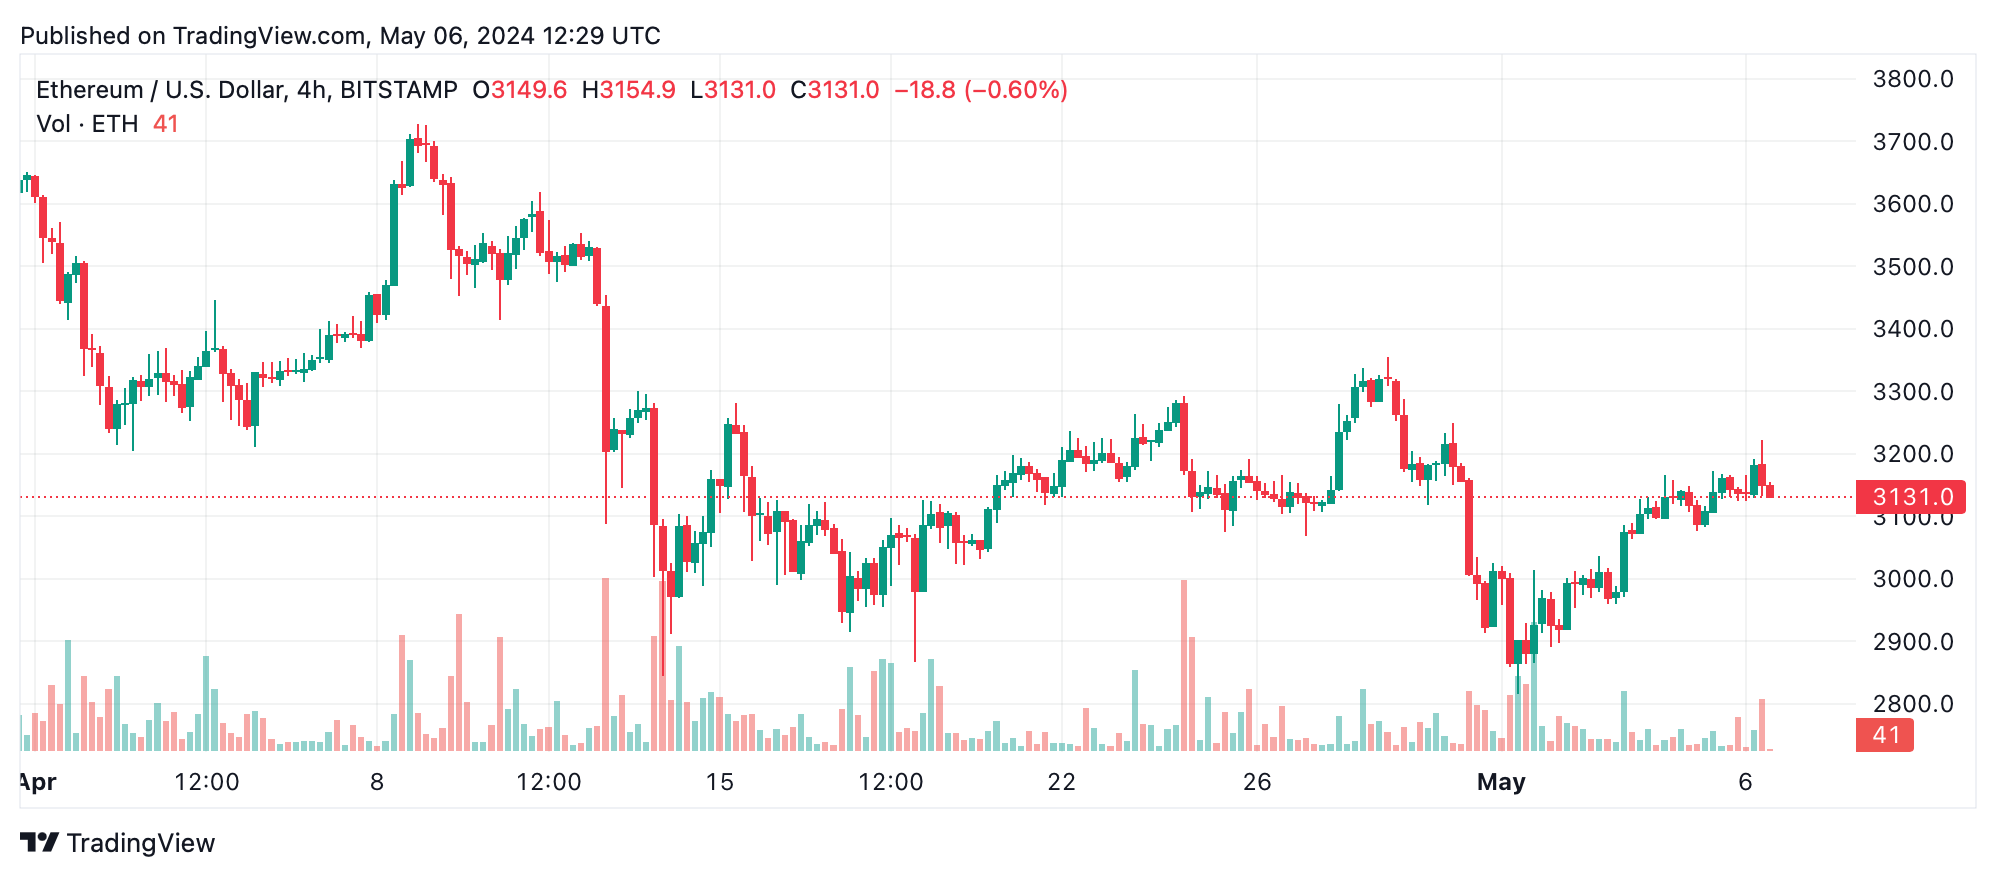
ETH/USD 4-hour chart.

The four-hour time frame offers a closer look at ethereum’s volatility and upward trend post-recent lows at $2,813.4. The significant upswing pushing the price to $3,223 indicates strong buying interest. Traders should watch for retracements to $3,100 or $3,150 for potential entries. The peak at $3,223 could serve as near-term resistance, guiding profit-taking strategies.

Short-term chart analysis (1-hour) shows rapid price changes, with a notable spike to $3,223 followed by a sharp pullback. This indicates strong selling pressure at resistance levels. Entry might be favorable if the price stabilizes at higher lows, such as around $3,140, suggesting a robust short-term bullish outlook. The $3,223 resistance is pivotal, and failure to breach it should prompt traders to secure gains.

The oscillator readings mostly suggest neutrality, with a few leaning towards buy signals, such as the momentum oscillator and moving average convergence divergence (MACD) levels. However, the moving averages (MAs) present a mixed view; shorter-term averages like the 10 and 20-day exponential moving average (EMA) and simple moving average (SMA) suggest bullish sentiment, whereas the longer-term 50 and 100-day averages suggest caution with bearish signals.

Bull Verdict:

The current analysis of ethereum suggests a cautiously optimistic outlook. The presence of bullish candlestick patterns in the daily and four-hour charts, coupled with supportive buy signals from several short-term MAs and oscillators like momentum and MACD, indicate underlying buying interest. If ether sustains its support levels, particularly around $3,000, and successfully challenges the resistance at $3,223, it could set the stage for a further upward trajectory.

Bear Verdict:

Conversely, there are significant bearish risks in the ethereum market. The longer-term moving averages on the daily chart, such as the 50 and 100-day averages, show sell signals, suggesting an overarching bearish trend. The recurrent failure to break through key resistance levels, especially around $3,223, coupled with strong selling pressure indicated by the sharp pullbacks on the one-hour chart, could foreshadow a downturn.

Register your email here to get weekly price analysis updates sent to your inbox:

免责声明:本文章仅代表作者个人观点,不代表本平台的立场和观点。本文章仅供信息分享,不构成对任何人的任何投资建议。用户与作者之间的任何争议,与本平台无关。如网页中刊载的文章或图片涉及侵权,请提供相关的权利证明和身份证明发送邮件到support@aicoin.com,本平台相关工作人员将会进行核查。

评论

暫時沒有評論,趕緊搶沙發吧!