Bitcoin Technical Analysis: Persistent Bearish Trends Hinder BTC’s Recovery

16天前
标签:比特币0355
文章来源: bitcoin.com

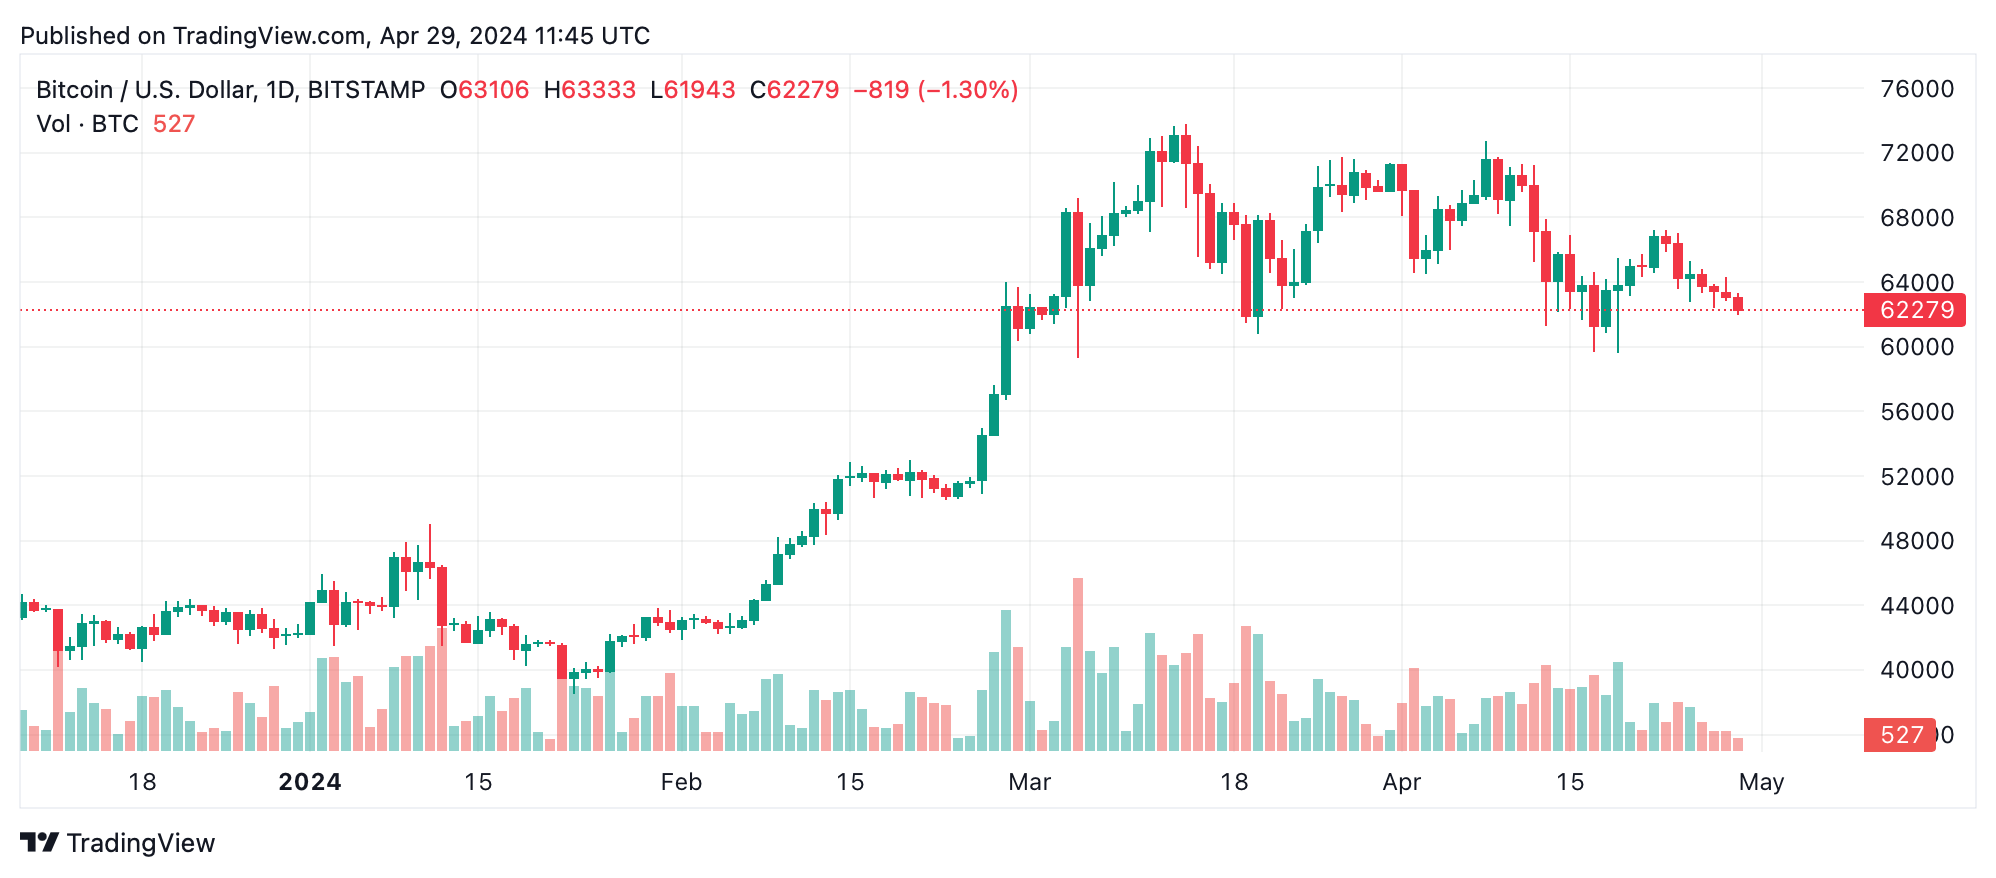
Bitcoin’s (BTC) daily chart presents a stark bearish trend with a series of lower highs and lower lows, suggesting that sellers maintain a strong grip on the market. The presence of bearish downturns hints at a potential slowdown in momentum. However, the declining volume accompanying the price drop leaves room for ambiguity regarding a near-term reversal. Crucial for traders will be the support level at approximately $59,629, which, if breached, could precipitate further declines. Conversely, heavy resistance lies at around $72,756, marking critical points for potential entry or exit strategies depending on market confirmation.

Bitcoin Technical Analysis: Persistent Bearish Trends Hinder BTC's Recovery

BTC/USD Daily Chart

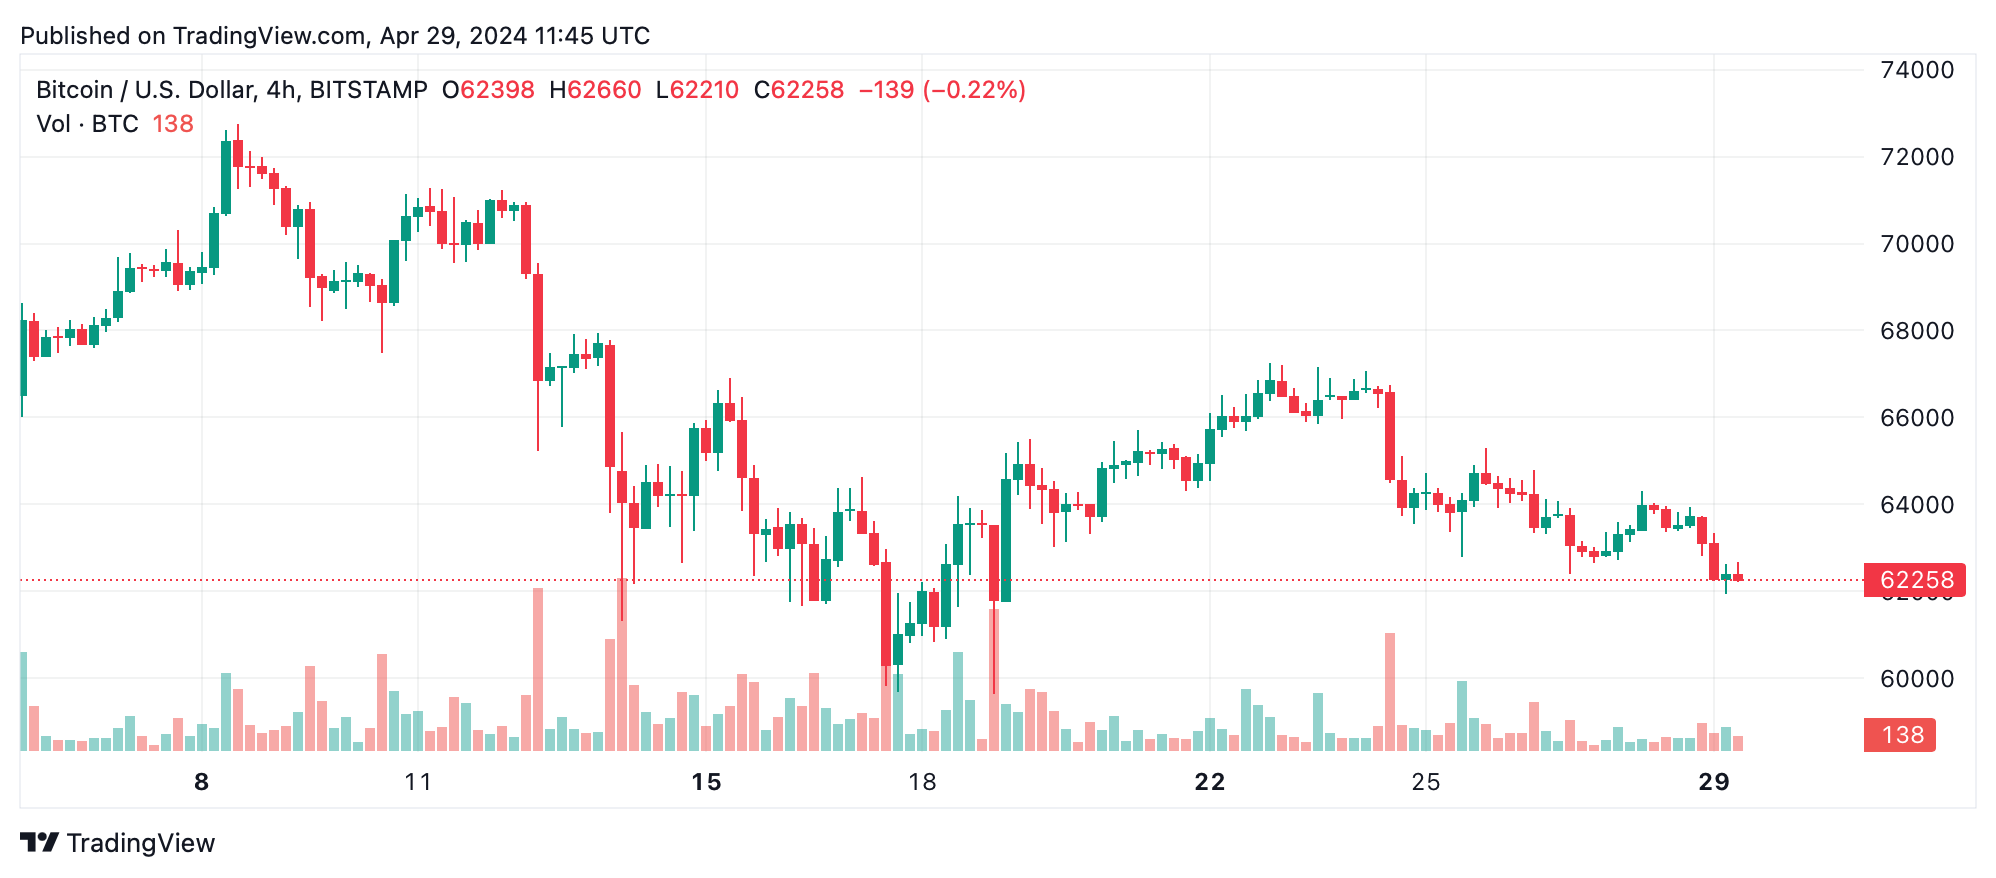
The 4-hour BTC/USD chart corroborates the overarching bearish momentum seen in the daily analysis. Notably absent are strong bullish upswings, indicating a lack of buyer control. Current pricing around the midpoint of the recent range offers little in terms of high-confidence trading opportunities. For bearish strategies, potential entries may arise on pullbacks to former support levels now acting as new resistance, particularly if accompanied by increased selling volume.

Bitcoin Technical Analysis: Persistent Bearish Trends Hinder BTC's Recovery

BTC/USD 4-H Chart

On a shorter time scale, the 1-hour chart via Bitstamp reveals intricate price action and potential intraday trading signals. A consolidation pattern around $61,943 provides a basis for short-term trades. The $63,000 threshold, having been tested repeatedly as both support and resistance, is pivotal for short-term strategy development. A recent spike in trading volume at these levels could herald imminent price direction confirmation, making it a critical area for traders to monitor.

The broader sentiment, as reflected by oscillators and moving averages (MAs), is predominantly bearish with the relative strength index (RSI) at 41, indicating neutrality yet leaning towards bearish conditions. Most MAs signal bearish sentiment, particularly noticeable in shorter durations such as the 10, 20, 30, and 50 periods, all suggesting downward price action. However, longer-term views from the 100 and 200-period averages show bullish signals, providing a contrarian stance amidst prevailing market sentiment.

Bull Verdict:

Despite the current bearish momentum, the bull verdict highlights the long-term support levels shown by the 100 and 200-period exponential and simple moving averages. If bitcoin can sustain above these foundational supports and the broader market sentiment shifts positively, there could be potential for a gradual recovery. Traders might look for signs of increased buying volume and reversal patterns near key support zones as indicators of a possible upward trajectory.

Bear Verdict:

The bear verdict underscores the prevailing downward momentum, supported by the majority of technical indicators across various time frames. With consistent sell signals from both moving averages and oscillators in shorter periods and a lack of strong bullish interventions, BTC is likely to continue its descent. The next key support levels could be tested soon, and if broken, may accelerate the bearish trend, prompting traders to consider short positions or defensive strategies.

Register your email here to get weekly price analysis updates sent to your inbox:

免责声明:本文章仅代表作者个人观点,不代表本平台的立场和观点。本文章仅供信息分享,不构成对任何人的任何投资建议。用户与作者之间的任何争议,与本平台无关。如网页中刊载的文章或图片涉及侵权,请提供相关的权利证明和身份证明发送邮件到support@aicoin.com,本平台相关工作人员将会进行核查。

评论

暂时没有评论,赶紧抢沙发吧!