
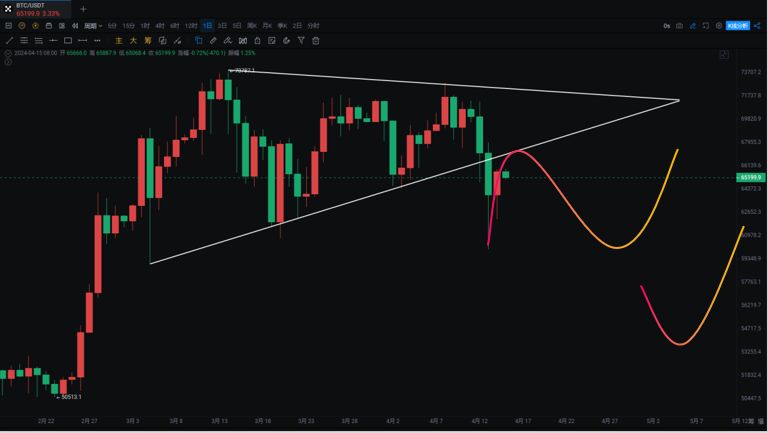
周线已经收线定型,大饼在高位震荡六周这里和49000那一波有些类似,暂时来看这个位置确实有上涨透支的迹象,高位震荡第二周十字星打出高点73777,第三周锤子线,第五周是T型线再到上周的十字星,走出高位震荡箱体,昨天最低触及60660,这个位置不破是有机会走箱体震荡,就看反弹高度。

周线级别回调还未到位时间空间不足,大饼月线7连阳,以往历史上都很少见,本来这一波是从15400上来的反弹浪结果拉成主升浪,如果真正的主升浪到来未来可期。
同样的如果有机会跌到之前提醒的完美看涨蝙蝠形态(53000)或者斐波那契0.382(55000)都需要高度重视或许就是下一轮就是中长线布局的机会,我们等待条件触发。
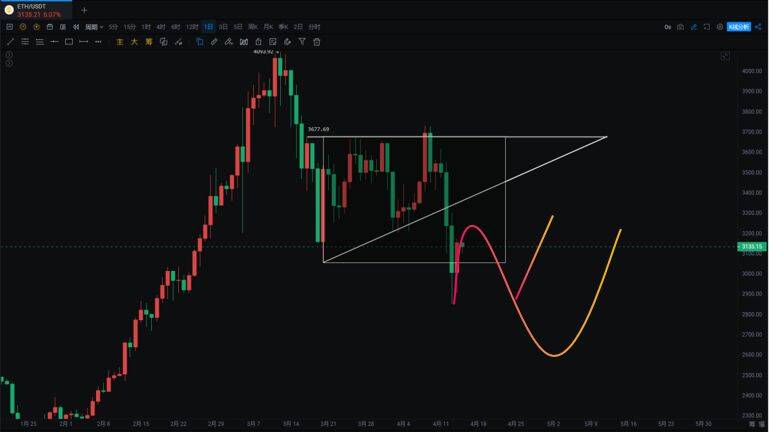
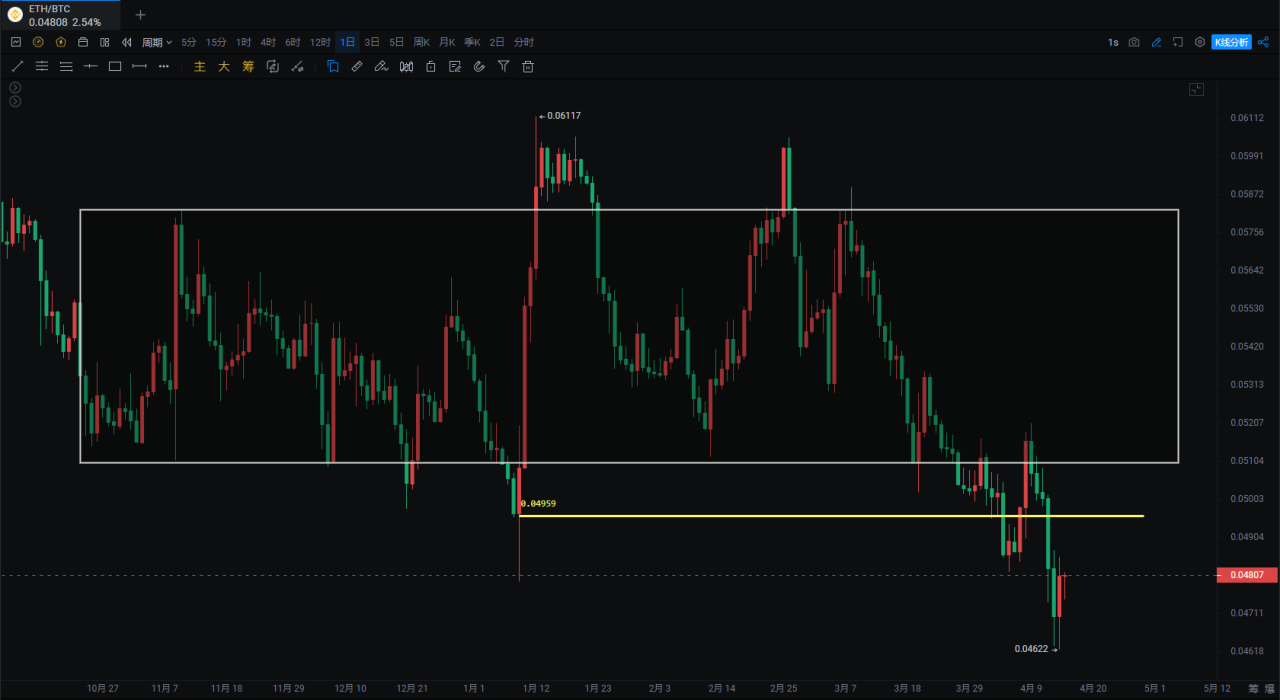
大饼二探毋庸置疑,以太最低跌至2852但暂时反弹收回3056二探也还未破,唯一风险比较大的是ETH/BTC汇率创新低暂时反弹都还未收回0.048—0.049。很多山寨已经打回原型。
大饼
插针60660反弹力度还不错截止发文也反弹了5000多点,目前受MA60支撑反弹看68200下方压力。向下如果继续跌破MA60甚至60660则去MA120的概率增加也就是……
日线MACD快慢线下穿零轴调整时间拉长。OBV指标白线走出三重底反弹,不能继续跌破。4小时继续看反弹上方压力……
支撑:
压力:
以太
前三周的双阴夹阳,上周也如期下跌插针靠近MA20反弹收回3056,日线回踩MA120暂时仍然看反弹压力……不能突破继续看下跌。周线回调并未走完,全面反弹可能要到4月底5月初,继续等待中长线布局机会。
支撑:
压力:
如果你喜欢我的观点,请点赞评论分享,我们一起穿越牛熊!!!
文章具有时效性,仅供参考实时更新
专注k线技术研究,共赢全球投资机会公众号:交易公子扶苏

免责声明:本文章仅代表作者个人观点,不代表本平台的立场和观点。本文章仅供信息分享,不构成对任何人的任何投资建议。用户与作者之间的任何争议,与本平台无关。如网页中刊载的文章或图片涉及侵权,请提供相关的权利证明和身份证明发送邮件到support@aicoin.com,本平台相关工作人员将会进行核查。


