Author: Glassnode
Translator: Felix, PANews (This article has been edited and abridged)
This article evaluates market risks from a data perspective through various on-chain indicators and compiles all indicators into a heatmap to assess the risk integration of various data categories.
Note: The data in this article is up to February 7th, and the "risk" in the risk categories refers to the risk of a significant decline in Bitcoin prices.
Macro Risk Analysis
Analysts can use many models and indicators to assess market risk at any point in the cycle. This article will specifically consider the "risk" of a significant decline in the spot price of Bitcoin.
Therefore, "High Risk?" indicates that the market may be entering a speculative bubble. In contrast, "Low Risk?" indicates that most speculative activity has disappeared, and the market is more likely to be in a bottoming formation phase.
Price Bubble
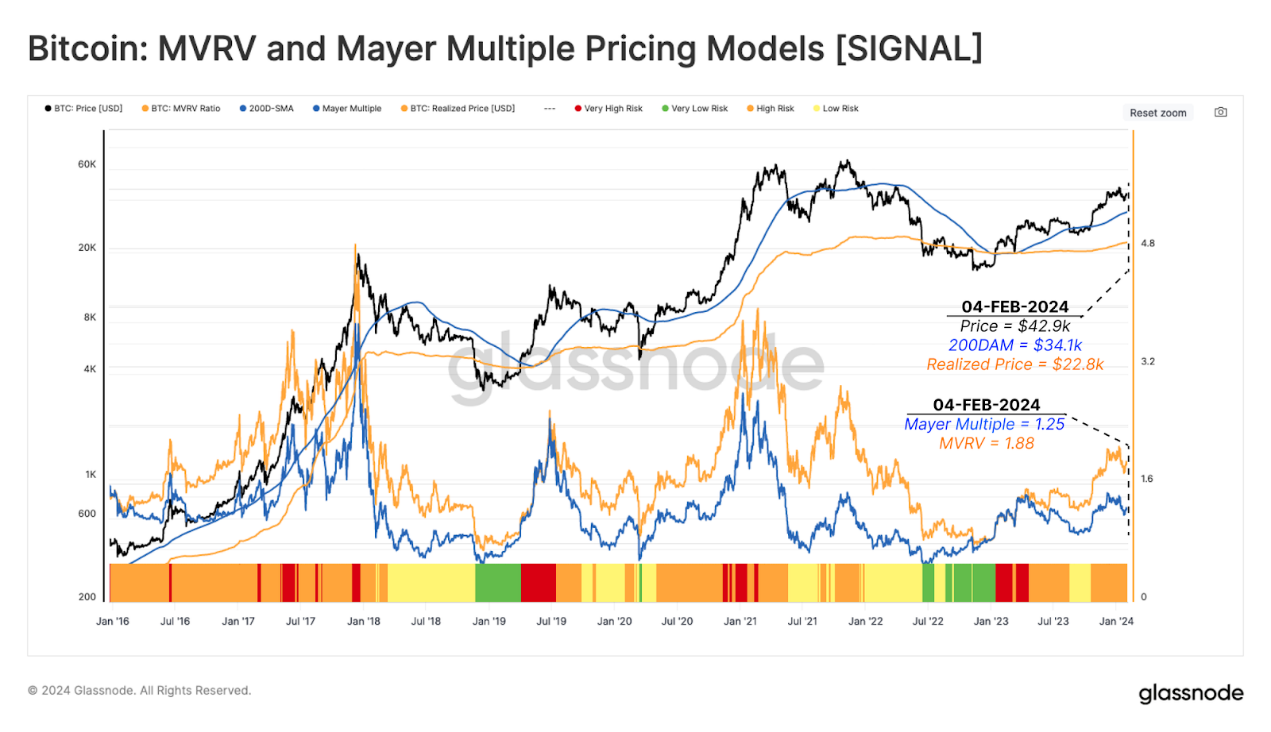
This module monitors the price deviation of two long-term mean reversion baseline indicators:
- MVRV Indicator: Measures the ratio of market price to realized price.
- Mayer Multiple: Determines the overbought and oversold conditions of Bitcoin. It assesses the degree to which the price deviates from the long-term average by calculating the ratio between the Bitcoin price and the 200-day moving average.
In the figure below, the following risk categories are defined by combining the MVRV and Mayer Multiple (MM) models.
- Extreme High Risk: MVRV > 1 and MM > 1, where the Mayer Multiple exceeds two standard deviations (MM > +2 STD) above its cumulative average.
- High Risk: MVRV > 1 and MM > 1, where the Mayer Multiple is below two standard deviations below its cumulative average (1.0 MM +2 STD).
- Low Risk: MVRV > 1, but MM < 1.
- Extremely Low Risk: MVRV < 1 and MM < 1.
When the Bitcoin price is $42,900, the realized price and the 200-day moving average price are $22,800 and $34,100, respectively. The market is currently in a high-risk environment.
Measuring Supply Profitability
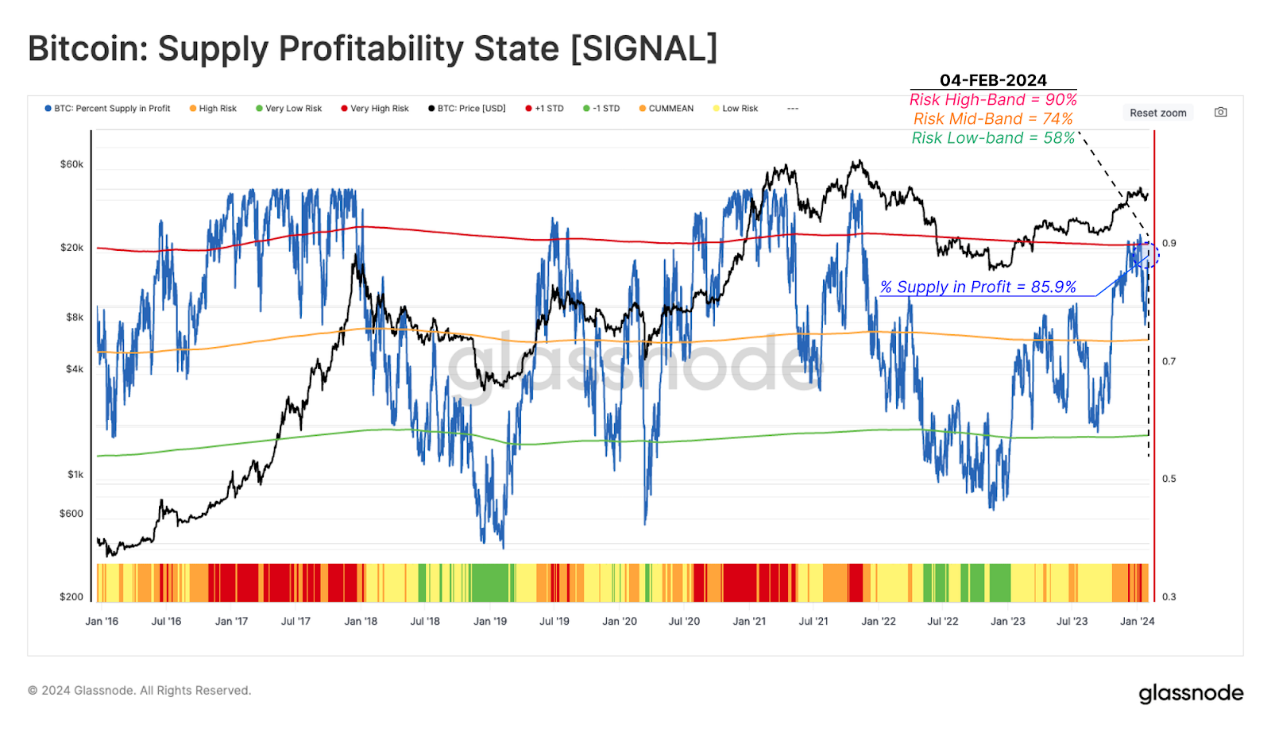
The Percent of Supply in Profit (PSIP) indicator measures the proportion of circulating Bitcoin that is profitable. As the motivation for investors to realize profits increases, this indicator helps identify potential risks of increased selling pressure.
- Extreme High Risk: PSIP exceeds the historical average by more than one standard deviation (PSIP > 90%).
- High Risk: PSIP exceeds the historical average by less than one standard deviation (75% < PSIP < 90%).
- Low Risk: PSIP is below the historical average but above the statistical lower limit (58% < PSIP < 75%).
- Extremely Low Risk: PSIP is below the historical average by more than one standard deviation (PSIP < 58%).
When this indicator is above the upper limit, historically, it is consistent with the "prosperity stage" of the market entering a bull market. During the market rebound around the launch of the spot ETF, this indicator implied that the market was at an extremely high risk, followed by a price contraction to $38,000.
Measuring Fear and Greed
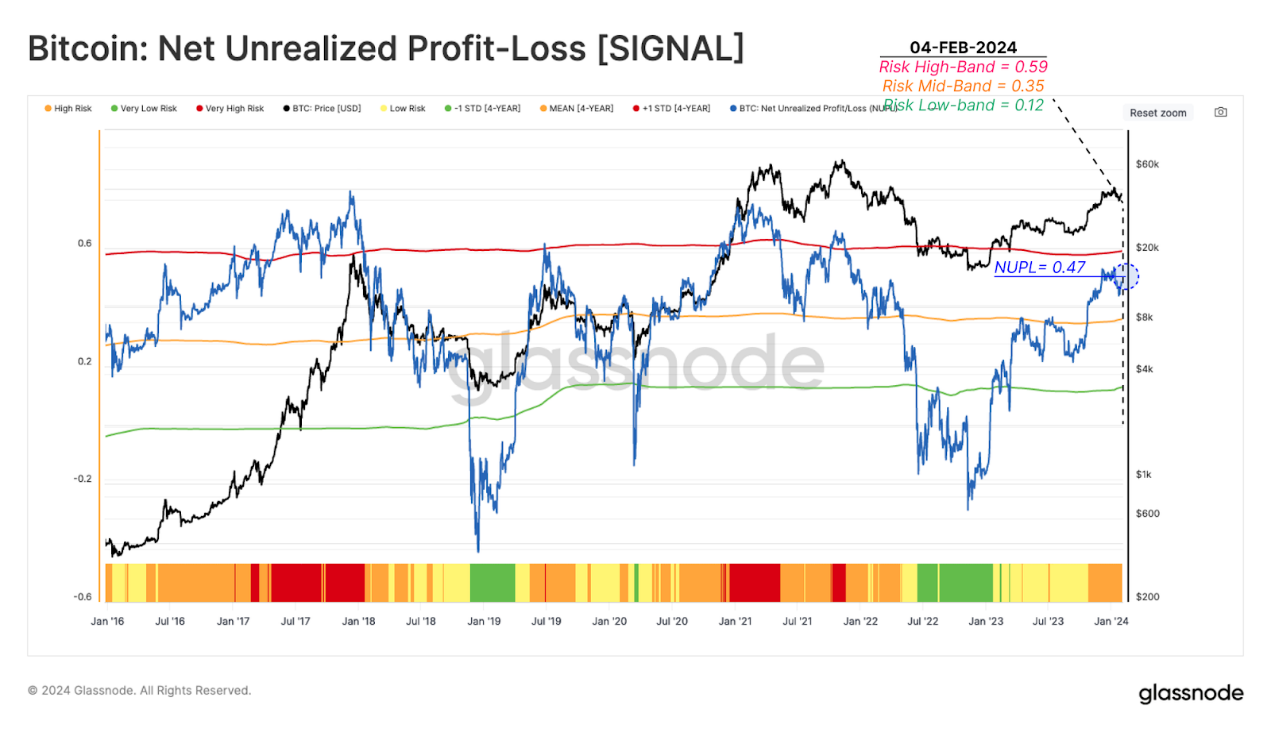
Another risk tool that quantifies market fear and greed sentiment is the Net Unrealized Profit/Loss (NUPL). This indicator examines the percentage of the dollar value of total net profit or loss relative to market capitalization. After estimating the number of profitable tokens using PSIP, NUPL can be used to measure the size of investor profitability.
- Extreme High Risk: NUPL exceeds the 4-year average by one standard deviation, indicating that the market is in an excited phase, with unrealized profits reaching extreme levels (NUPL > 0.59).
- High Risk: NUPL is between the upper limit and the 4-year average, indicating that the market is in a net profit state but below the statistical high (0.35 < NUPL < 0.59).
- Low Risk: NUPL falls below the 4-year average but above the statistical low (0.12 < NUPL < 0.35).
- Extremely Low Risk: NUPL falls below the statistical low, coinciding with the discovery phase of the bottom of the bear market in history (NUPL < 0.12).
After the rebound in October 2023, NUPL entered the high-risk range, reaching 0.47. Despite a significant increase in the number of tokens held in profit, the magnitude of dollar profits did not reach an extremely high-risk state. This indicates that a large portion of tokens were accumulated at a cost of around $30,000 in the second half of 2023.
Realized Profit/Loss Ratio
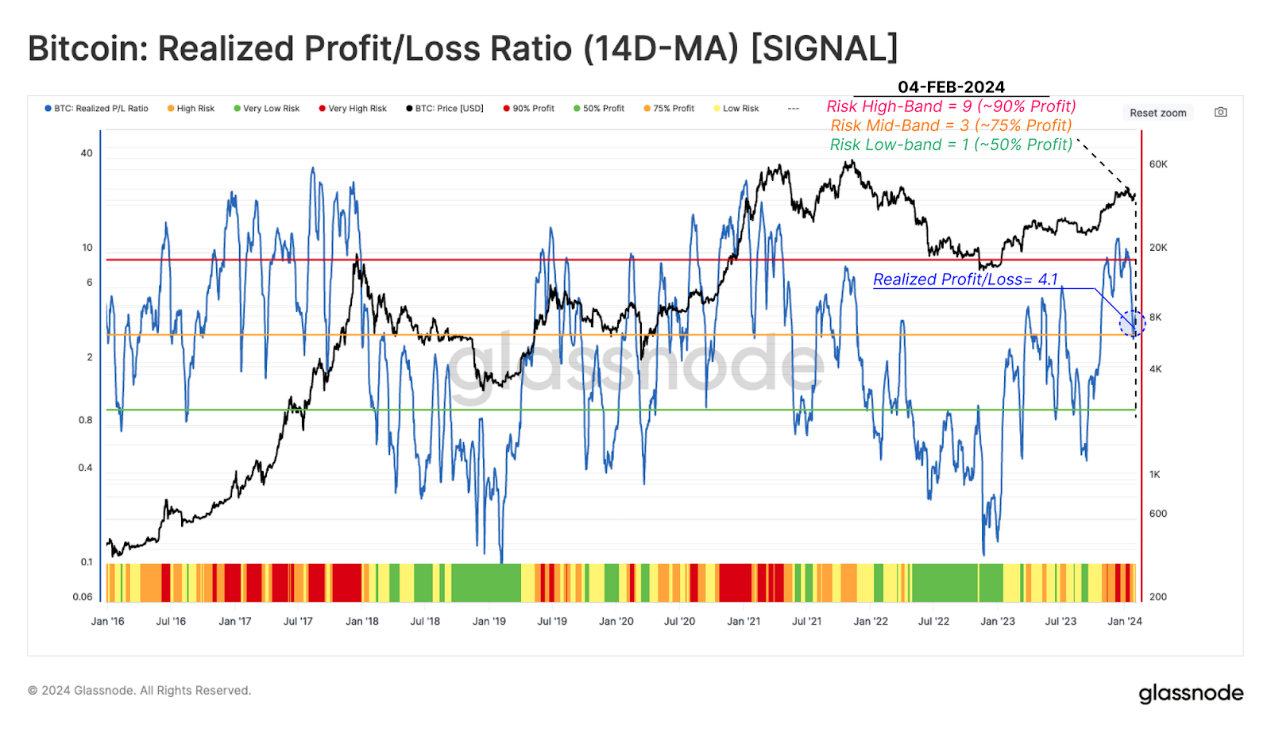
The Realized Profit/Loss Ratio (RPLR) indicator tracks the ratio of profitable and loss events occurring on-chain. The 14-day moving average of this ratio (14D-MA) is used here to clearly identify investor behavior.
- Extreme High Risk: RPLR > 9, indicating that over 90% of on-chain moved tokens are used for profit, a typical characteristic of market demand reaching exhaustion.
- High Risk: 3 < RPLR < 9, indicating that 75%-90% of tokens are in profit, a structure that often occurs around market peaks.
- Low Risk: 1 < RPLR < 3, which typically occurs during the transition phase between high and low-risk states in the market.
- Extremely Low Risk: RPLR < 1, indicating that the majority of tokens are in loss, a common signal of investor capitulation in the late bear market.
As the Bitcoin price reached $48,400, this indicator suggested that the market was in an extremely high-risk state. Currently, the RPLR is at 4.1, indicating a high-risk state.
Short-term and Long-term Risk Analysis
The above risk analysis considers a relatively macro and global perspective. The following will consider the behavior of short-term and long-term holder groups.
Short-term Holders
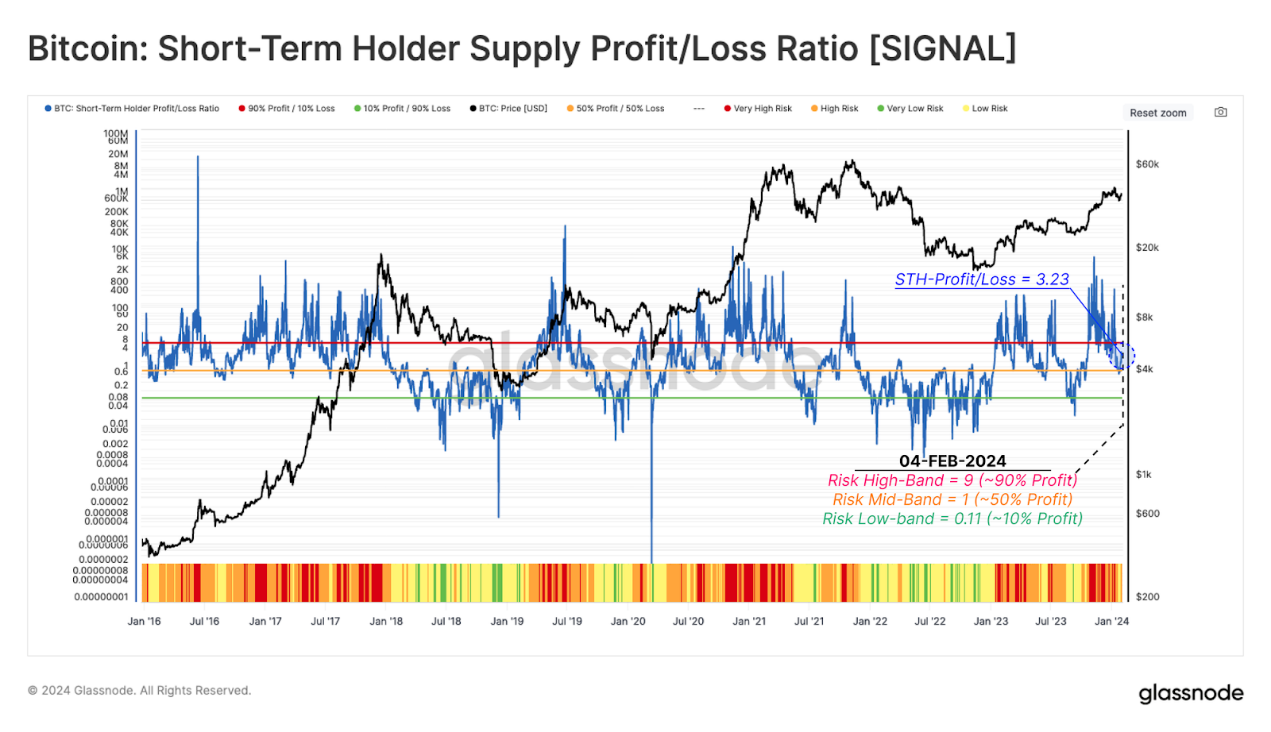
The Short-Term Holder Profit/Loss Ratio (STH-SPLR) reflects the ratio between the profits and losses of tokens held by new investors.
- Extreme High Risk: STH-SPLR > 9, indicating that 90% of tokens held by new investors are in profit.
- High Risk: 1 < STH-SPLR < 9, indicating that 50%-90% of tokens held by new investors are in profit, with moderate risk of expenditure.
- Low Risk: 0.11 < STH-SPLR < 1, indicating that 10%-50% of tokens supplied by new investors are profitable.
- Extremely Low Risk: STH-SPLR < 0.11, indicating that over 90% of tokens supplied by new investors are in a loss, a typical situation in the late bear market.
This indicator recently showed an extremely high-risk situation from mid-October 2023 to mid-January 2024, when ETF speculation activity peaked. This indicated that the vast majority of new investors were profitable, increasing the likelihood of profit-taking. Since then, this ratio has tended towards the neutral low-risk range.
Long-term Holders
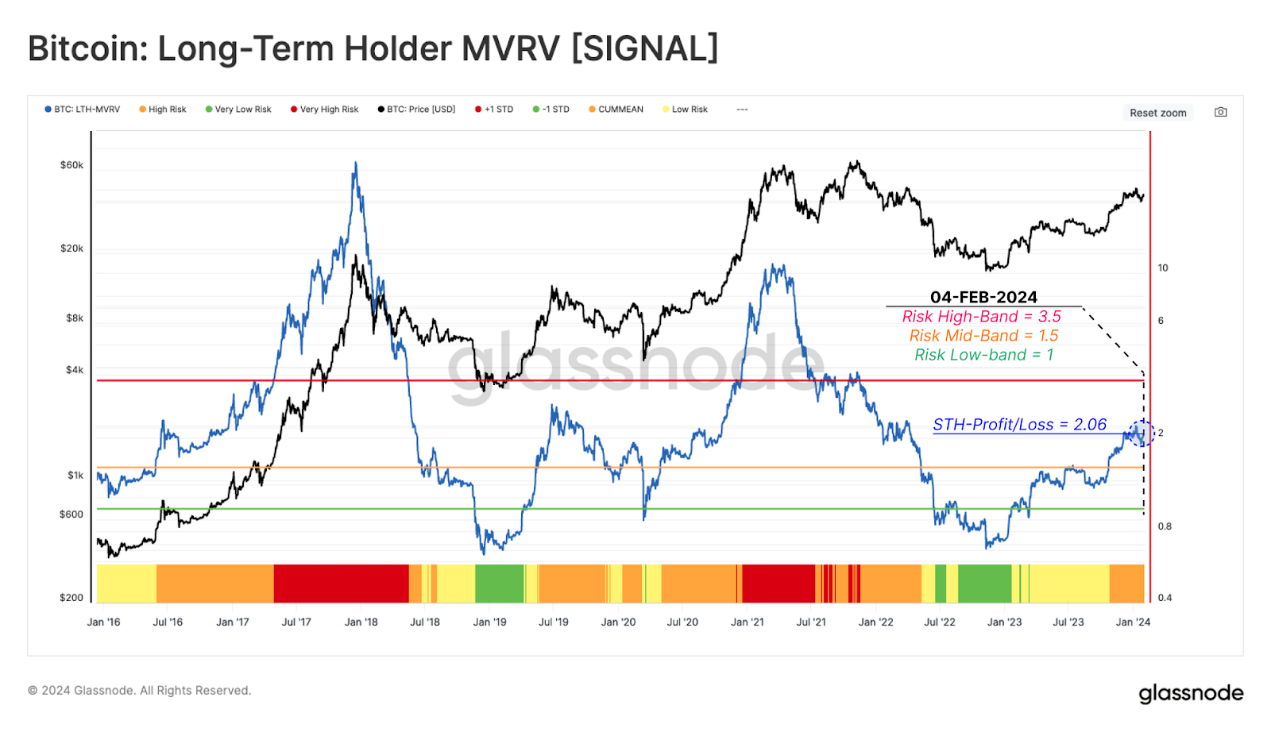
The Long-Term Holder MVRV Ratio (LTH-MVRV) measures the unrealized profits of long-term holders. This indicator can assess the difference between the market price and the average cost of long-term holders.
- Extreme High Risk: LTH-MVRV > 3.5, indicating that the average unrealized profits of long-term holders are 250%. This typically occurs at market all-time highs (ATH).
- High Risk: 1.5 < LTH-MVRV < 3.5, which typically occurs in the early stages of bear and bull markets.
- Low Risk: 1 < LTH-MVRV < 1.5, indicating that the average profits of long-term holders are modest, typical of the late stages of a bear market and the early stages of a bull market.
- Extremely Low Risk: LTH-MVRV < 1, indicating that the price has fallen below the average cost of long-term holders. This typically highlights a state of seller exhaustion and investor capitulation.
After the recovery from the FTX crash, this indicator has risen to 2.06, entering a high-risk state. As mentioned earlier, this level typically occurs in the early stages of a bull market.
While each of the above indicators can be used individually, their combined use often provides a more comprehensive reflection of the market conditions. The chart below is compiled from data over the past 5 years. These risk factors reference a range of data and investor behavior, helping to establish an analytical framework for analysts and investors.

Related Reading: Wall Street Analyst: Four Reasons Bitcoin Will Reach $70,000 This Year
��Pionex Red Packet "Dragon", read articles, collect passwords! Win 100 U New Year Red Packets!
Collect today's mnemonic phrase

Follow @PANewsCN on Twitter to participate, activity link:
https://twitter.com/PANewsCN/status/1756118030571249787
免责声明:本文章仅代表作者个人观点,不代表本平台的立场和观点。本文章仅供信息分享,不构成对任何人的任何投资建议。用户与作者之间的任何争议,与本平台无关。如网页中刊载的文章或图片涉及侵权,请提供相关的权利证明和身份证明发送邮件到support@aicoin.com,本平台相关工作人员将会进行核查。


