大饼周K:
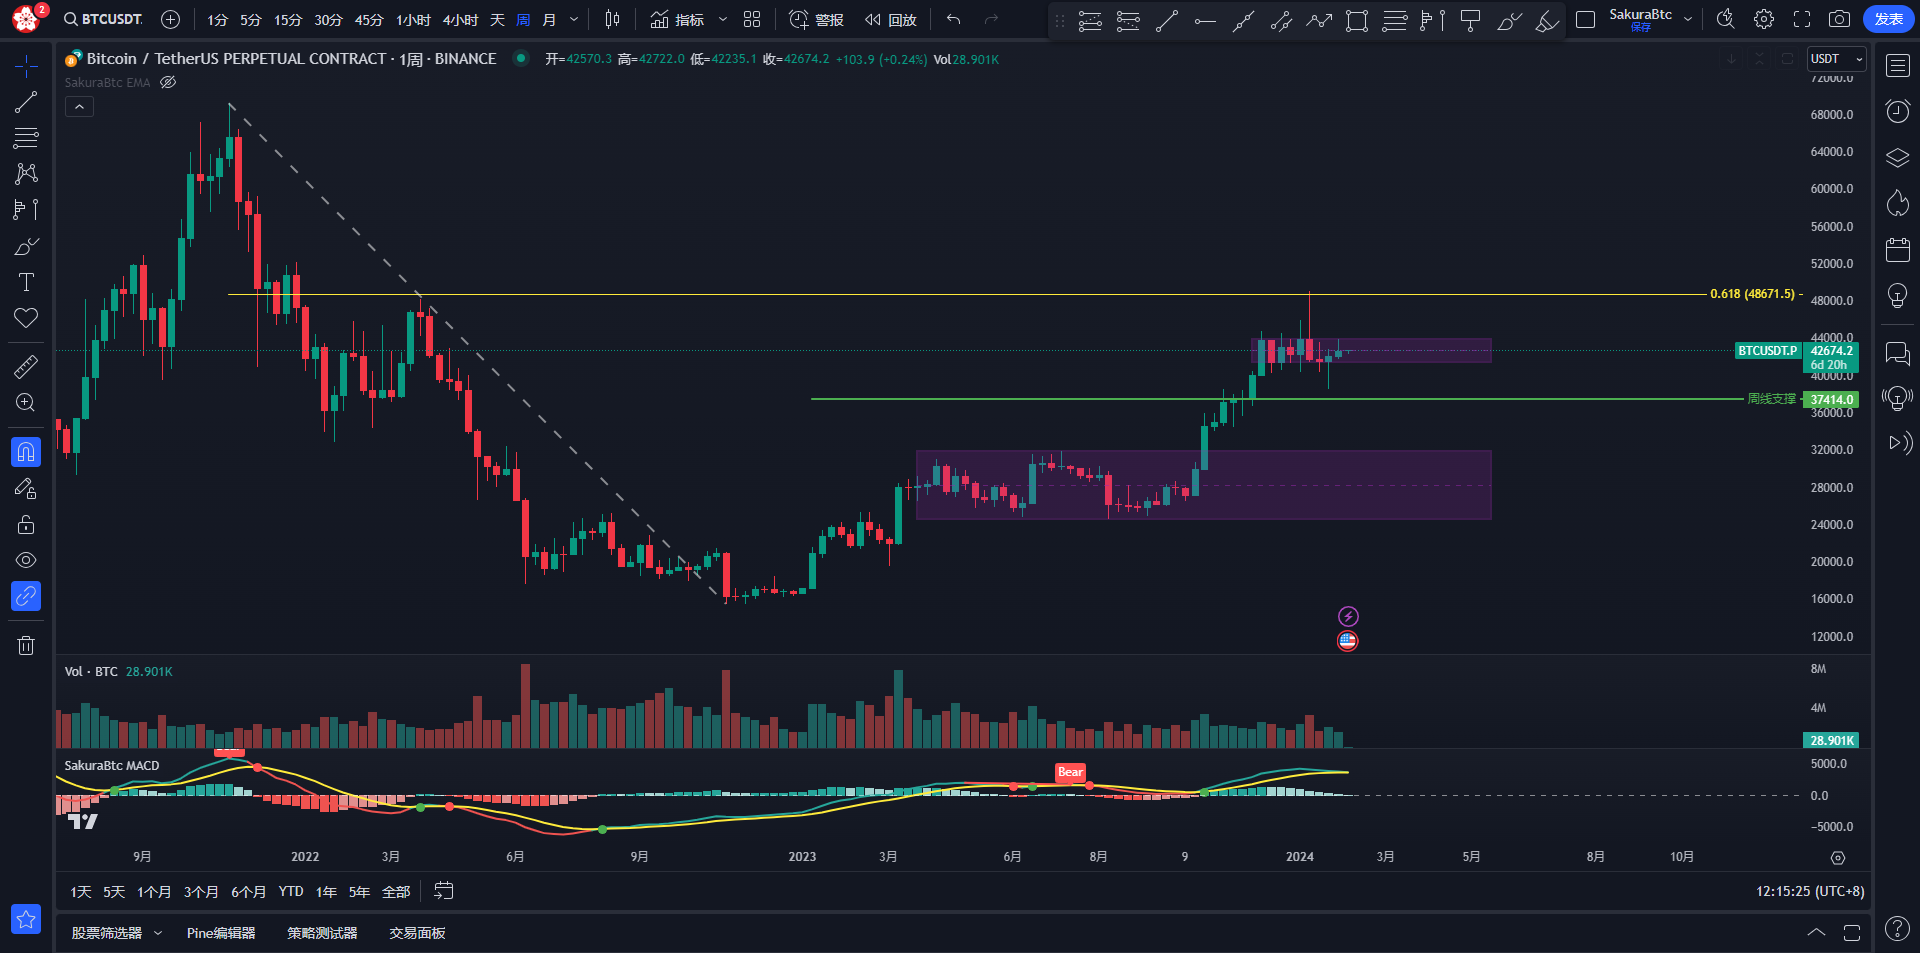
从周线来看的话,上周是收了一根阳线,行情的波动并不太大,这根K线的实体部分,同样是在这样一个区间之内的。行情并没有出现一个明显的颓势或者上涨趋势。之前行情是受到ETF利好新闻的影响,创了一个高点,正好是来到了这样一段下跌趋势的0.618回回撤位受阻,那么,我就认为,如果行情再次把上方这样一个高点给假突破了,拿到流动性再下跌的话,会是一个不错的走势。
大饼日K:
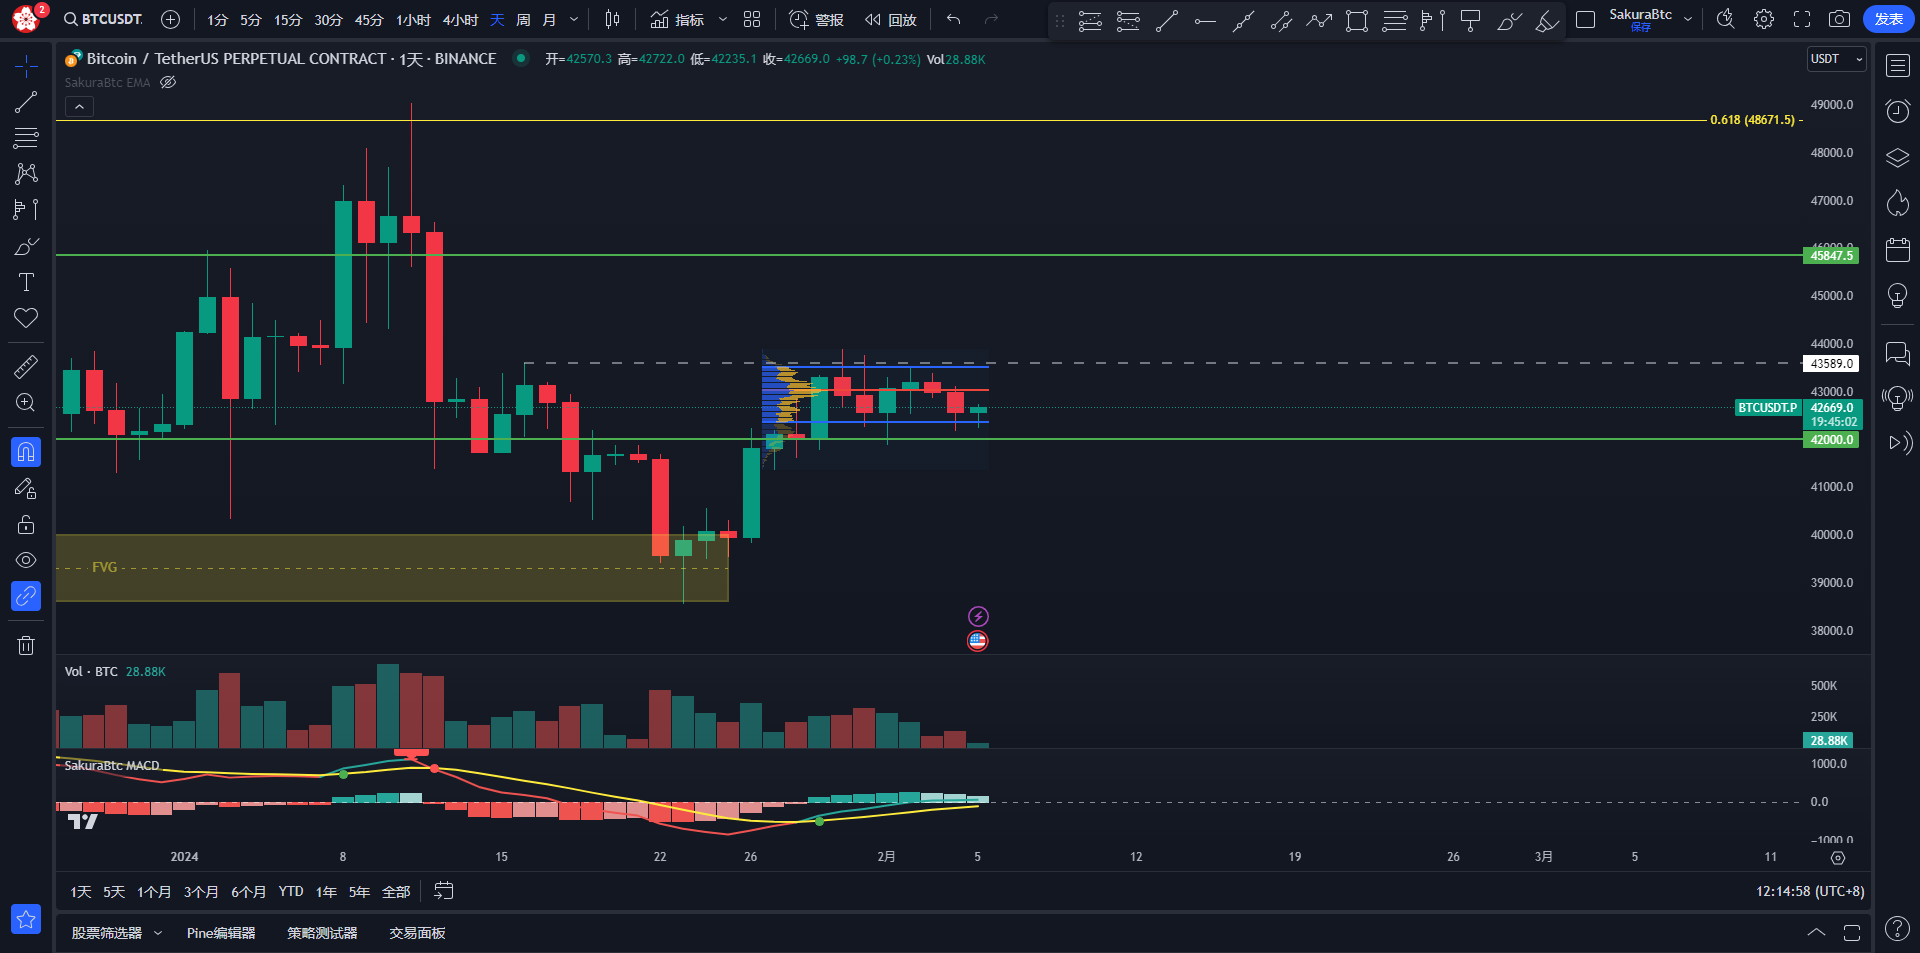
从日线来看的话,周末两天收了两根阴线,但是行情并没有出现一个明显的颓势趋势,而是在这里进行一个盘整,那么,我们看一下目前行情的成交量分布图,目前行情是受到VAL一线的支撑,并没有跌破这一线,那么,我们从小周期来看,出现一些价格行为的话,是可以尝试做多的。
大饼4h:
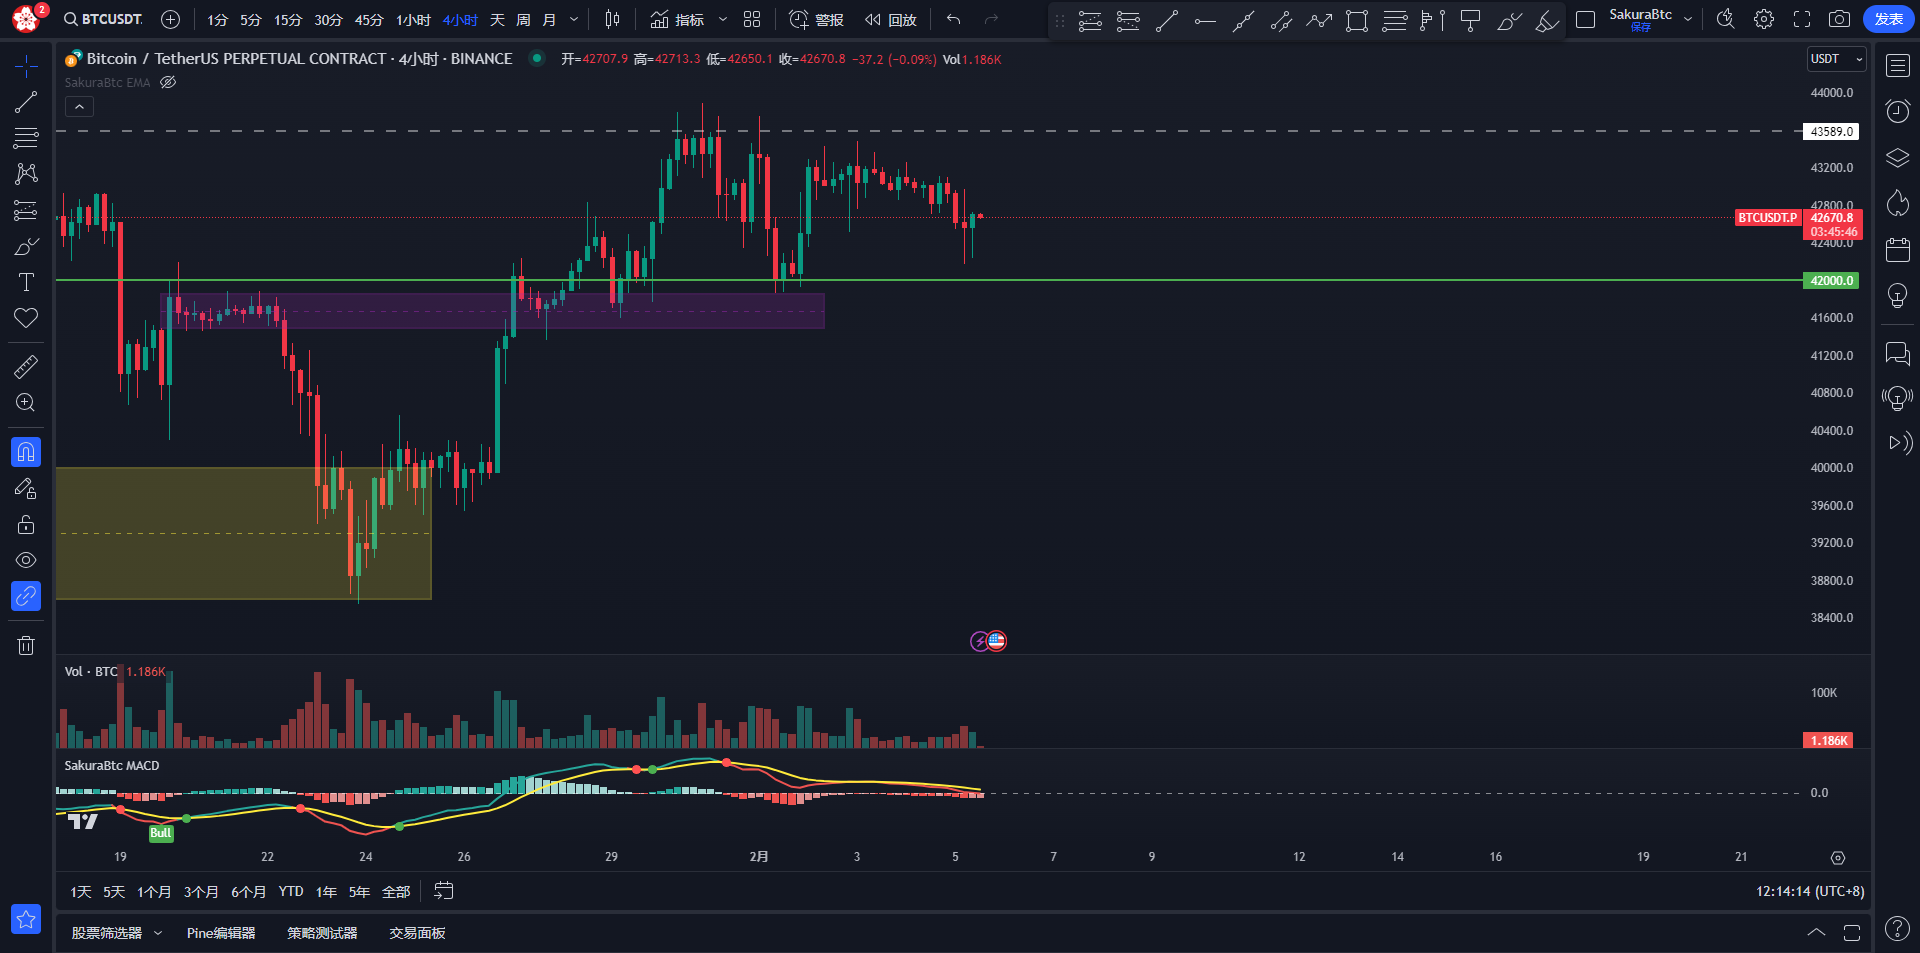
从4小时来看的话,上周我有说过,这里出现的一个黄昏之星是一个诱空的动作,之后,行情跌到42000受到支撑,又再次上涨。但是,它并没有来测试之前的这样一些高点,同时,这里的一个平行顶的位置,行情也没有来测试,那么,我就认为,行情上方这样一些高点,是非常有吸引力的。今天早上8点钟收盘的时候,行情是收了一根上下影线都非常长的K线,说明行情在这里多空力量非常均衡,行情已经把之前涨的比较快的这两根K线位置回补完成。那么,这里的话,我们需要关注期货的一个走势。
大饼1h:
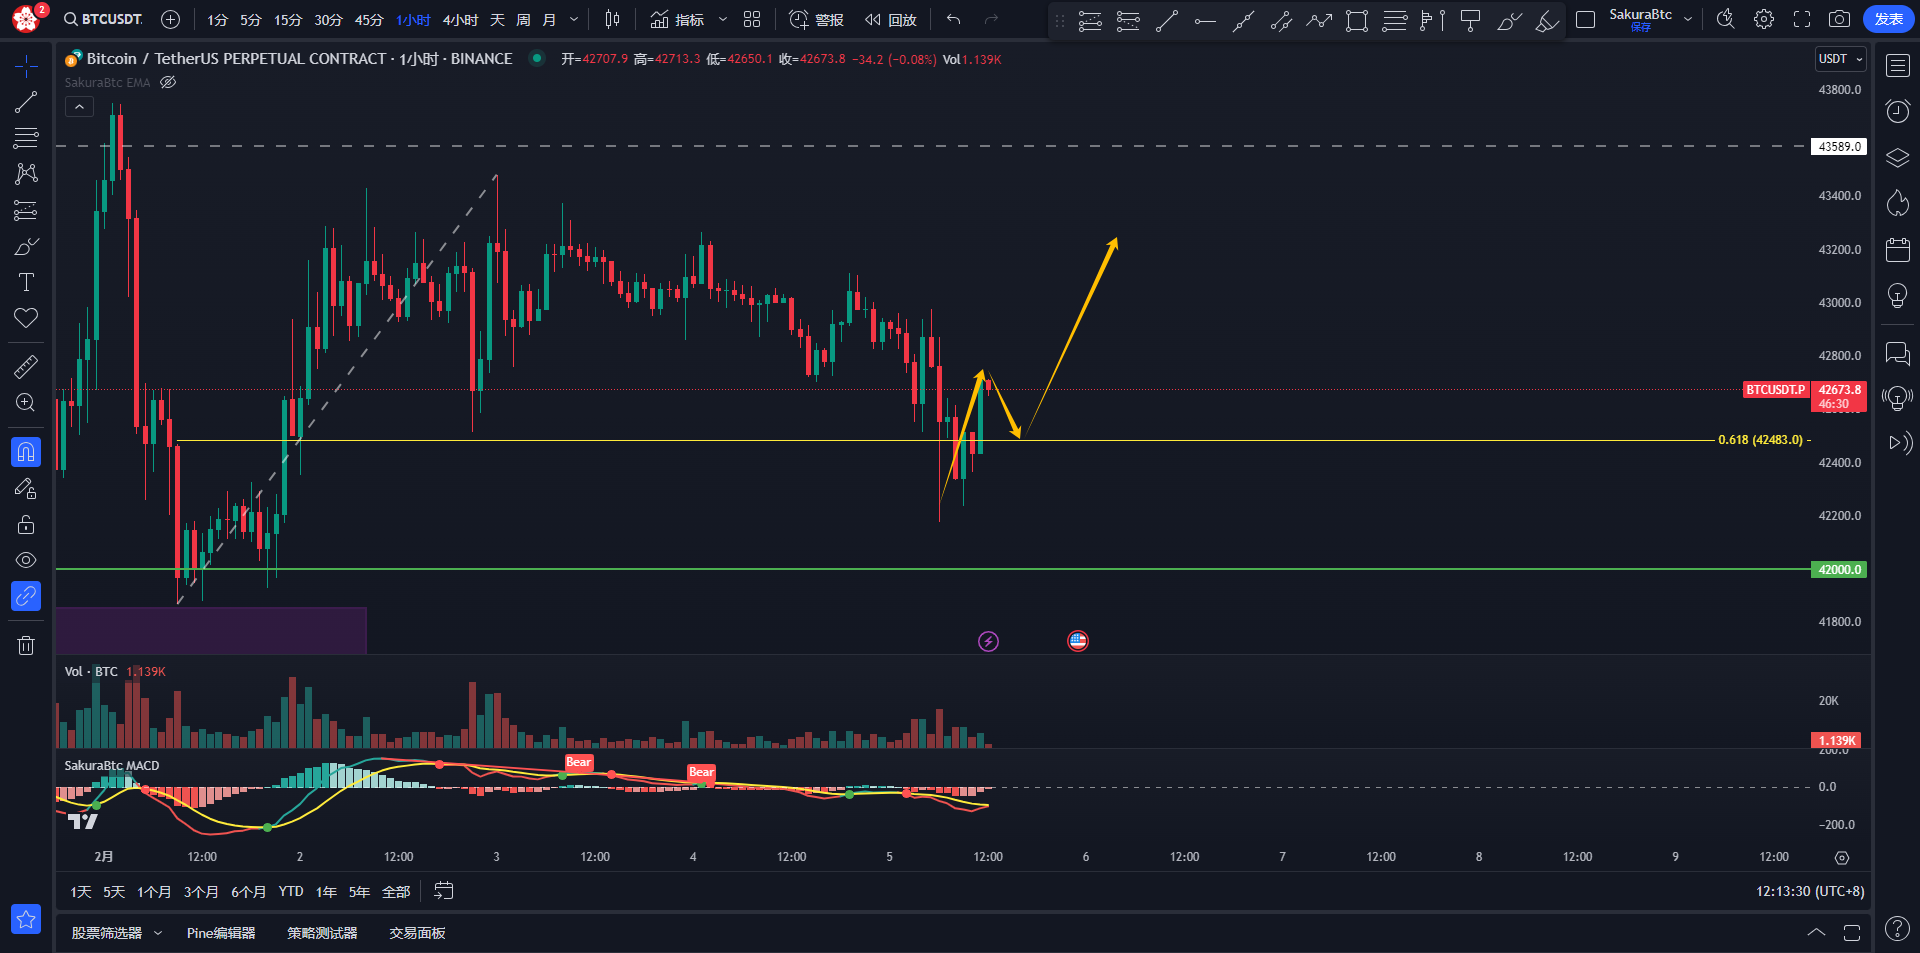
从1小时来看的话,当行情成功站稳0.618的位置,同时,走出一个高点越高,低点越高的走势,才会是一个非常不错的入场机会。
综上所述,今天行情的话,需要重点关注42500左右的反转情况,如果行情成功反转,继续上涨的话,就会再次来测试43800的阻力。否则的话,如果行情跌破这一线,就需要关注41200的支撑情况。同时,需要关注今晚美股开盘后行情的走势。
对今天的行情有需要交流的地方,也欢迎进行交流,谢谢。

风险提示:本平台承诺提供专业资讯服务,本平台内容仅供投资者参考,不作为任何投资决策建议。同时,本平台不承诺投资者获取收益,也不与投资者约定分享投资收益或分担投资损失。市场有风险,投资需谨慎。
免责声明:本文章仅代表作者个人观点,不代表本平台的立场和观点。本文章仅供信息分享,不构成对任何人的任何投资建议。用户与作者之间的任何争议,与本平台无关。如网页中刊载的文章或图片涉及侵权,请提供相关的权利证明和身份证明发送邮件到support@aicoin.com,本平台相关工作人员将会进行核查。


