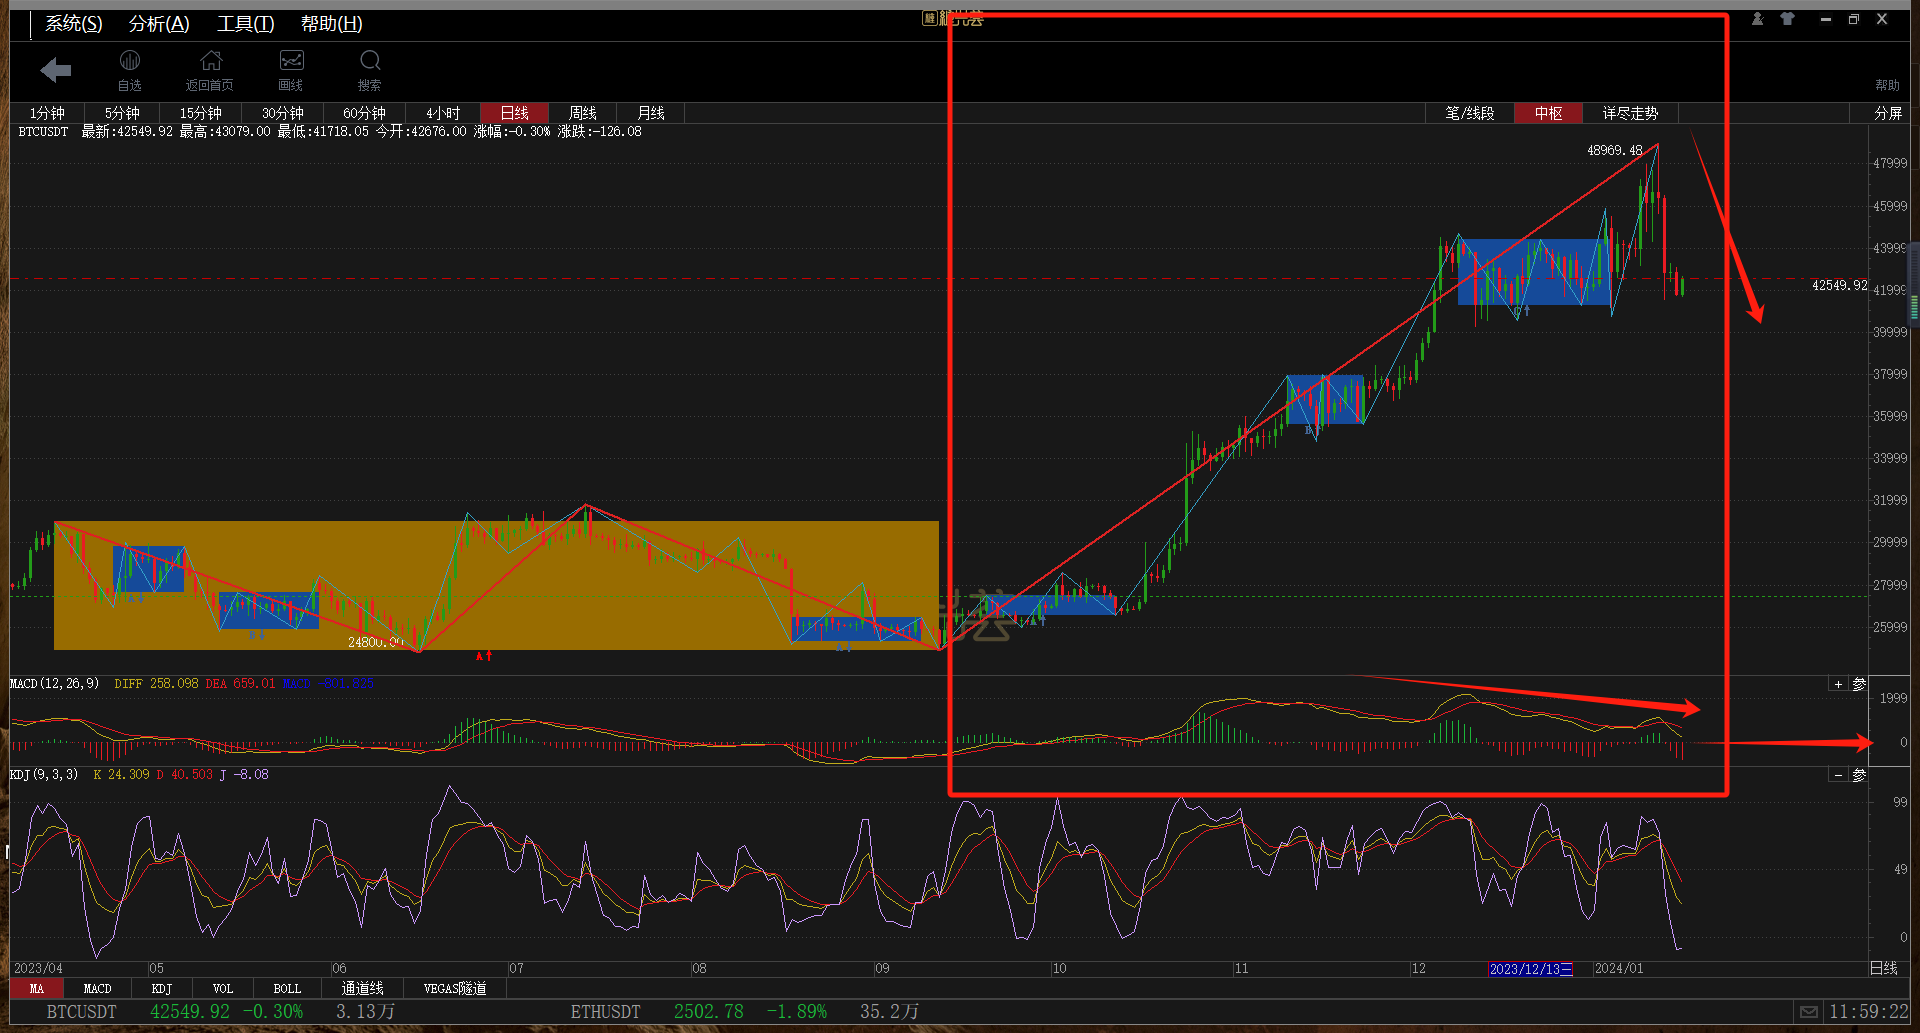
Daily chart: The bearish divergence within the upward segment has caused the current reverse pullback of a wave. Continue to follow the growth and completion of the downward wave, and pay attention to whether the MACD yellow line will break below the zero axis.

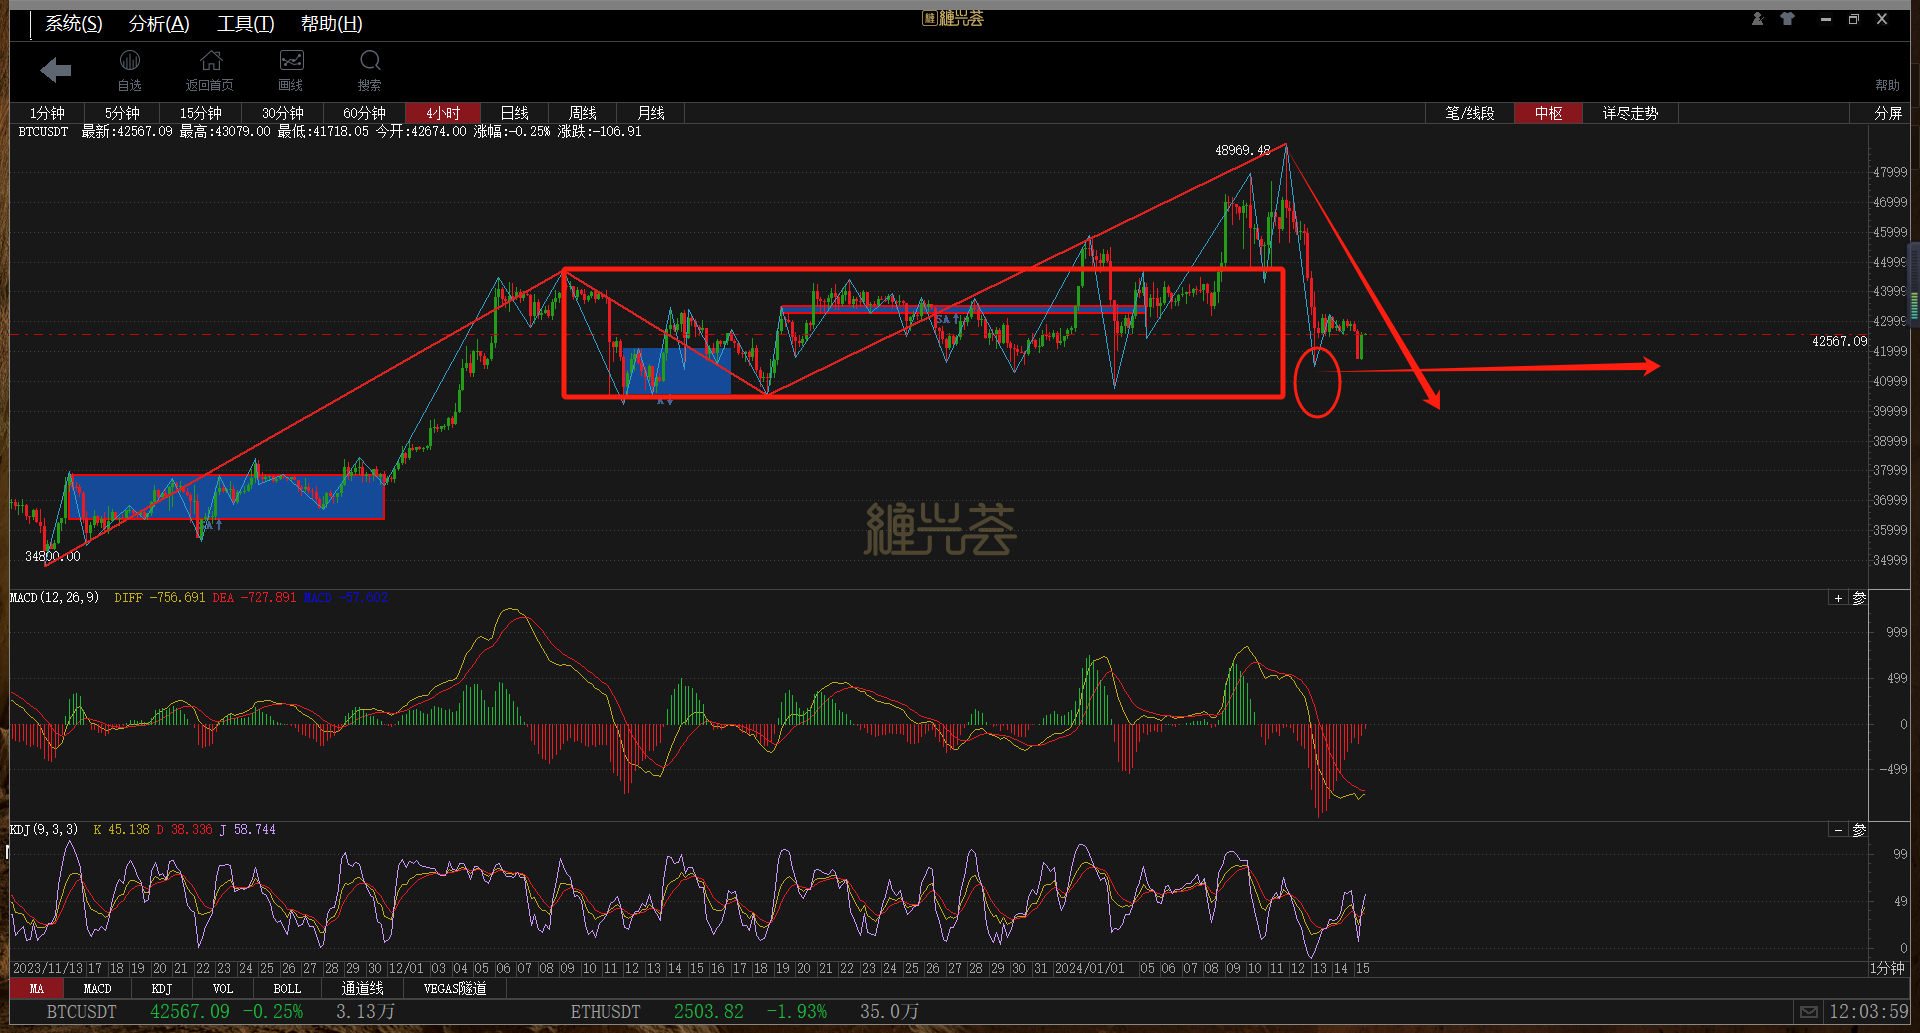
4-hour chart: Combined with the daily downward wave, follow the growth of the subsequent downward segment. The current strong downward momentum within the segment, incomplete structure, and the construction of a sub-level center. The low point at the circle is highly likely to be broken again. Reduce positions or hedge on the short side at the sub-level high, then decide on subsequent operations based on the completion of the structure. The red box area can be used as a reference.

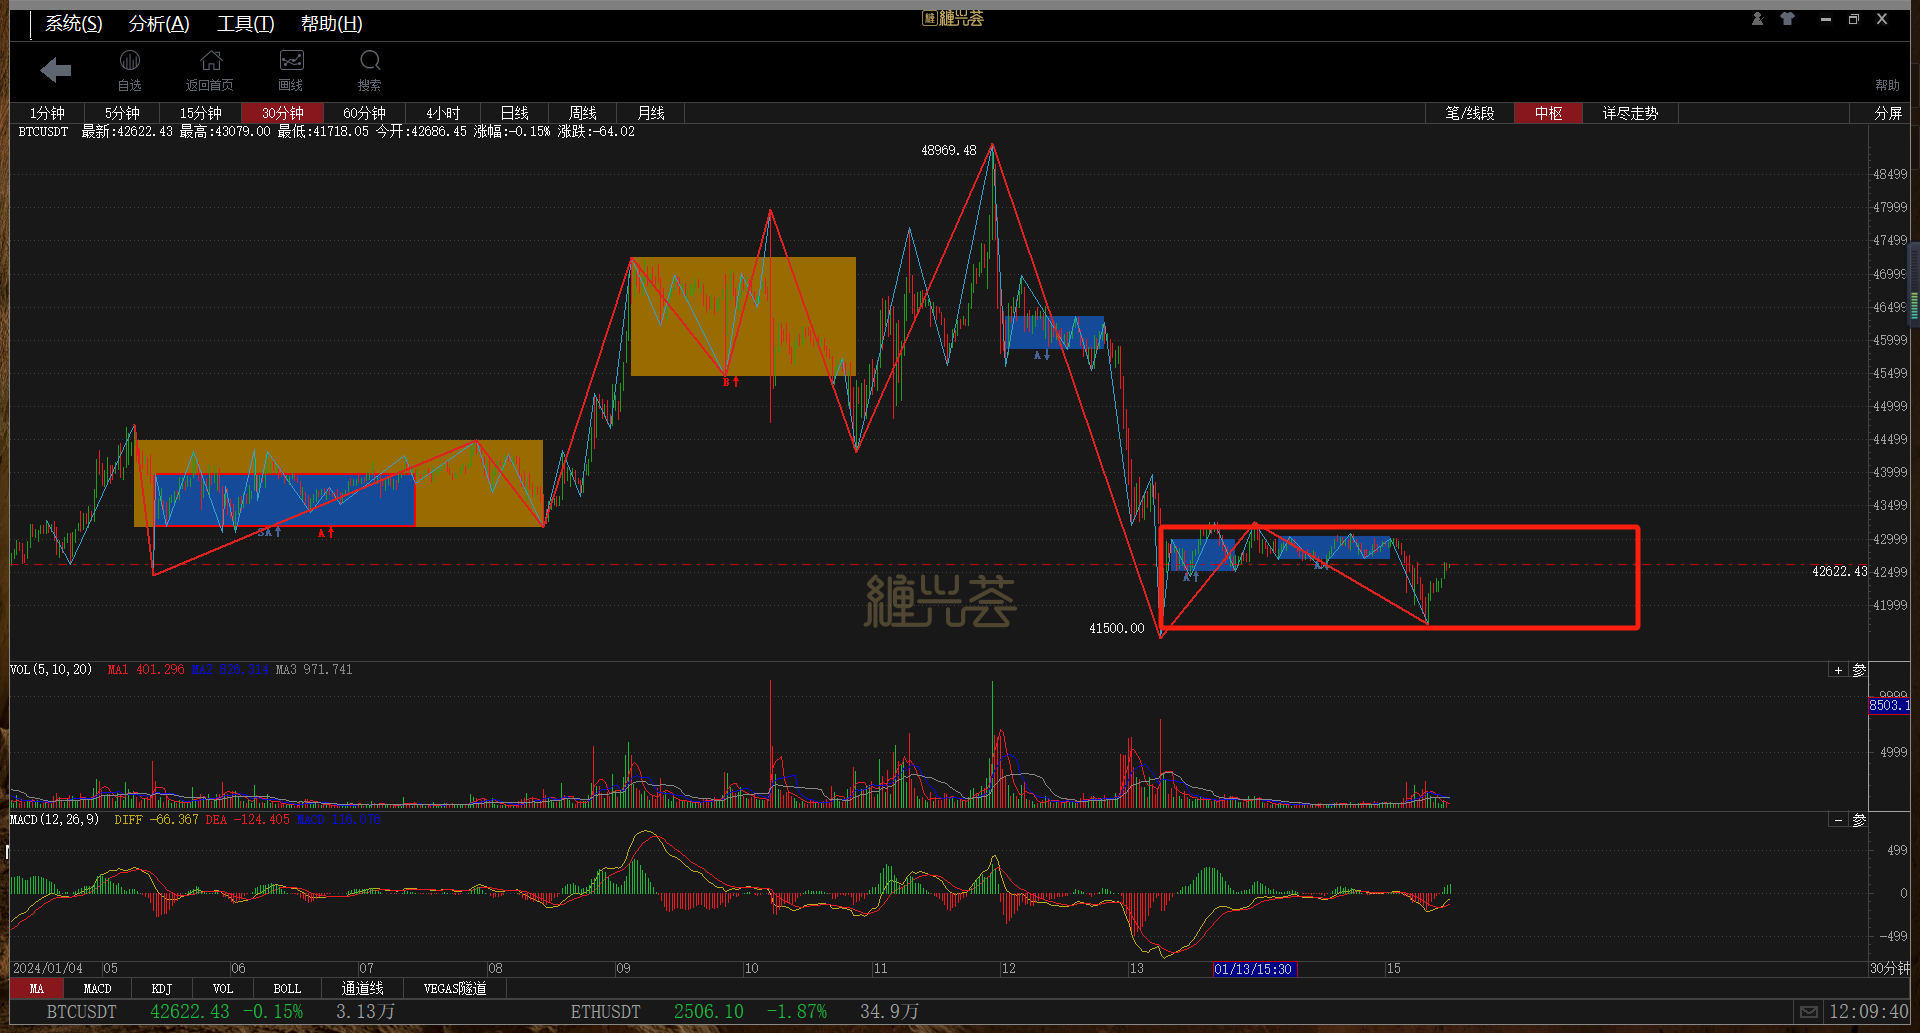
30-minute chart: The center is under construction, with a focus on shorting at lower levels. Pay attention to the strength after breaking 41500, and continue to follow the community strategy to avoid missing important reminders.

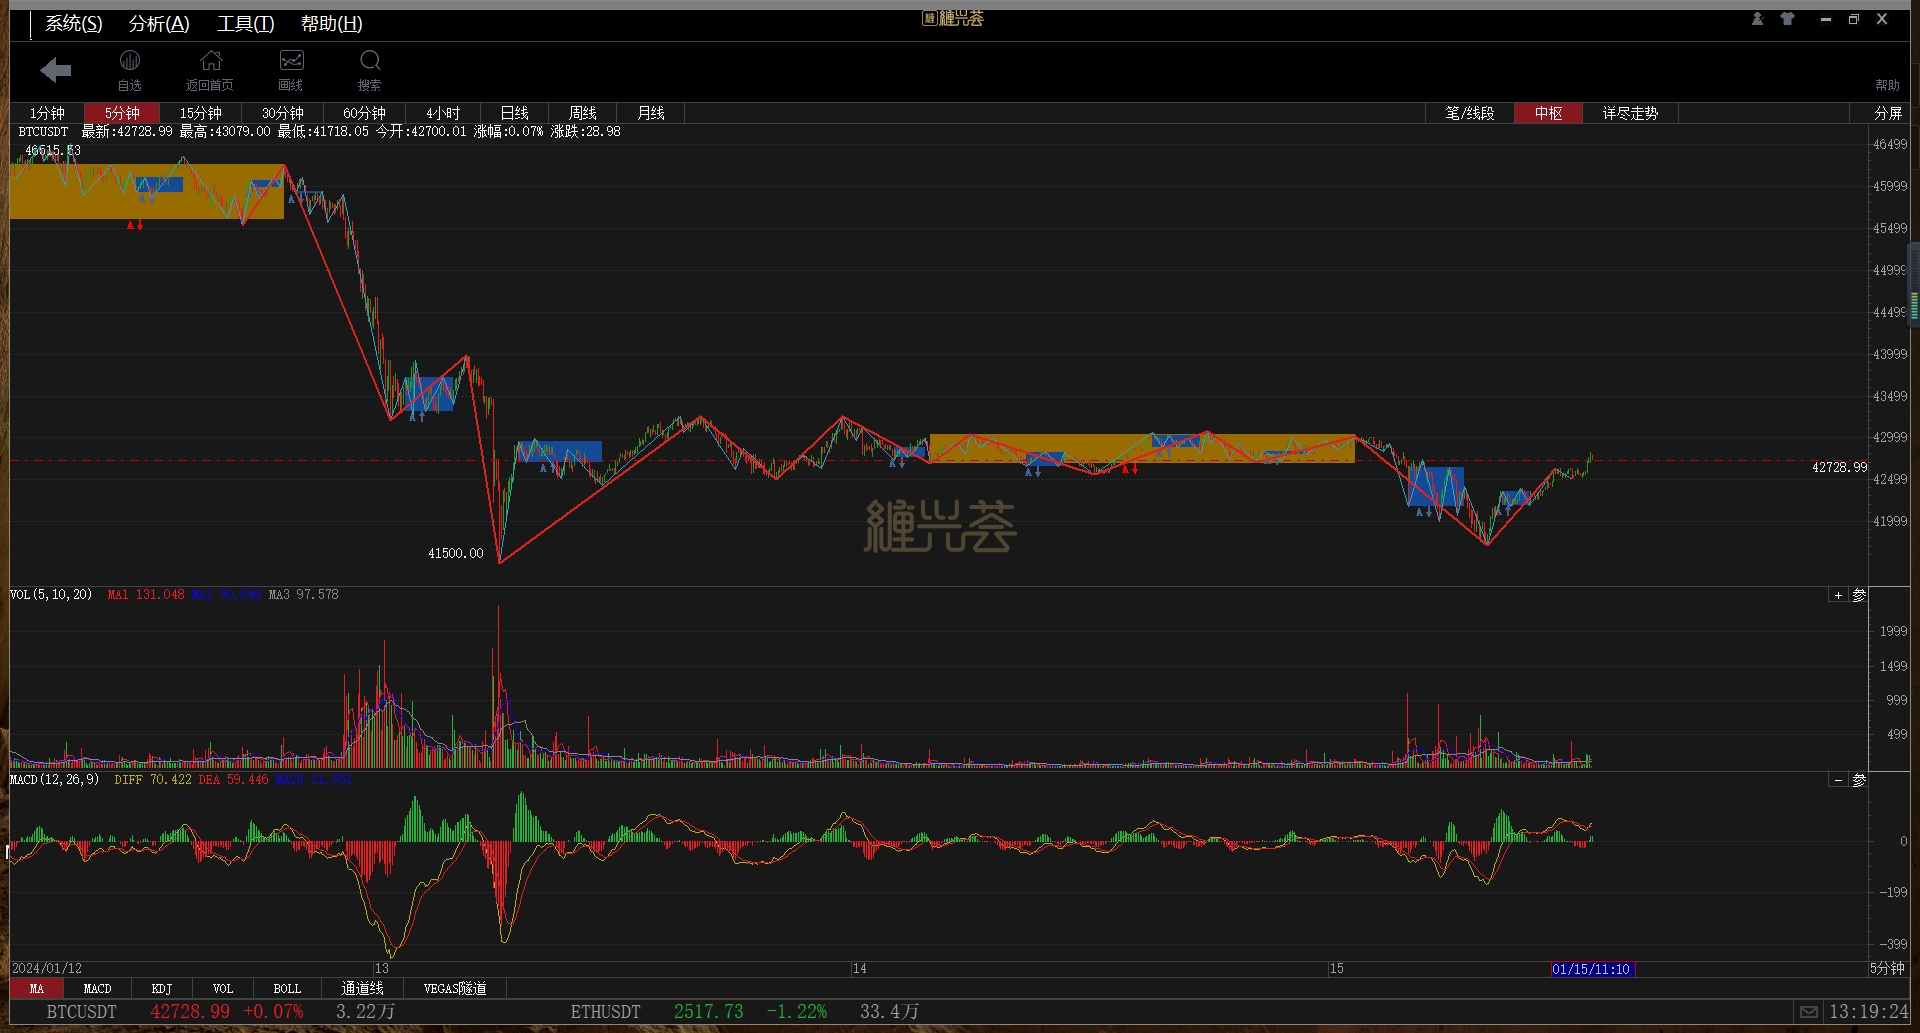
5-minute chart: Combined with 1-minute level operations, if a selling point appears at the 1-minute level, it is recommended to short first, and then consider a long position when a 5-minute level 2 buy signal appears.

[Feel free to leave comments, and if you like my analysis, you can also leave the cryptocurrency you want to analyze in the comment section]
[If you also like the study and exchange of Chan theory, you can search "缠兴荟" on Baidu search engine to join our community]
免责声明:本文章仅代表作者个人观点,不代表本平台的立场和观点。本文章仅供信息分享,不构成对任何人的任何投资建议。用户与作者之间的任何争议,与本平台无关。如网页中刊载的文章或图片涉及侵权,请提供相关的权利证明和身份证明发送邮件到support@aicoin.com,本平台相关工作人员将会进行核查。


