Author: The Block Research Director Lars
Compiled by: Jordan, PANews
In August, most of the cryptocurrency industry indicators saw significant adjustments, but the sluggish market conditions did not improve in September. Overall, the past month continued to show a depressed state, with many indicators even further declining. This article will use 12 charts to interpret the state of the cryptocurrency market in September that has just passed.
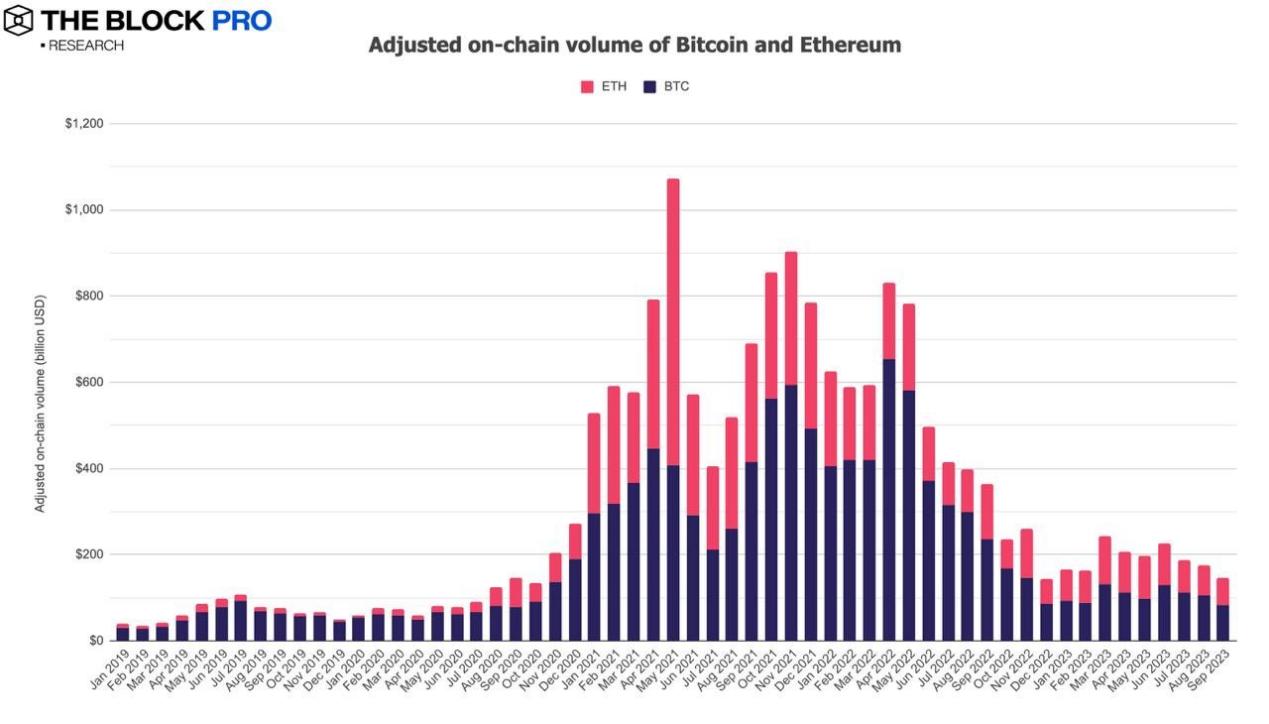
- In September, both Bitcoin and Ethereum saw a decrease in on-chain total transaction volume after adjustments, with an overall decrease of 17.5% to $145 billion. The on-chain transaction volume of Bitcoin after adjustments dropped by as much as 20.83%, while Ethereum's on-chain transaction volume decreased by 12.6%.
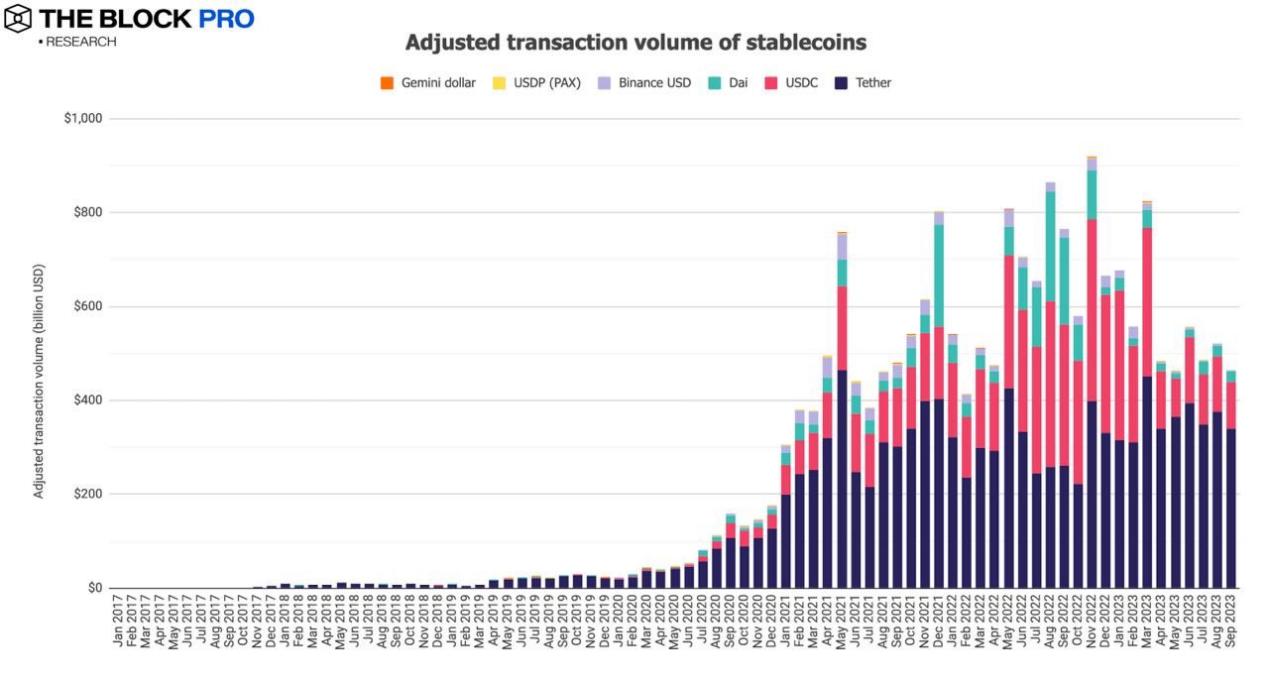
- After adjustments, the on-chain transaction volume of stablecoins in September also decreased to $465.2 billion, with a decrease of approximately 10.7%. However, the supply of issued stablecoins increased to $116 billion, with a modest increase of only 0.75%. This is one of the few industry indicators that showed an increase in September. Among them, the market share of the US dollar stablecoin USDT accounted for 72.3% (a decrease from August), while the market share of USDC further decreased to 20%.
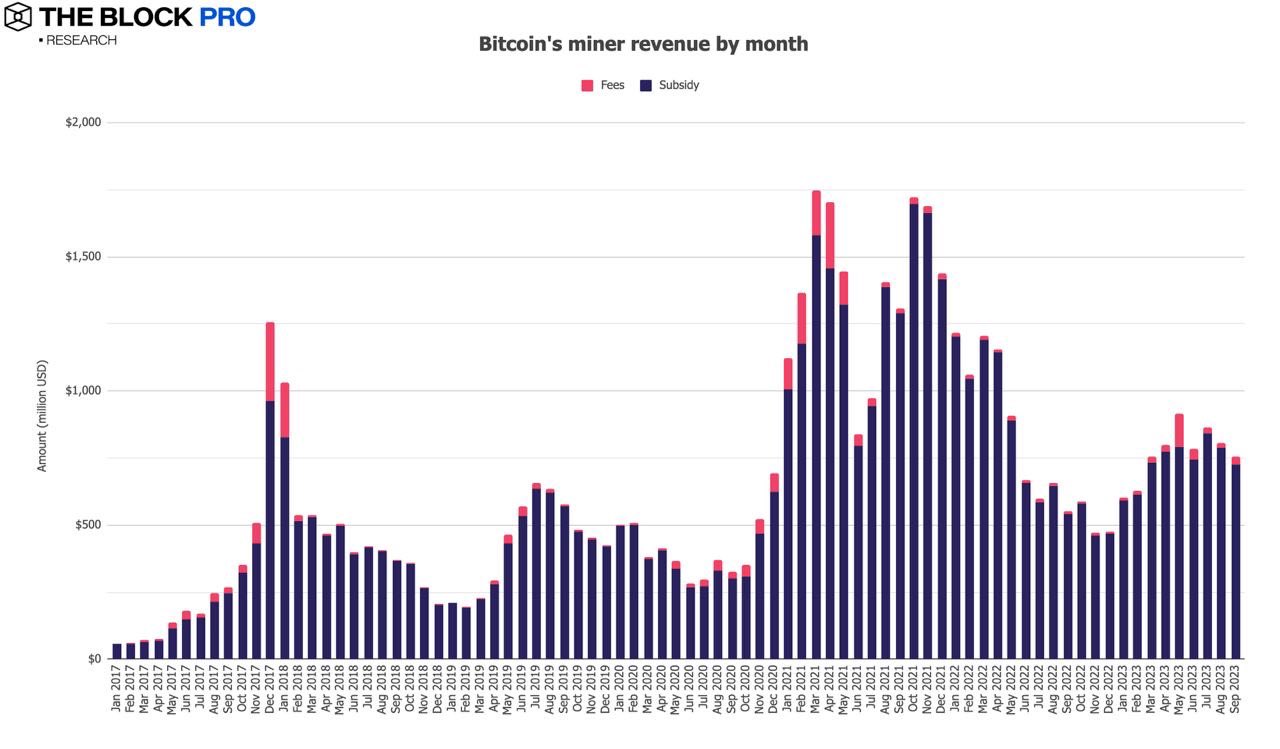
- Bitcoin miner revenue also further decreased in September, dropping to $753 million, a decrease of 6.4%. At the same time, Ethereum staking income also decreased by 11.2% to approximately $115 million.
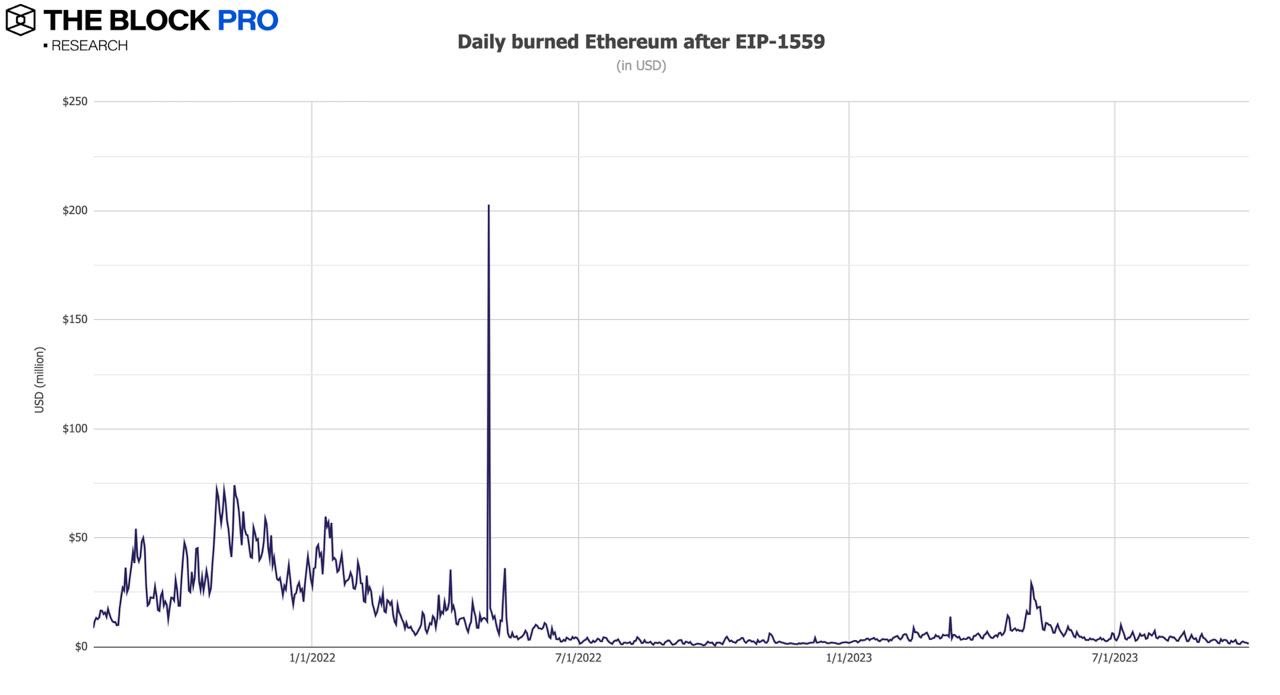
- In September, the Ethereum network burned a total of 44,267 ETH, equivalent to $71.7 million. Data shows that since the implementation of EIP-1559 in early August 2021, Ethereum has burned approximately 3.62 million ETH, worth about $10.24 billion.
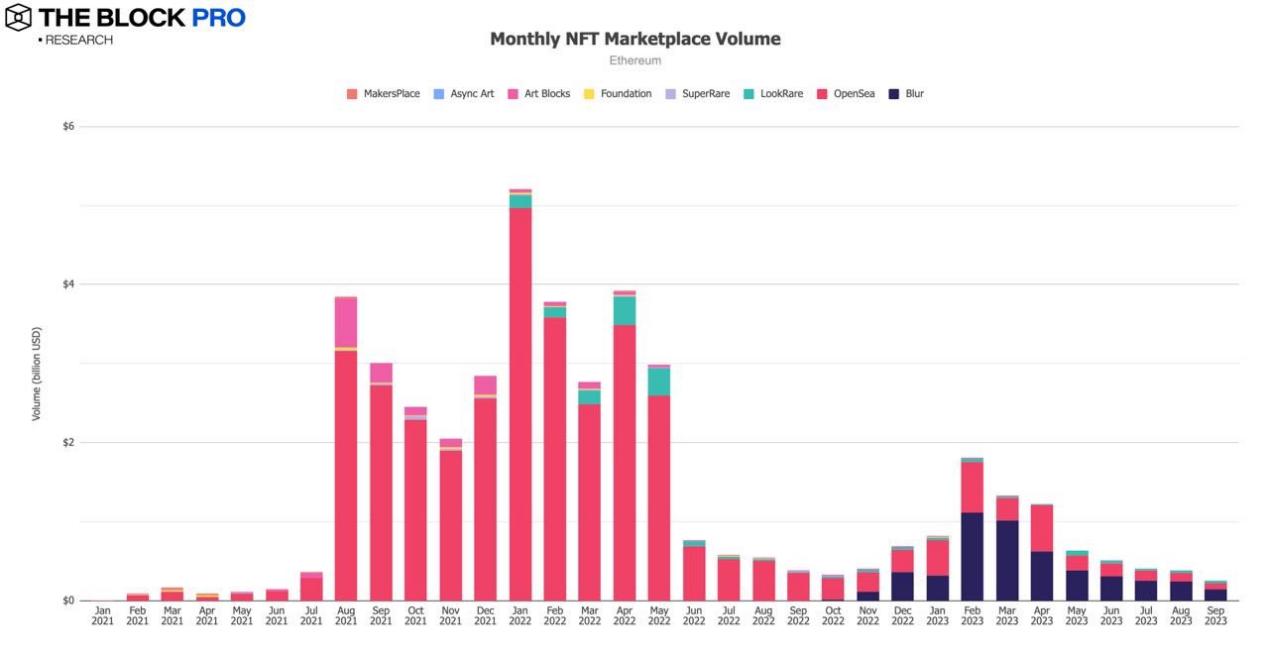
- The on-chain NFT market transaction volume in September saw a significant decrease, dropping to approximately $261 million, with a decrease of 31.8%. However, the newly emerged NFT market Blur has surpassed OpenSea in monthly transaction volume and other indicators for the 8th consecutive month.
- The spot trading volume of compliant centralized exchanges (CEX) also saw a staggering decrease in September, dropping by 28.3% to approximately $187.7 billion, reaching the lowest level since October 2020.
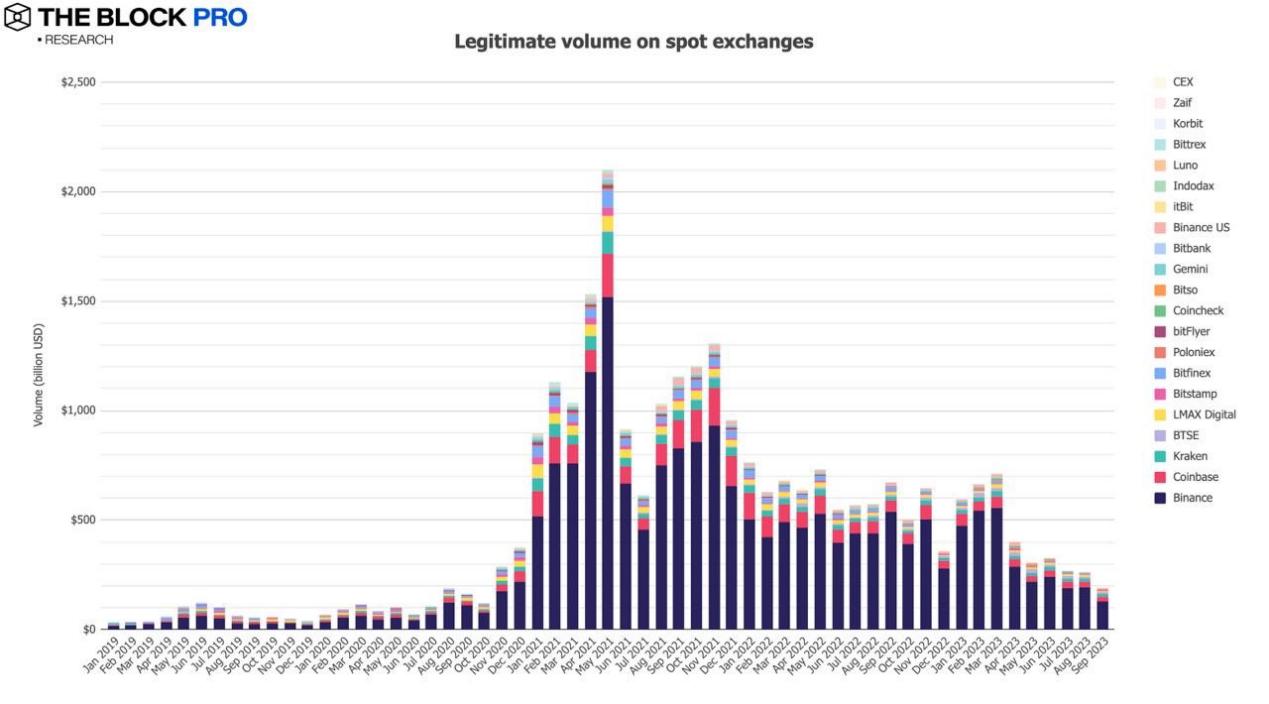
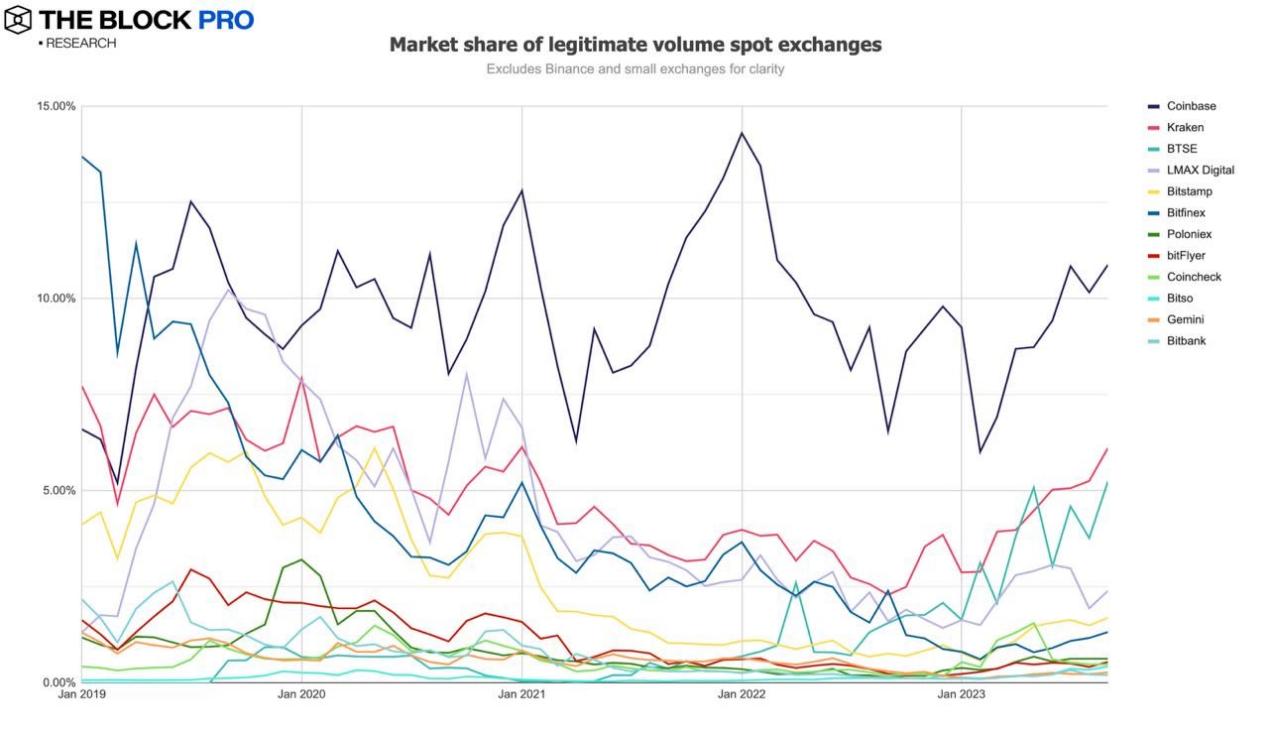
- The market share rankings of major cryptocurrency exchanges in the spot market in September are as follows: Binance at 69.3% (a decrease of about 5 percentage points from August), Coinbase at 10.9%, Kraken at 6.1%, BTSE at 5.2%, and LMAX Digital at 2.4%.
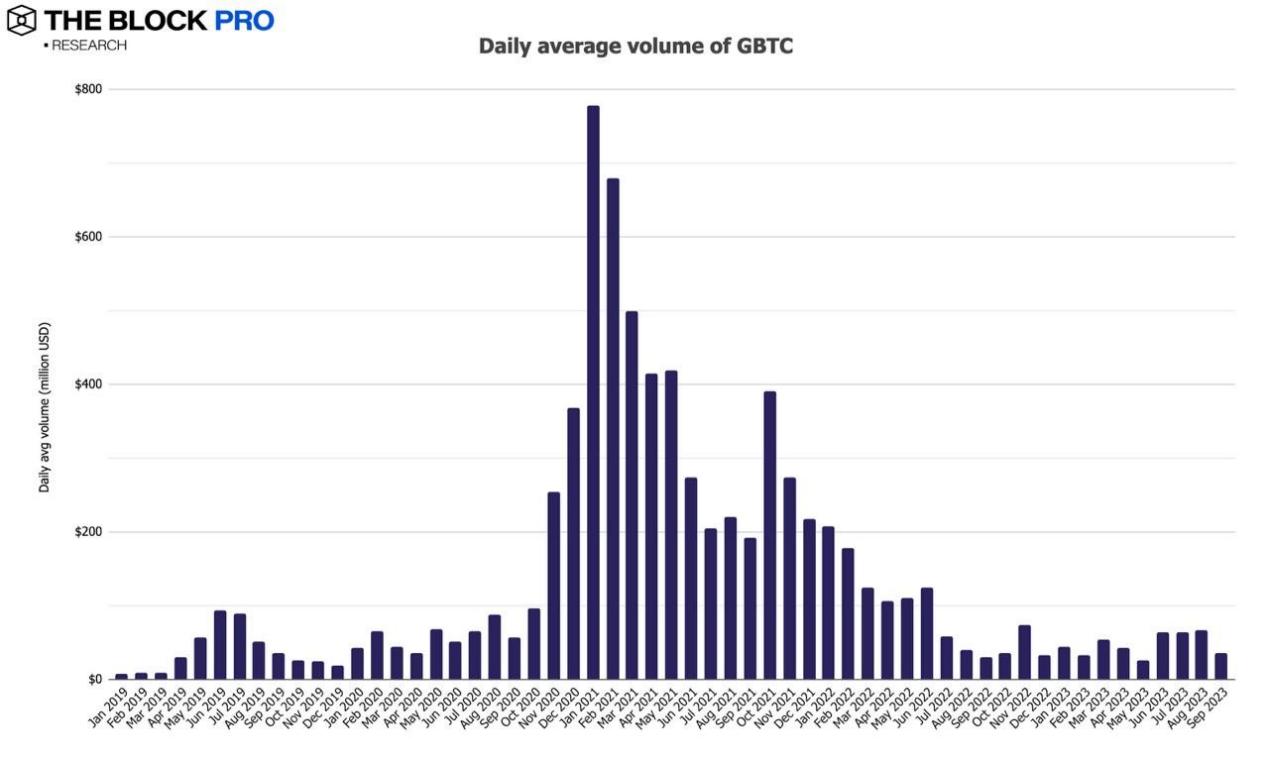
- The daily average trading volume of Grayscale's Bitcoin Trust Fund GBTC almost halved in September, dropping to $36 million, a decrease of 46.9%.
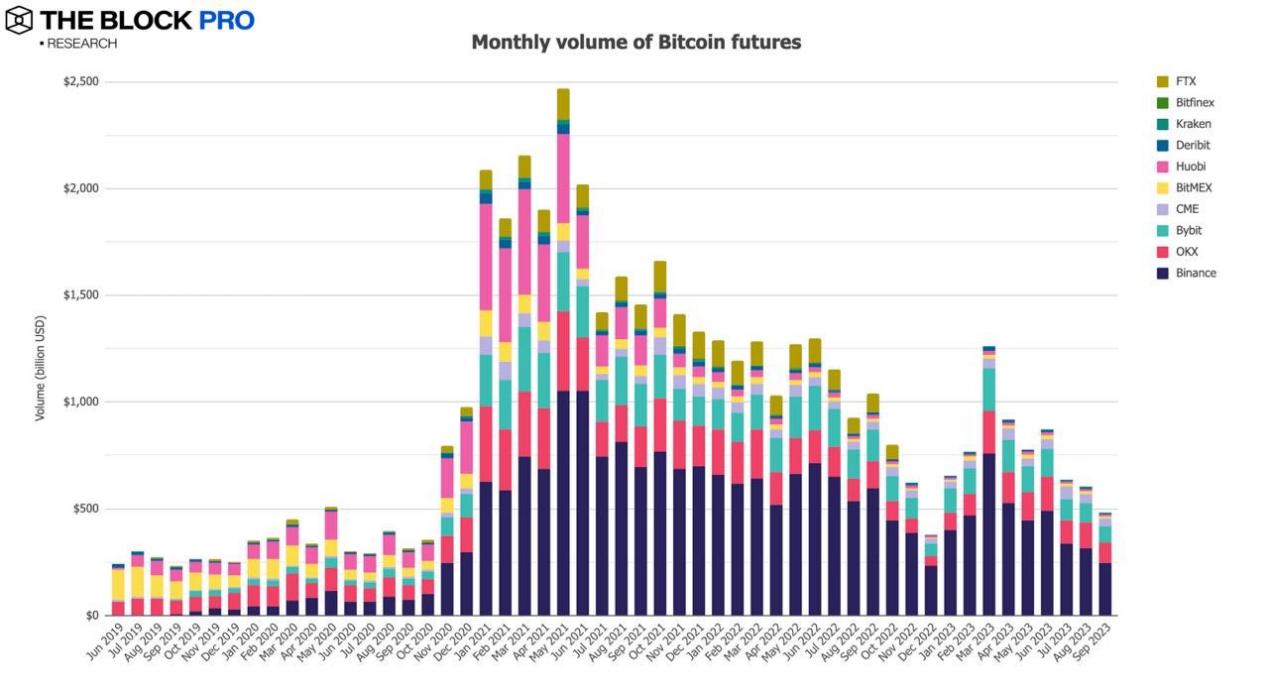
- In terms of cryptocurrency futures, the open interest of Bitcoin futures increased by 3.9% in September, while the open interest of Ethereum futures increased by 11.4%. In terms of futures trading volume, the trading volume of Bitcoin futures decreased by 20.2% in September, dropping to $481 billion.
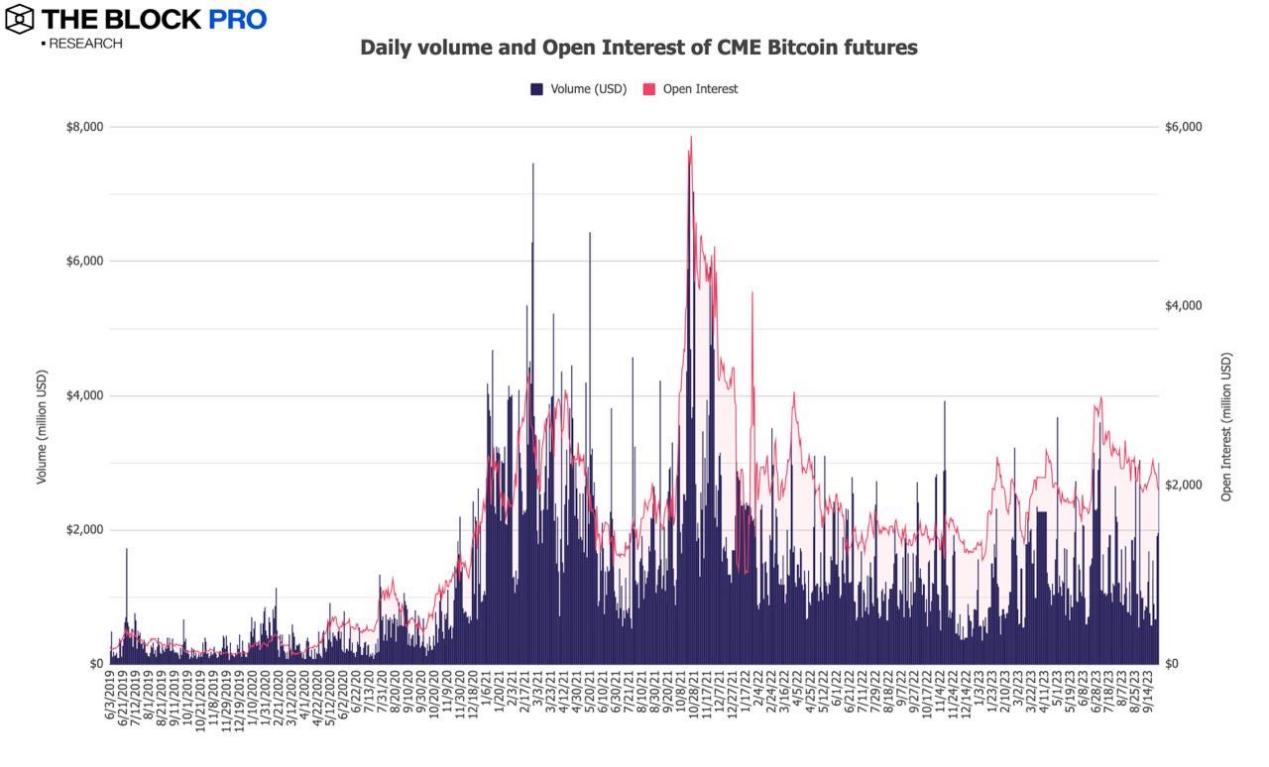
- The open interest of CME Bitcoin futures decreased by 12.8% in September, with the daily average volume dropping even more by 16% to approximately $1.15 billion.
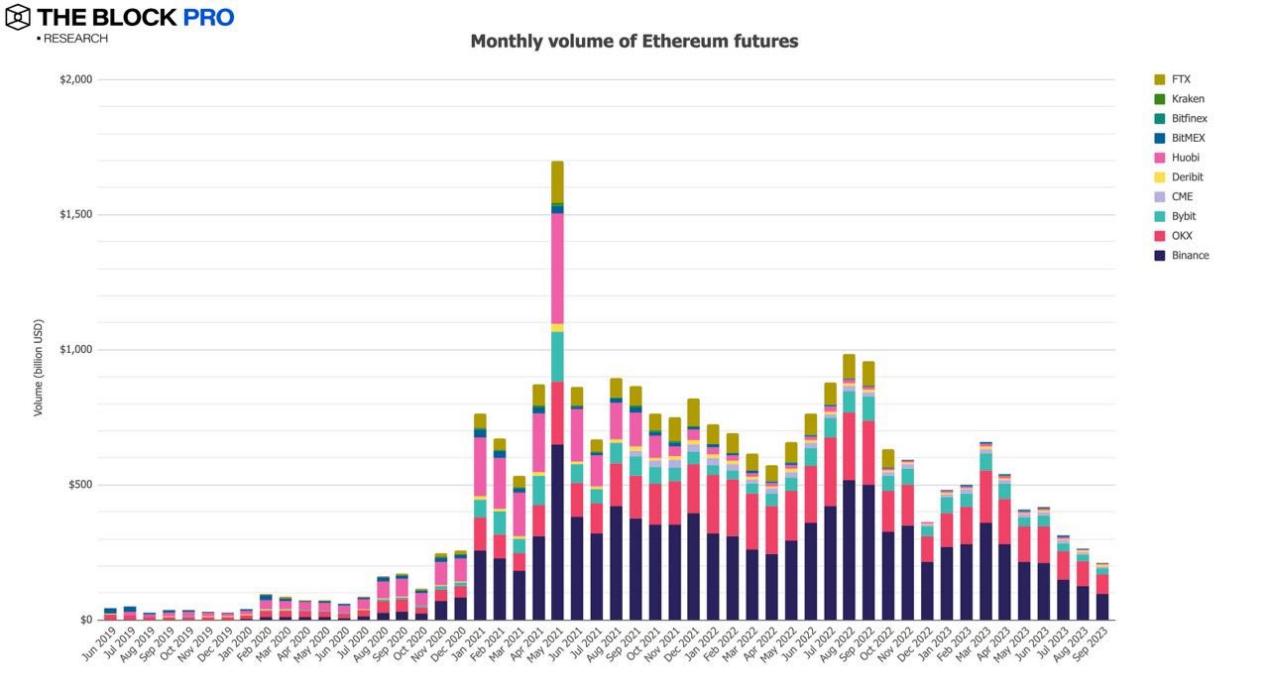
- The average monthly trading volume of Ethereum futures in September dropped to approximately $209.7 billion, with a decrease of 20.6%.
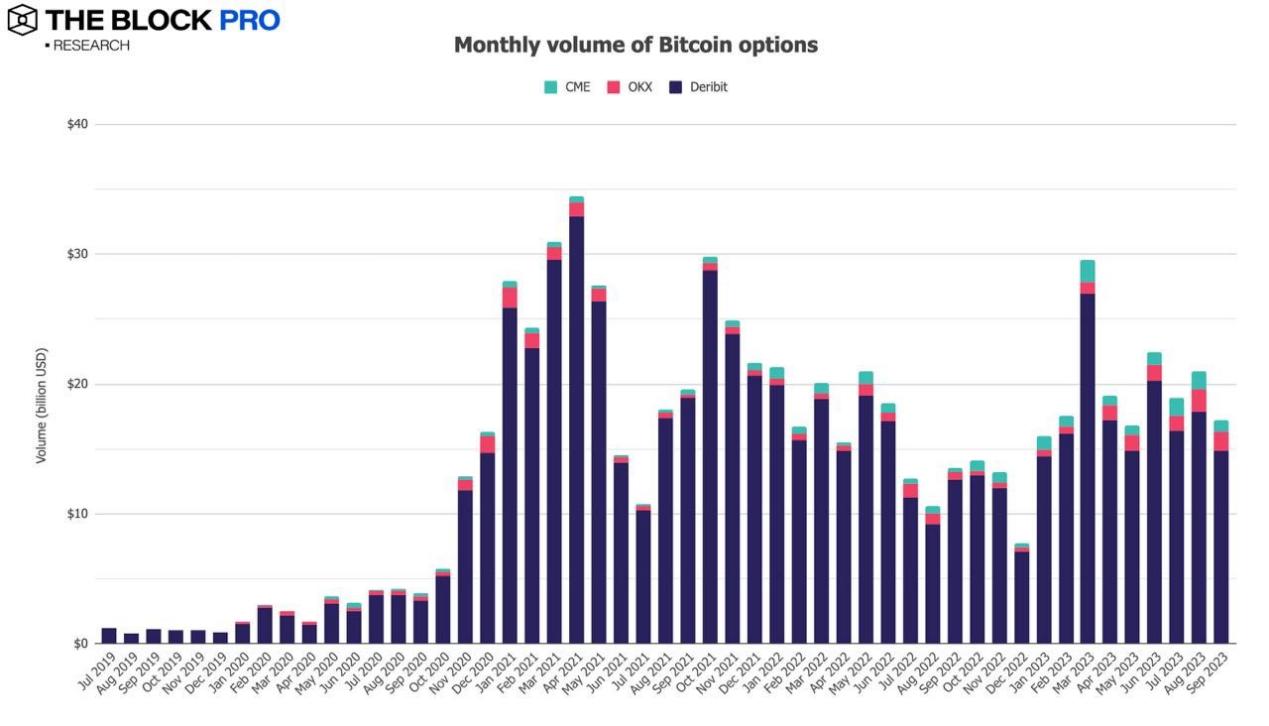
- In terms of cryptocurrency options, the open interest of Bitcoin and Ethereum options saw a general decline in September, with the open interest of Bitcoin options decreasing by 15.6% and the open interest of Ethereum options decreasing by 6.4%. In addition, in terms of options trading volume for Bitcoin and Ethereum, both saw a significant decrease in September, with the trading volume of Bitcoin options decreasing by 17.9% to $17.3 billion, and the trading volume of Ethereum options decreasing by 10% to $10.1 billion.
免责声明:本文章仅代表作者个人观点,不代表本平台的立场和观点。本文章仅供信息分享,不构成对任何人的任何投资建议。用户与作者之间的任何争议,与本平台无关。如网页中刊载的文章或图片涉及侵权,请提供相关的权利证明和身份证明发送邮件到support@aicoin.com,本平台相关工作人员将会进行核查。


