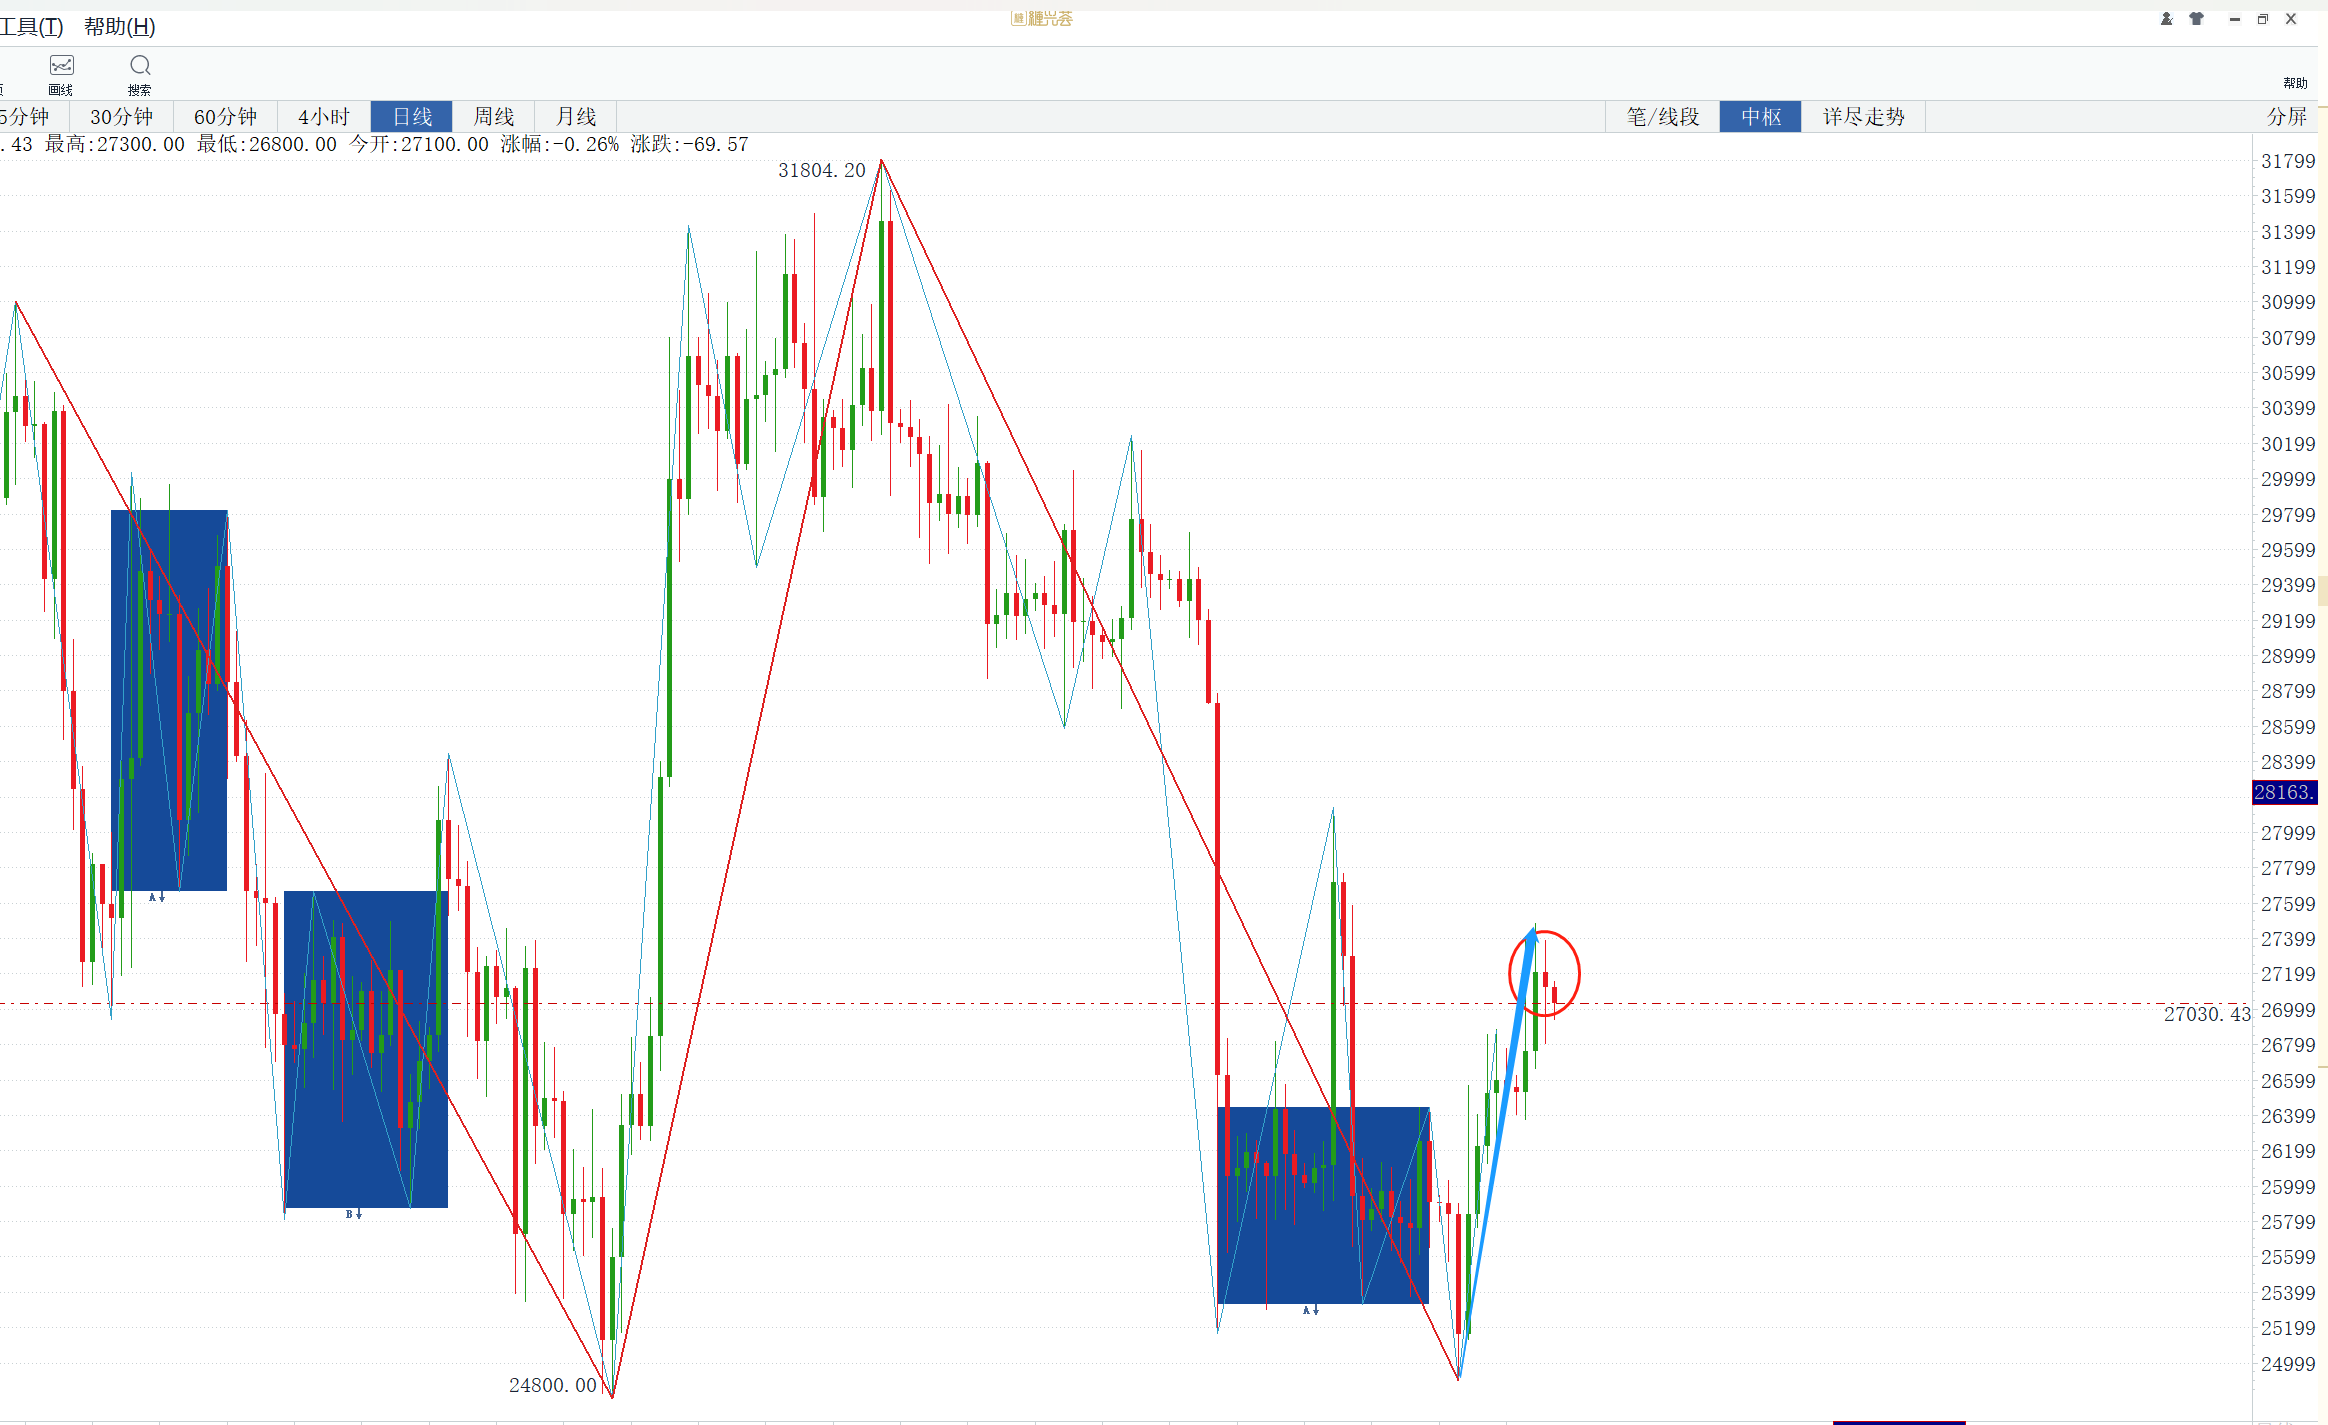
我们先从表象上看日线的一笔上,目前没出现顶分型,那么这一笔上暂时没有终结信号,当下要密切关注这一笔上顶分型何时确立,只有顶分型确立了一笔上才能有结束的可以能。
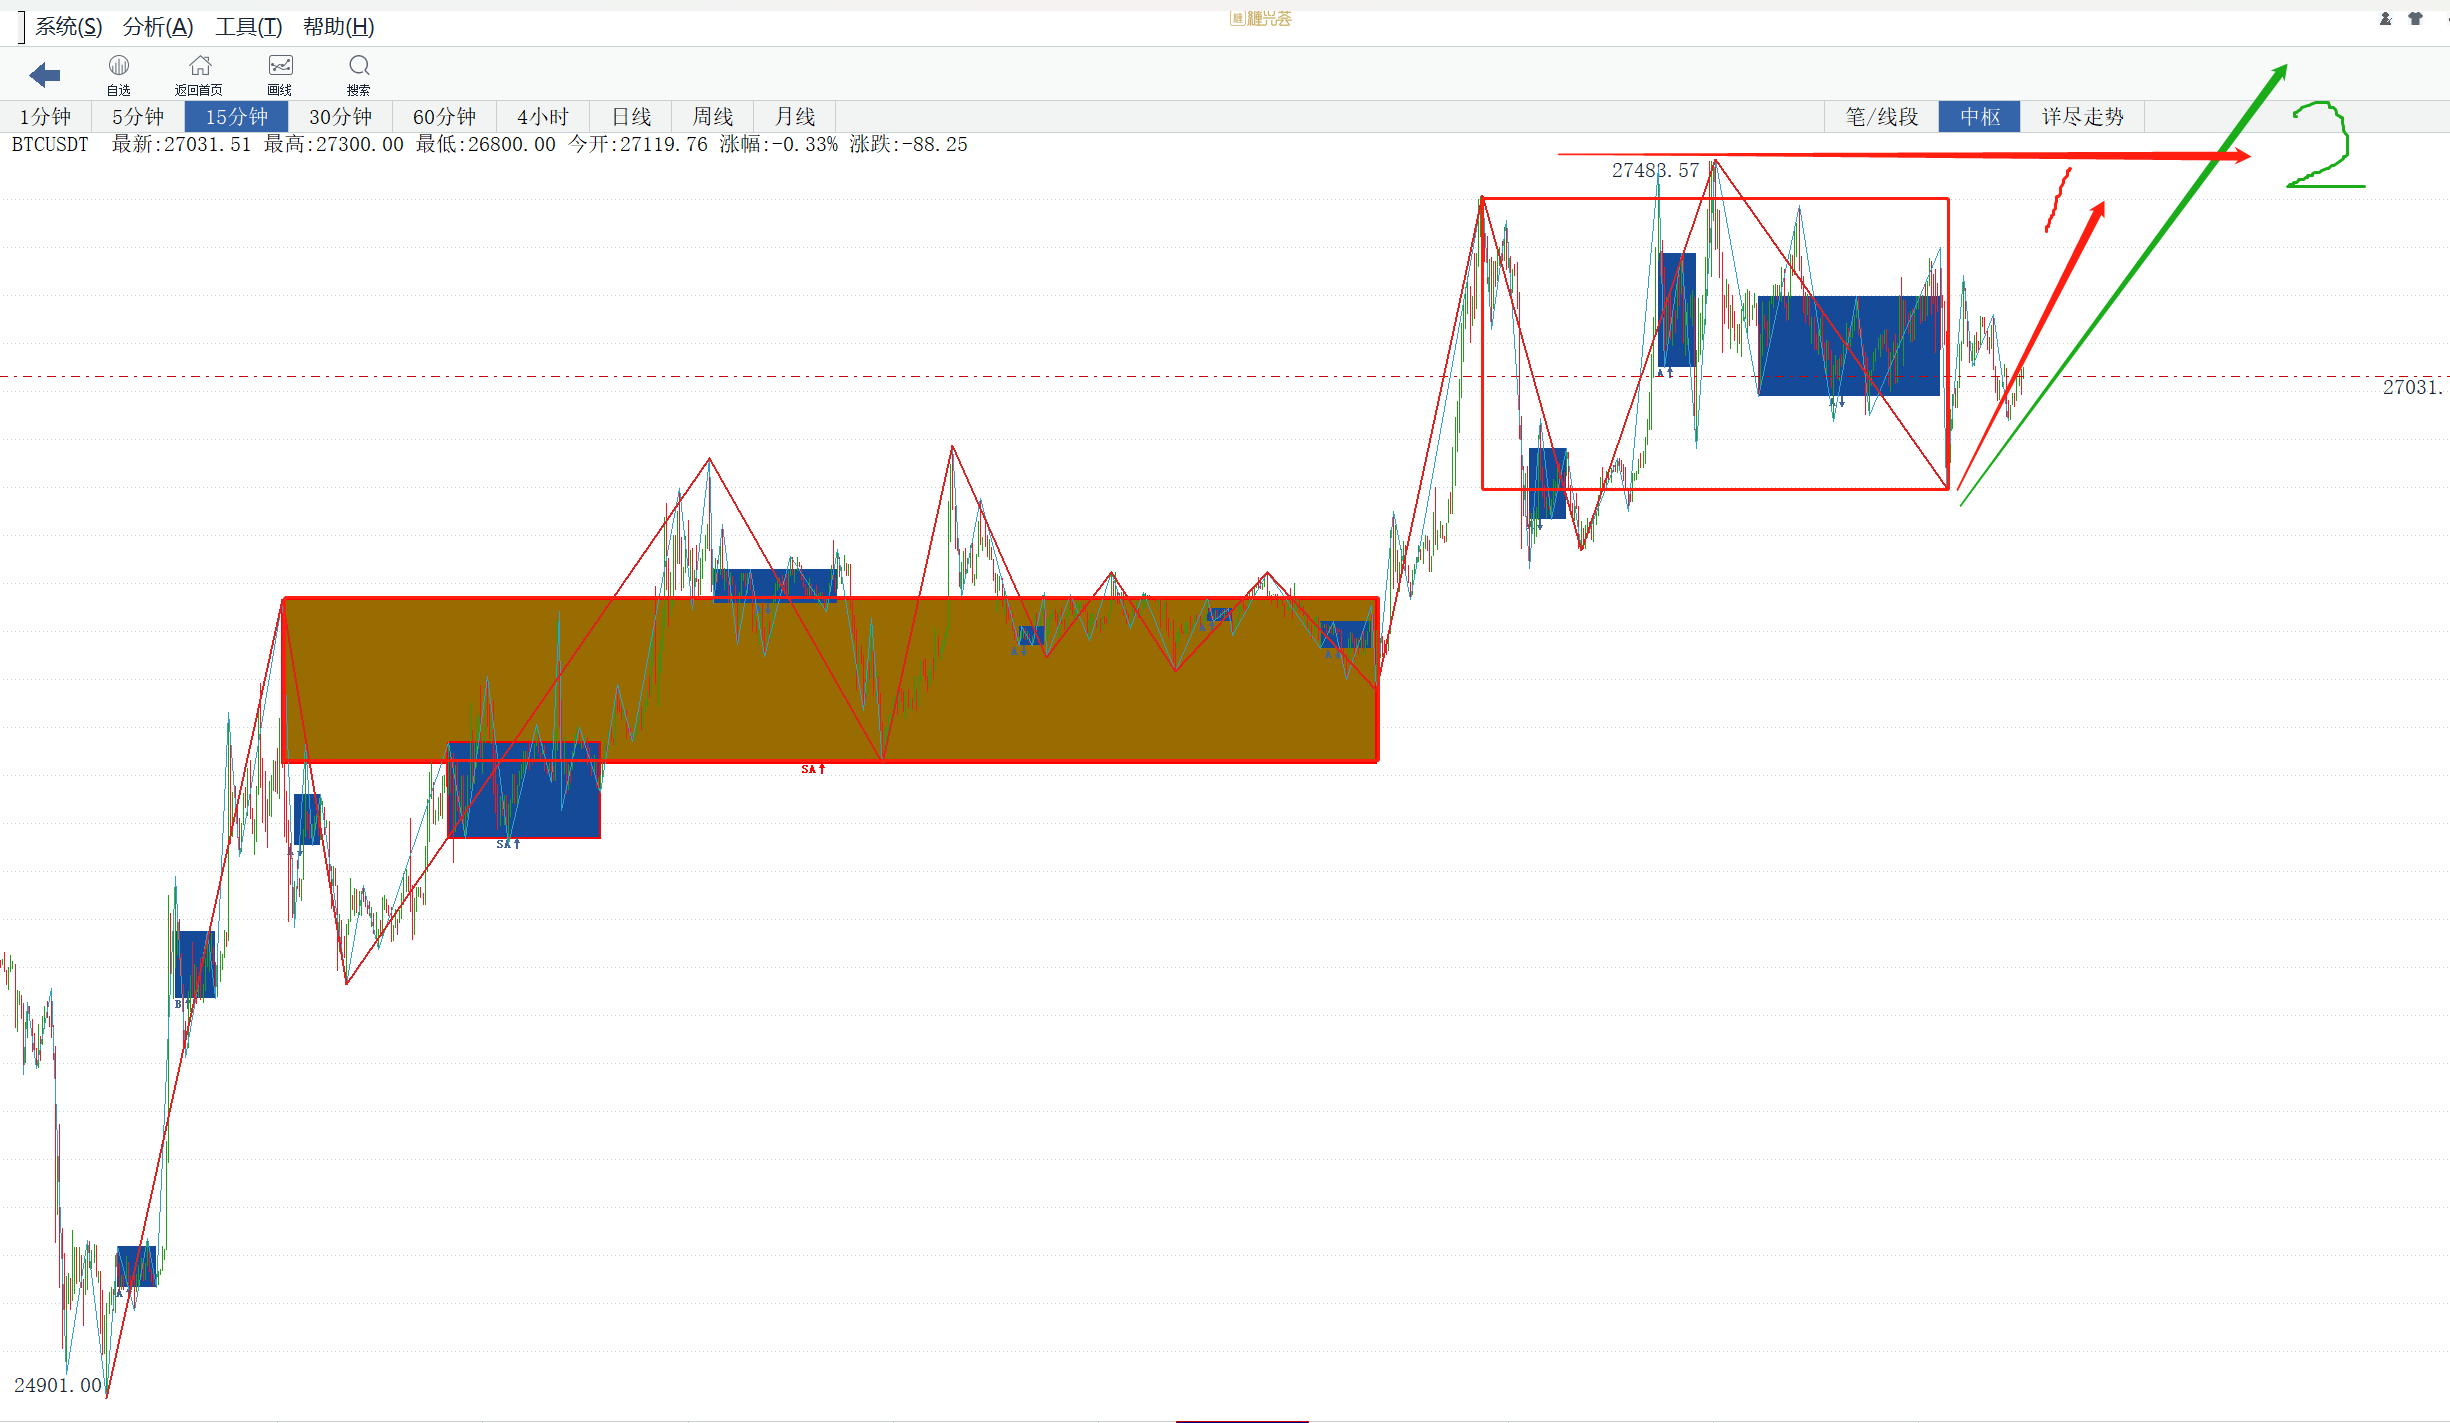
利用区间套继续到小级别观察:
15分钟在上面构筑第二个中枢,就要关注当下一段上的力度,
1.红色走势,如果不能打出新高,提防2卖,这里多单减仓布局空单;
2.绿色走势,多头强势破新高,此时看是否背驰,如果背驰多单依然减仓,防止15分走势类型的终结
当然最强的情况是破新高后不背驰,那么多单就先持有,看后续走势发展。
缠论不做预测,只对当下走势分类,做好预案。完全的跟随和应对。
免责声明:本文章仅代表作者个人观点,不代表本平台的立场和观点。本文章仅供信息分享,不构成对任何人的任何投资建议。用户与作者之间的任何争议,与本平台无关。如网页中刊载的文章或图片涉及侵权,请提供相关的权利证明和身份证明发送邮件到support@aicoin.com,本平台相关工作人员将会进行核查。