现在行情这两天来回上下洗盘会是牛市的终结吗,我的答案并不是,因为只要ETF通过后那么会有源源不断的资金进入市场。通过的时间应该是在年底或者明年3-4月份,现在对于整个金融市场来说都是比较萎靡的。加密市场也是如此。对于后市景财一直是一个看涨的思路,即便近期一直在经历调整,但并不影响年底或者明年的一波牛市的到来。
大多数情况下,底部的形成都是经历反复的吸筹与测试,尤其是在阶梯式震荡反弹的结构下更为明显,因为在熊市背景下,每波拉升都都大量的卖盘挂单,所以一直涨涨跌跌 不过只要价格在这轮反弹的50%之上运行,那么多头结构就是良好的,如果跌破那么可能会转弱,需要经历更久的低位震荡才会选择方向,我认为下周一定会先去选择向上突破。大概就是5天的时间
那么我们回归到行情趋势上面来。昨天行情从25700附近开始砸盘到最低25300附近,快速反弹到26050附近后半夜又回调到25700附近。那么现在短期如何去看待,大幅度回调后,目前行情需要一段时间去修复。修复的这段时间就会是震荡,震荡完后再次选择方向跌破去到之前低点25000附近下去再快速拉升的可能性,还有一种就是直接是昨天回踩探结束。我是认为会震荡后开始慢慢的突破,然后再快速的拉升,让很多人都来不及去上车。这个一般都是狗庄的想法。所以我强调依旧看多,回调都是短暂的回调。持有现货的都可以放心拿着,高位减仓低位买进去就可以了。特别是好的点位。。再我看来所有的回调来看都是正常的去洗筹码然后等待时机加速向上。
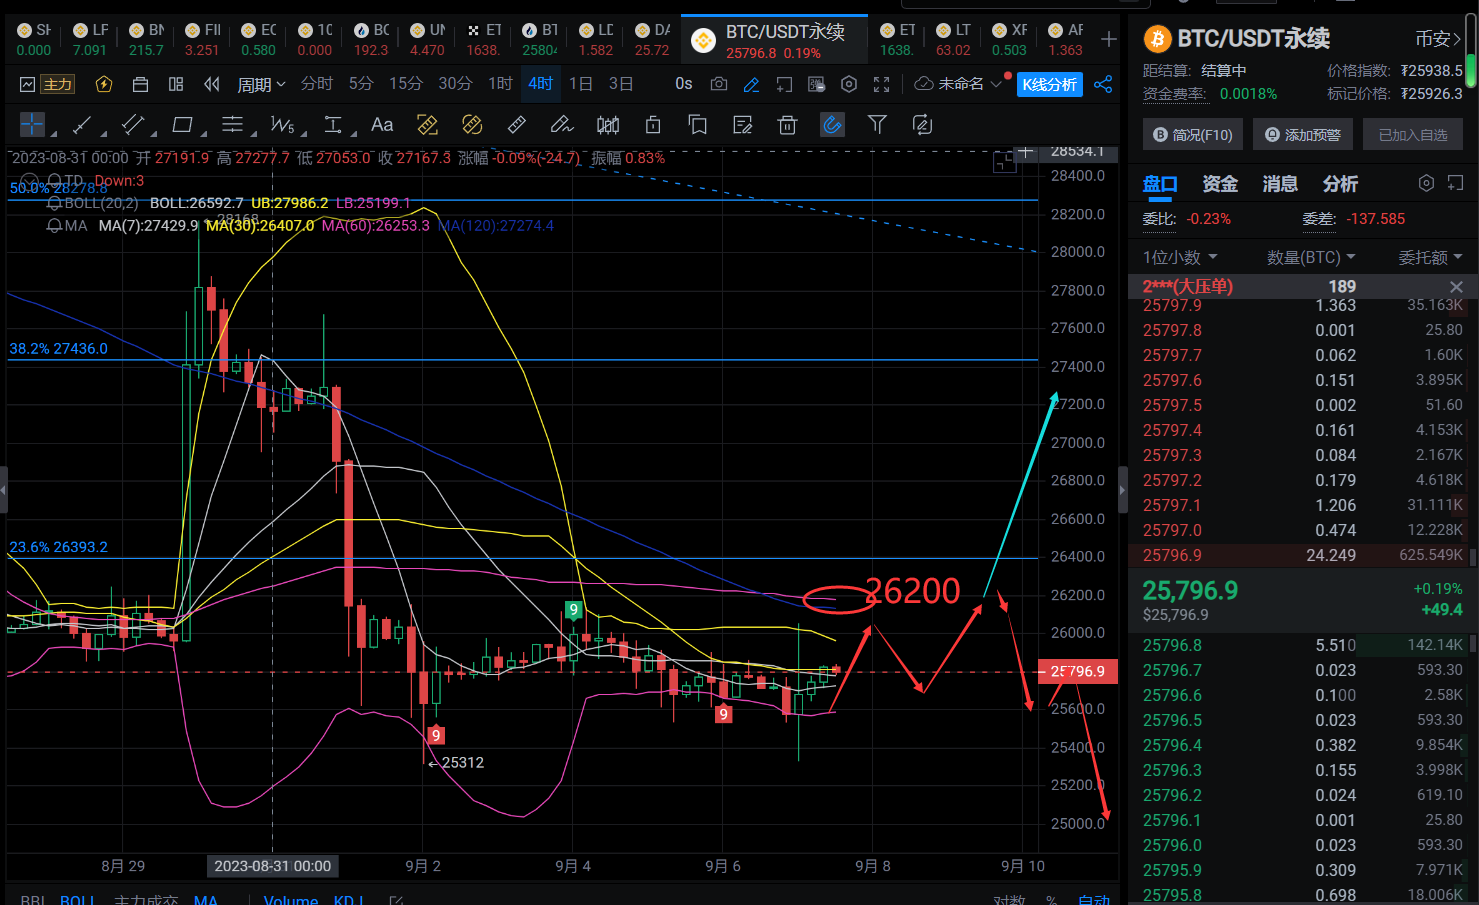
从日线级别来看昨天收了十字星也就是正好这几天震荡区间25300-26150之间。布林带中轨附近在26167附近。这里也是比较关键的地方。看这里能不能站稳,布林带缓慢往向上运行,短期压力位就在这26200附近。
从4小时级别来看,布林带开口向下修复运行的趋势,布林带中轨在25770附近,短期修复行情在这里上下来回徘徊,MACD快速向下运行。KDJ三线形成金叉运行的迹象。
BTC关注:
短多方向:25000-25500多,止损24850,止盈看26000-26500-27000
短空方向:26000-26200空,止损26300,止盈看25700-25500-25300
在这个市场上,不缺老师,不缺分析,更不缺操作建议,唯一缺的是一颗真诚朴实,为你做市场分析的心。我这里没有华丽的盈利截图,没有承诺你百分之多少的收益,只有本分做人做事的心。如果你一直处于亏损做单不顺,想跟着景财懒人方式,可关注景财说趋势,行情变化太快试着与景财沟通,我每天的分析思路,可以供你参阅。做单合理控制好仓位,切勿重仓或满仓操作个人观点供参考,投资有风险,风险自负!
免责声明:本文章仅代表作者个人观点,不代表本平台的立场和观点。本文章仅供信息分享,不构成对任何人的任何投资建议。用户与作者之间的任何争议,与本平台无关。如网页中刊载的文章或图片涉及侵权,请提供相关的权利证明和身份证明发送邮件到support@aicoin.com,本平台相关工作人员将会进行核查。


