Hello, everyone, I am your familiar Jingcai. Currently, Bitcoin has experienced a long period of oscillation from March to September, which is relatively rare in history. After experiencing a year-long bull market from last year to now, is the bear market coming? From these perspectives:
First, in terms of the overall direction, Bitcoin has risen from over 10,000 points to over 70,000 points. It has gone through a long period of more than a year, which can be considered as the completion of the fifth wave. It may go up one more time before starting to decline further. In terms of time, I believe that we are now at the end of the bull market and the beginning of the bear market.
Returning to the market trend, BTC is currently oscillating around 58,000. The market is unpredictable, and the support below is around 55,000-56,000. The MA120 moving average has broken through at 63,500. If it cannot go up again, it will be very difficult for the bull market to continue. We should focus on whether it can stand above this level after going up later.
Looking at the daily chart, after a large bearish candle, it is likely to continue to test the support below. The middle track of the Bollinger Bands is around 60,000. We also need to see if it can stay above 60,000 and the MA120 moving average at 63,500 on the daily chart.
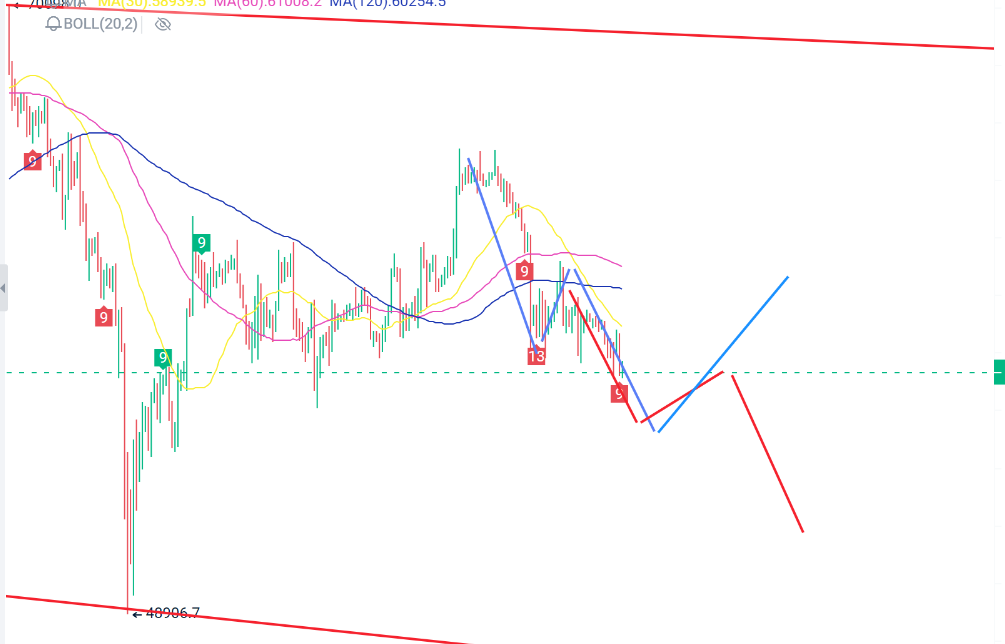
Looking at the 4-hour chart, the Bollinger Bands are slowly moving downward, with the middle track around 58,600, and the MACD is also moving downward. The KDJ three lines have formed a dead cross and are trending downward.
From a technical perspective, the overall trend is still bearish.
BTC focus: The first time any trading point is reached is valid and should yield at least 500 points of profit. Trade cautiously.
Short bullish direction: Long at 55,000-56,000, stop loss at 54,850, take profit at 58,000-59,000-60,000.
Short bearish direction: Short at 59,000-60,000, stop loss at 60,300, take profit at 58,000-57,000-56,000.
Wait for direction.
Bearish direction: 59,500-60,000.
In this market, there is no shortage of teachers, analysis, or trading recommendations. The only thing lacking is a sincere and honest heart to provide market analysis for you. I don't have fancy profit screenshots or promises of a certain percentage of returns. I only have a heart to do things honestly. If you have been consistently losing money and want to follow Jingcai's lazy approach, you can add Jingcai to discuss trends below. The market changes too quickly, so try to communicate with Jingcai. My daily analysis train of thought can be used for your reference. Trade reasonably and control your position properly. Do not over-leverage or go all in. This is a personal opinion for reference only. Investment carries risks, and you are responsible for your own risks!

免责声明:本文章仅代表作者个人观点,不代表本平台的立场和观点。本文章仅供信息分享,不构成对任何人的任何投资建议。用户与作者之间的任何争议,与本平台无关。如网页中刊载的文章或图片涉及侵权,请提供相关的权利证明和身份证明发送邮件到support@aicoin.com,本平台相关工作人员将会进行核查。


