The selling pressure is significantly weakening.
Author: UkuriaOC, CryptoVizArt, Glassnode
Translation: Tao Zhu, Golden Finance
Abstract
- After experiencing a fairly long distribution period at the ATH, a period of cooling and consolidation has begun, and the selling pressure is significantly weakening.
- In addition to the weakening of selling activity, capital inflows remain relatively moderate, although still profit-driven, and sufficient to stimulate local price trends.
- During this adjustment process, various volatility indicators have been compressed as on-chain conditions have reached a balance, often leading to larger-scale market fluctuations.
Slowing supply side
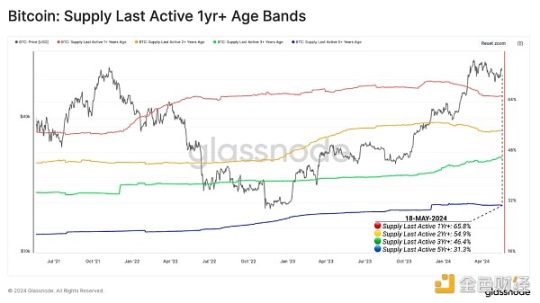
A strong Bitcoin market naturally attracts selling pressure, as price increases prompt long-term holders to distribute a portion of their holdings. We can see this through the significant decrease in supply over the entire period of March and April, as seen in the 1-2 year supply, as long-term investor groups distribute tokens to meet the new demand before the ATH.
However, the supply held by investors of 3 years or more continues to increase, indicating that this group typically waits for price increases before selling their tokens. As of the writing of this article, over half of Bitcoin holders have not conducted on-chain transactions in the past two years or longer.
Final active supply over 1 year: 65.8% (red)
Final active supply over 2 years: 54.9% (yellow)
Final active supply over 3 years: 46.4% (green)
Final active supply over 5 years: 31.3% (blue)
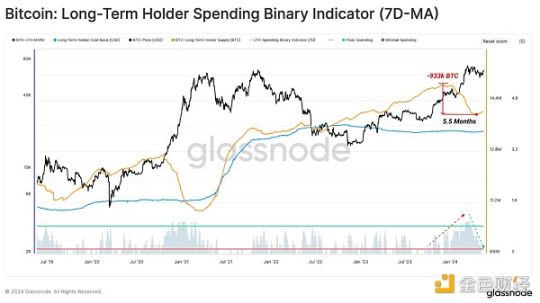
The Long-Term Holder (LTH) binary spending index is another tool we can use to analyze and visualize the strength of holder distribution pressure. We noticed that in March, the LTH supply decreased significantly to $73,000 at the ATH.
However, in the past few weeks, this distribution pressure has significantly eased, providing more breathing space for the bulls, and overall resistance is lower.
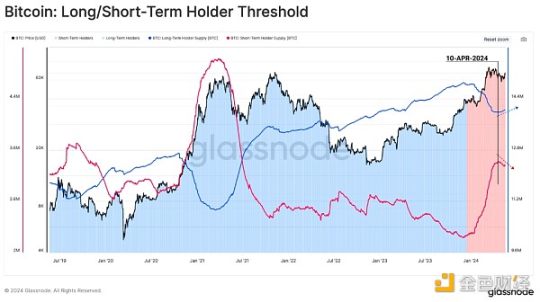
On the other hand, the supply held by Short-Term Holders (STH) has sharply increased, representing new investors who recently purchased tokens.
The divergence between LTH and STH Supply is exacerbating the situation where distribution pressure from mature investors is cooling down.
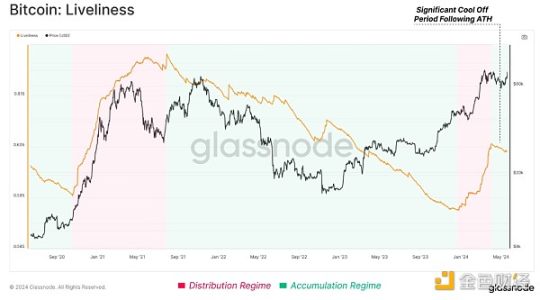
The activity indicator also reflects this change in market characteristics, indicating that the Bitcoin network's daily creation of Bitcoin exceeds its destruction. In other words, the market now tends to hold tokens for the long term rather than actively distributing them for profit.
Demand remains moderate
The realized cap is a unique on-chain metric that measures the cumulative dollar liquidity of "storage" in the asset class. Currently, its value is $574 billion.
Currently, as the market digests the recently distributed supply, the speed of new capital inflows into the Bitcoin network has significantly slowed from its peak.
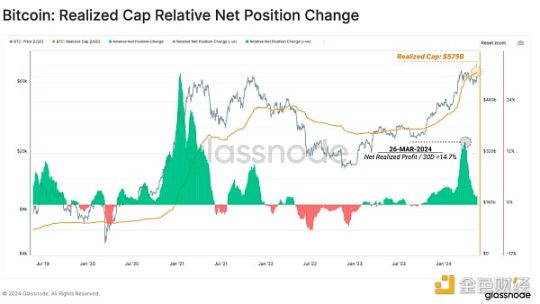
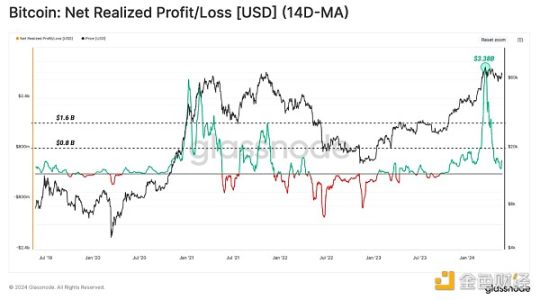
Therefore, the daily change rate of the realized cap can be used as a measure of capital inflow. The liquidity injected during the ATH period was very intense, eventually reaching $3.38 billion per day, surpassing the peak of the 2021 bull market, and has since cooled down significantly.
Currently, this metric is still in the positive profit-driven zone and is returning to a balanced state. However, with the weakening selling pressure from mature investors, this moderate demand is sufficient to stimulate price trends.
Volatility compression
With the easing of supply-side pressure and capital inflows, we turn to our volatility tools to lay the groundwork for our expectations of the next trend.
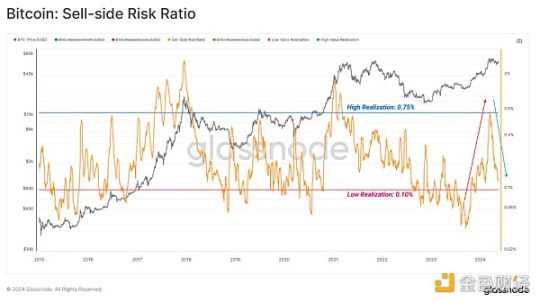
For this, we can use the spent output profit ratio (SOPR) indicator, which evaluates the total value of locked tokens spent on-chain (realized profit + realized loss) in relation to the size of the asset class (realized cap).
- A high value indicates that investors are spending tokens with a relatively large profit or loss compared to their cost basis. This situation suggests that the market may need to find a new balance and typically leads to high volatility price changes.
- A low value indicates that the spending of most tokens is relatively close to their breakeven cost basis, indicating that a certain degree of balance has been reached. This situation typically means that the "profit and loss" within the current price range is exhausted and usually describes a low-volatility environment.
We can see that the SOPR has significantly decreased in recent weeks, indicating that the market has found a certain degree of balance during this adjustment process.
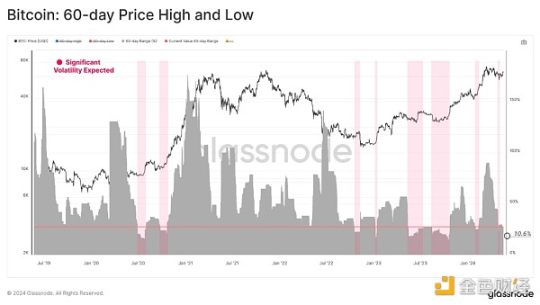
We can also evaluate market volatility by the percentage range between the highest and lowest price changes in the past 60 days. According to this indicator, volatility continues to compress to levels typically seen after a long period of consolidation and before significant market fluctuations.
Tracking excessive investment
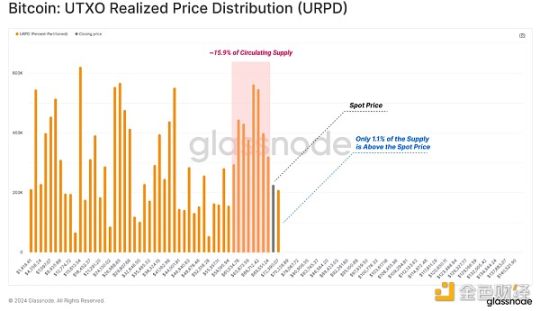
Finally, we can use the URPD indicator to evaluate the density of tokens around the current spot price. We use this concept to determine sensitive points in the market, where market trends may trigger a significant response from investors.
As the price moves towards the end of distribution, we note that approximately 15.9% of the token supply is slightly below the current spot price, which may provide strong support.
In contrast, only 1.1% of the circulating supply is still above our current spot price, indicating that continued inflows of demand may catalyze a period of price discovery.
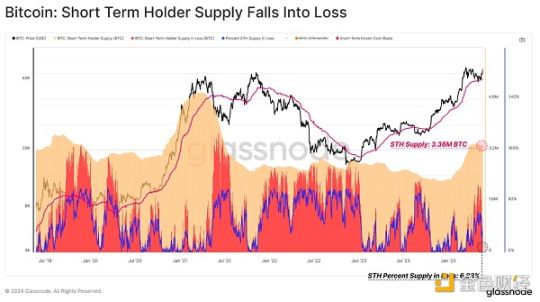
The STH supply is currently 3.36 million BTC, and during the recent adjustment period, over 2.14 million BTC fell into unrealized losses (63.2%). However, as the market rebounded to over $70,000, this number has dropped to only 230,000 BTC, accounting for about 6.8% of the total supply.
This indicates that while tokens are highly concentrated around the current spot price, there are few tokens with unrealized losses, significantly reducing the risk of excessive investment.
Conclusion
After mature investors distributed a large amount at the $73,000 ATH, selling pressure has significantly decreased. This has led to reduced resistance on the upside, allowing even moderate demand to stimulate positive price trends.
In addition, volatility continues to compress over a longer time frame, while a dense supply cluster has formed below the current spot price, potentially providing a solid foundation.
免责声明:本文章仅代表作者个人观点,不代表本平台的立场和观点。本文章仅供信息分享,不构成对任何人的任何投资建议。用户与作者之间的任何争议,与本平台无关。如网页中刊载的文章或图片涉及侵权,请提供相关的权利证明和身份证明发送邮件到support@aicoin.com,本平台相关工作人员将会进行核查。


