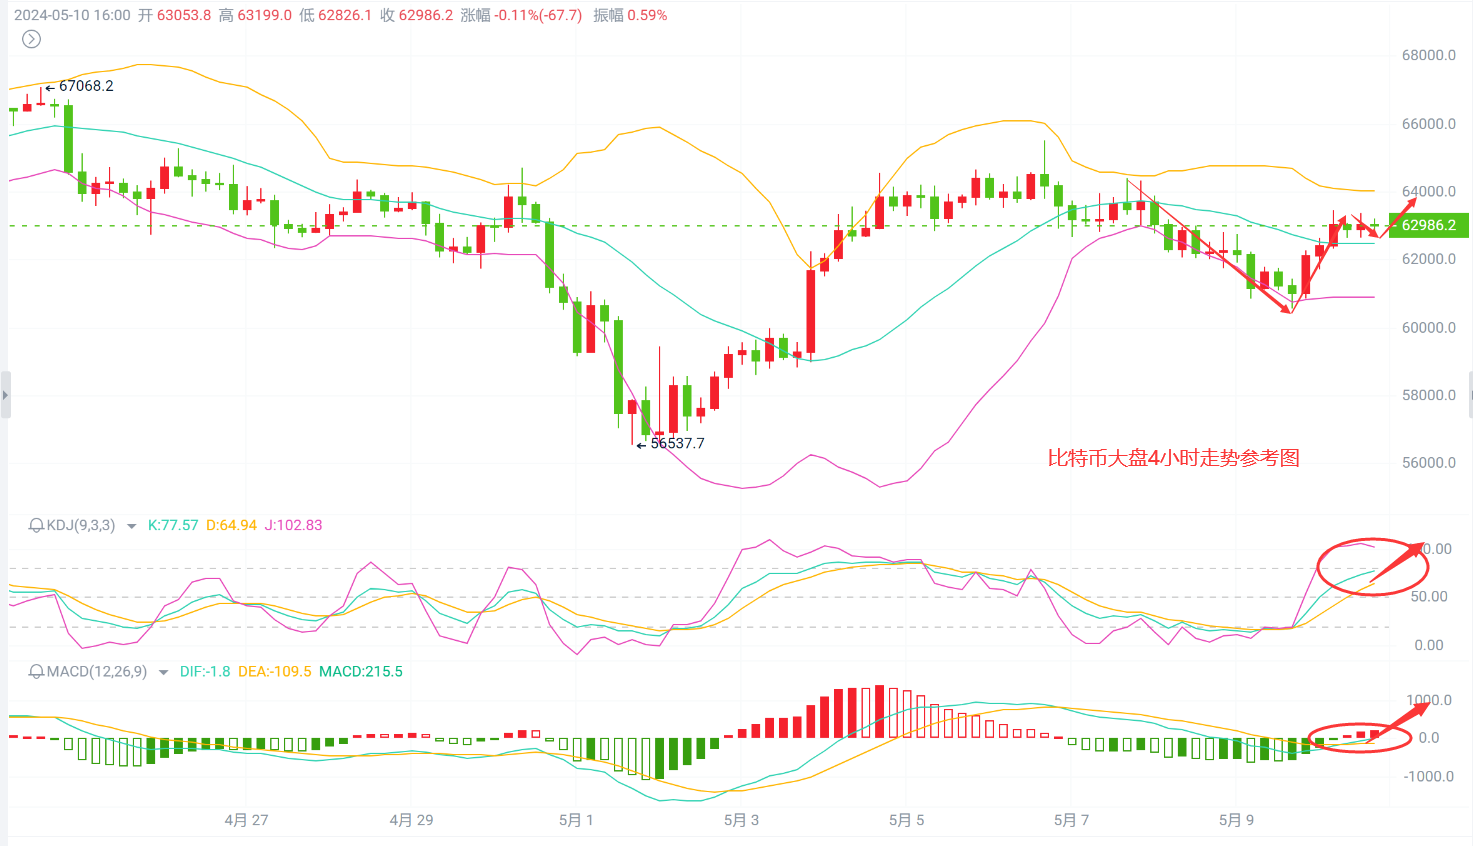
Bitcoin/Ethereum daily chart, the current MACD and KDJ indicators tend to be flat and oscillating. In the BOLL, the short-term coin price has rebounded to near the midline. In the short term, it depends on whether the midline can be effectively broken through. Looking at the 12-hour chart, the MACD and KDJ indicators tend to oscillate upwards, but the high point MA30 still maintains downward pressure, indicating the presence of dense short positions. On the 4-hour chart, after the price gradually rebounded following a decline, the bullish volume continued to be released, and the moving averages showed consistent upward trends. In the short term, the oscillation stabilized. For the short-term intraday, I personally expect the coin price to mainly oscillate sideways with a slight rebound. I suggest a retracement long strategy for short-term operations. Specific points can be referred to:
Bitcoin: Long at 62800-62300, target 64500
Ethereum: Long near 3020-2980, target 3100
The above is my personal evening market analysis, for reference only. For those who are uncertain about trend and entry points in future operations, you can follow "Public Account: Trend Analysis by Mufeng" for learning and discussion together!

免责声明:本文章仅代表作者个人观点,不代表本平台的立场和观点。本文章仅供信息分享,不构成对任何人的任何投资建议。用户与作者之间的任何争议,与本平台无关。如网页中刊载的文章或图片涉及侵权,请提供相关的权利证明和身份证明发送邮件到support@aicoin.com,本平台相关工作人员将会进行核查。


