Daily Sharing
The pullback of the BTC on the 1-hour chart has successfully retraced to around 62000. Currently, we need to pay attention to whether it will hold here and initiate the third rebound on the 1-hour chart. If the short-term rebound continues to fail, we need to consider whether it will retrace further to around 60000.
BTC
Due to the rapid changes in the market, this article can only make predictions about the market changes at the time of publication. Short-term players should pay attention to the latest market changes and use this information as a reference only.
1H:
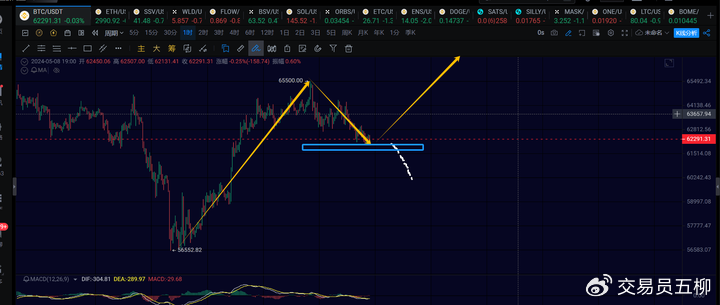
On the 1-hour chart, the current pullback has reached around 62000, meeting our expectations. Currently, we need to focus on the support in the 61500-62000 range. If 61500 does not hold, the 1-hour pullback may extend to around 60000.
Of course, personally, I expect the support in the 61500-62000 range to hold, and then initiate the third rebound on the 1-hour chart towards 66000 or 67000, as indicated by the yellow arrow in the image above. Further observation is needed.
15M:
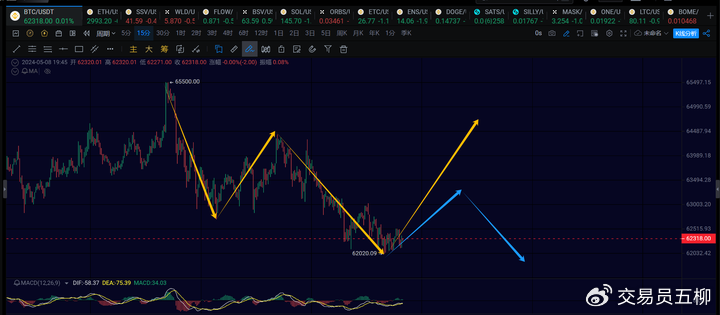
On the 15-minute chart, it should start a 15-minute rebound. Whether it can initiate the 1-hour rebound needs to be observed based on the strength of the short-term 15-minute rebound. If the 15-minute rebound can break through 64422 again, BTC is likely to start the third 1-hour rebound towards 66000 or 67000.
If the 15-minute rebound fails to break through 64422, it needs to be considered that BTC may form a 15-minute consolidation and continue to extend downwards, as indicated by the blue arrow in the image above. In this case, the 1-hour decline may extend to around 61500-62000 or even break through 61500 to around 60000.
ETH
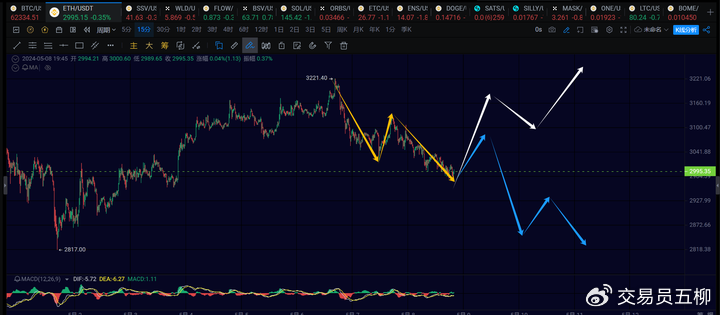
There is a certain divergence in the current trend of Ethereum. In fact, when analyzing the market earlier, it was believed that Ethereum's previous 4-hour decline structure lacked a 1-hour pullback to retest around 2800. However, due to the rebound of BTC in the past few days, Ethereum's rebound strength is still considerable. Therefore, it is inclined to believe that Ethereum is also initiating a new 4-hour rebound these days.
Currently, the strength of Ethereum's retracement has reached the 0.618 level of the rebound. If 2950 cannot hold or cannot break through 3130 again, Ethereum's 1-hour pullback may continue to extend to around 2818, as indicated by the blue arrow in the image above.
To avoid the trend indicated by the blue arrow, the next 15-minute rebound of Ethereum needs to break through 3130 as soon as possible. Currently, on the 15-minute chart, it is about to start a 15-minute rebound, so close attention should be paid to the strength of the rebound.
Trend Direction
Weekly Chart: Upward direction, currently continuing the rebound from 15476, pay attention to the subsequent daily chart situation for when it will end.
Daily Chart: Upward direction, it's almost time to see a new upward trend on the daily chart, with a target of 85000.
4-hour Chart: Upward direction, BTC is still expected to see a new 4-hour upward trend, but there is a possibility of a double bottom. Currently, it is still necessary to pay attention to the strength of the short-term rebound.
1-hour Chart: Downward direction, currently paying attention to whether the 1-hour rebound can be initiated successfully. If not, be aware that the 1-hour pullback may extend.
15-minute Chart: Upward direction, if the short-term rebound can break through 64422, the 1-hour rebound can be initiated. If it cannot break through, pay attention to the possibility of further pullback.
Feel free to follow my public account for further discussion and exchange:

This article is time-sensitive, pay attention to the risks, the above is only personal advice, for reference only!
免责声明:本文章仅代表作者个人观点,不代表本平台的立场和观点。本文章仅供信息分享,不构成对任何人的任何投资建议。用户与作者之间的任何争议,与本平台无关。如网页中刊载的文章或图片涉及侵权,请提供相关的权利证明和身份证明发送邮件到support@aicoin.com,本平台相关工作人员将会进行核查。


