2024.05.06 Monday

How to View the Trend of This Week After the Weekend Oscillation?

① 22:00 Global Supply Chain Pressure Index for April in the United States
② Speech by Federal Reserve's Barkin at 00:50 the next day
③ Speech by Federal Reserve's Williams at 01:00 the next day

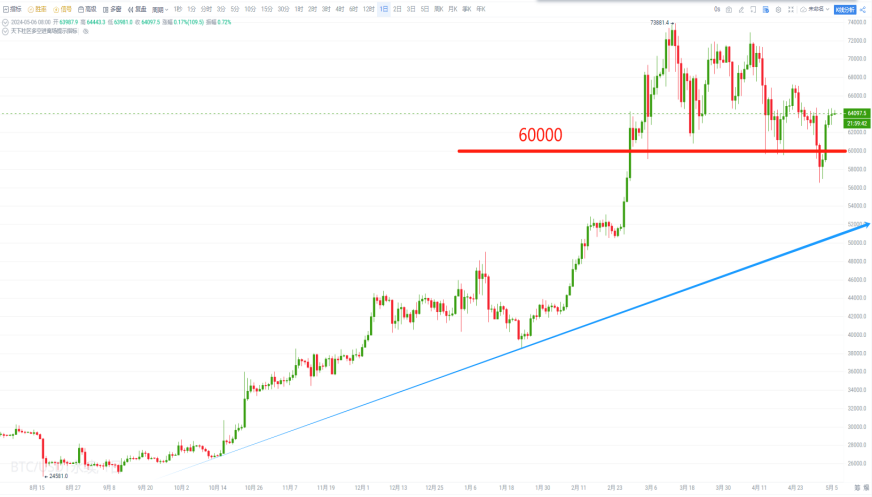
- Daily Chart: After the price broke below the 60,000 support level and returned above it, there is still a trend of continued upward movement if the subsequent pullback does not break this level.
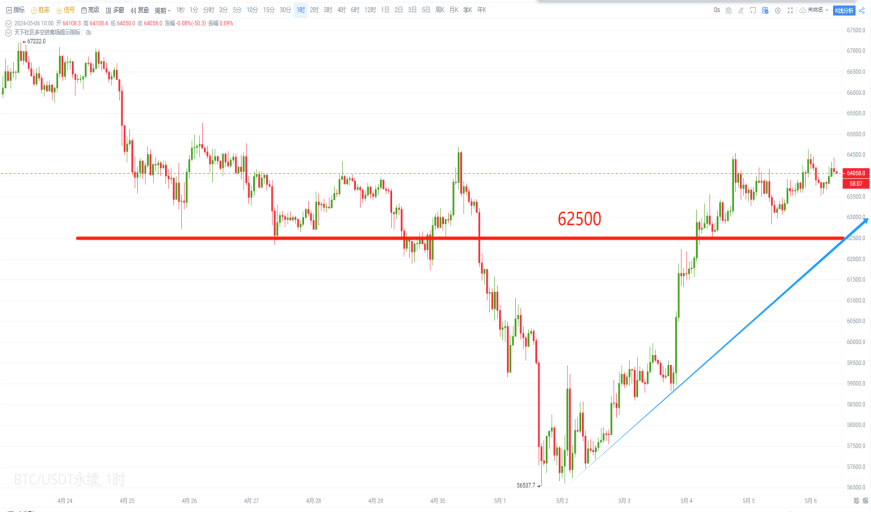
- 1-hour chart: After a short-term breakthrough above the 62,500 support level, there was some oscillation. If the subsequent pullback does not break this support, there is still a trend of continued upward movement.
II. Ethereum
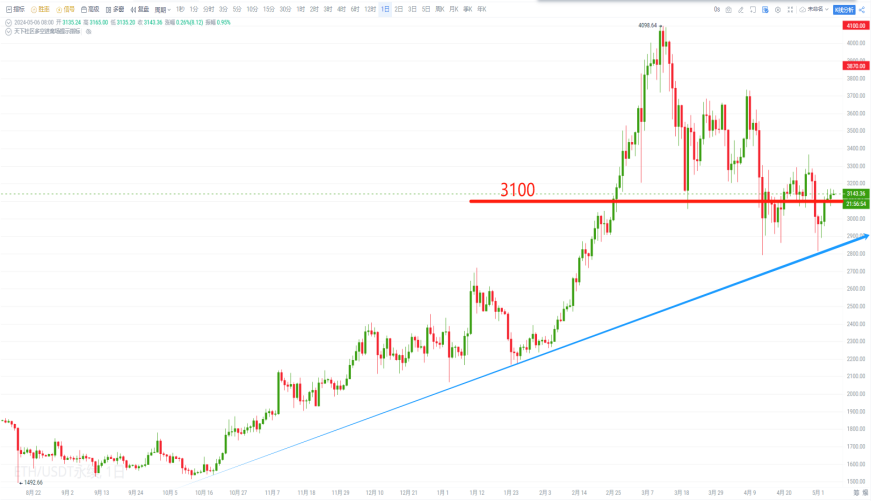
- Daily Chart: After breaking below the 3,100 support level, there was some oscillation. If the subsequent oscillation does not break this support, there is still an upward trend.
- 1-hour chart: After a short-term breakthrough above the 3,080 support level, there was some oscillation. If the subsequent pullback does not break this support, there is still a trend of continued upward movement.


I. Bitcoin
- Yesterday's Viewpoint:
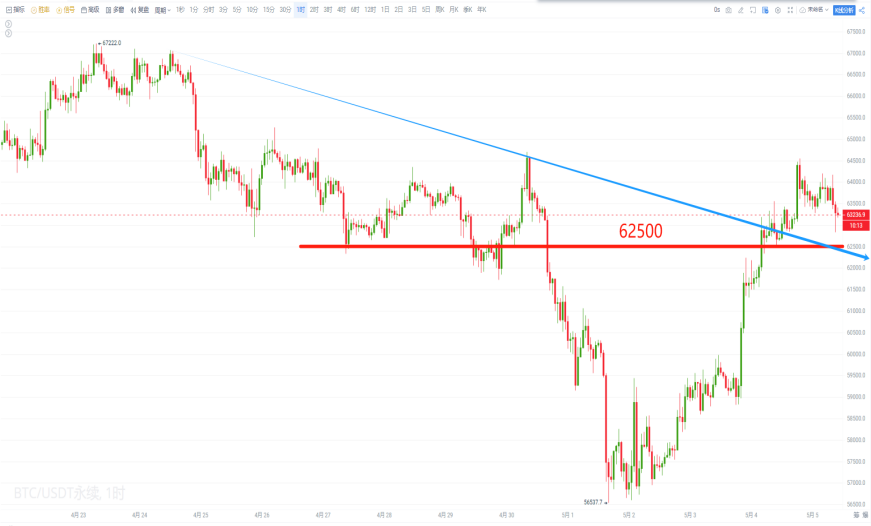
Summary: After a short-term breakthrough above the 62,500 support level, there was a pullback. If the subsequent pullback does not break this support, there is still a trend of continued upward movement. The upper resistance is at 65,700 and 68,500; if it breaks below, it will once again enter a pullback trend, with the lower support at 60,000 and 57,660.
- Subsequent Trend:

The subsequent trend maintained oscillation after the pullback did not break the 62,500 support level, reaching a high of 64,644.
II. Ethereum
- Yesterday's Viewpoint:

Summary: After a short-term breakthrough above the 3,060 support level, there was a pullback. If the subsequent pullback does not break this support, there is still a trend of continued upward movement. The upper resistance is at 3,200 and 3,350; if it breaks below, it will once again enter a pullback trend, with the lower support at 2,960 and 2,840.
- Subsequent Trend:

The subsequent trend maintained oscillation after the pullback did not break the 3,060 support level, reaching a high of 3,171.

I. Bitcoin
Summary: After a short-term breakthrough above the 62,500 support level, there was some oscillation. If the subsequent pullback does not break this support, there is still a trend of continued upward movement. The upper resistance is at 65,700 and 68,500; if it breaks below, it will once again enter a pullback trend, with the lower support at 60,000 and 57,660.
II. Ethereum
Summary: After a short-term breakthrough above the 3,080 support level, there was some oscillation. If the subsequent pullback does not break this support, there is still a trend of continued upward movement. The upper resistance is at 3,200 and 3,350; if it breaks below, it will once again enter a pullback trend, with the lower support at 2,960 and 2,840.


Join the community to enjoy the following services:
Morning video explanation updated daily;
Daily updated text and image viewpoints;
Technical indicator analysis and answers in the group;
Layout of long and short strategies in the medium and long term;
High-winning short-term trading strategies for the day;
Trading system long and short signals reference software authorization;
Enjoy lower transaction fees by joining the community for practical combat;
One-on-one or one-on-many guidance and answers (by appointment);
Multiple learning courseware packages to bid farewell to incomprehension;
Multiple analysts (lecturers, practical teachers) guide you through the world of cryptocurrency, with seven live courses daily
(Service content is continuously updated…)


免责声明:本文章仅代表作者个人观点,不代表本平台的立场和观点。本文章仅供信息分享,不构成对任何人的任何投资建议。用户与作者之间的任何争议,与本平台无关。如网页中刊载的文章或图片涉及侵权,请提供相关的权利证明和身份证明发送邮件到support@aicoin.com,本平台相关工作人员将会进行核查。


