The Federal Reserve Rules Out Future Rate Hikes
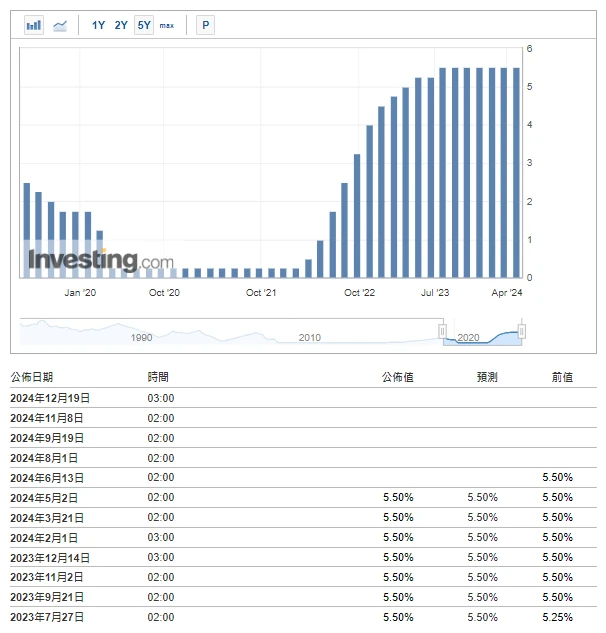
Data Source: https://hk.investing.com/economic-calendar/interest-rate-decision-168
The Federal Reserve ended a two-day interest rate meeting on Wednesday (May 1), maintaining the federal funds rate target range at 5.25 basis points to 5.5 basis points, in line with market expectations. Federal Reserve (Fed) Chairman Powell stated that the inflation data so far this year has not provided enough confidence for Fed officials to take measures to cut interest rates, and it may need "longer than previously expected," but ruled out the possibility of future rate hikes.
The market is very receptive to Powell's dovish stance, with U.S. bond yields falling and U.S. stocks sharply rising, while the price of Bitcoin surged and then stabilized after a short-term decline.
There are about 41 days until the next Federal Reserve interest rate meeting (2024.06.13)
https://hk.investing.com/economic-calendar/interest-rate-decision-168
Market Technical and Sentiment Analysis
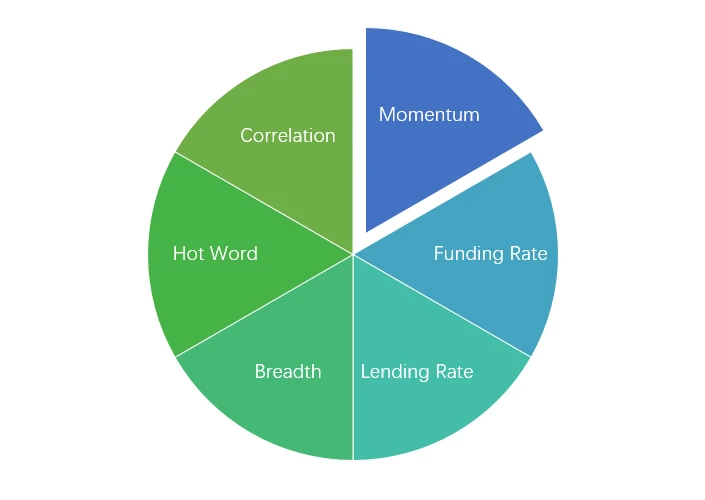
Sentiment Analysis Composition

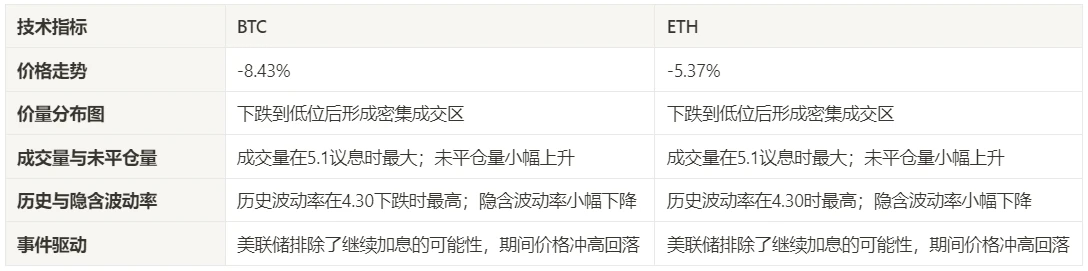
Technical Indicators
Price Trends
Over the past week, BTC prices fell by -8.43%, and ETH prices fell by -5.37%.
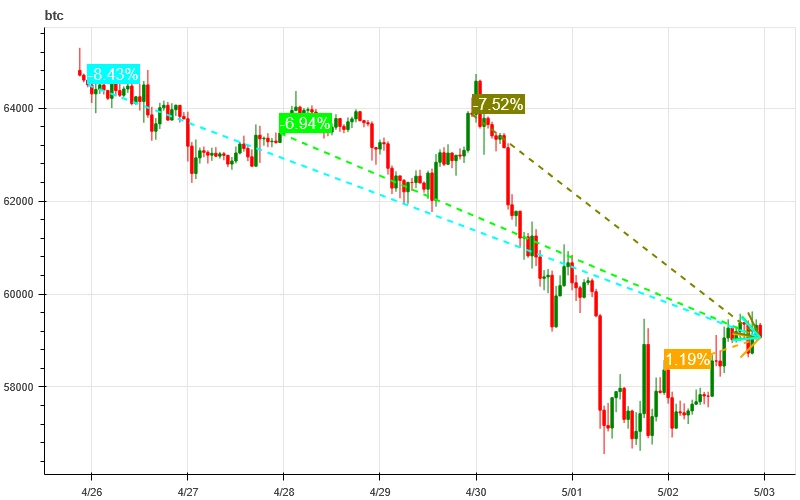
The above chart shows the price trend of BTC over the past week.
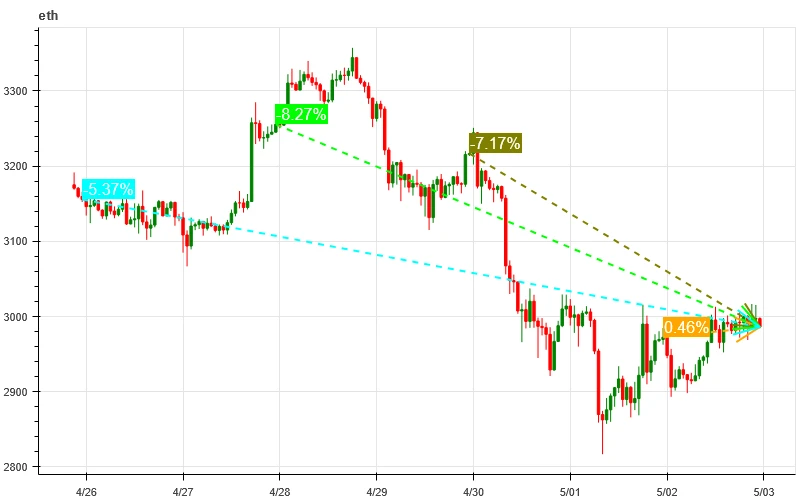
The above chart shows the price trend of ETH over the past week.
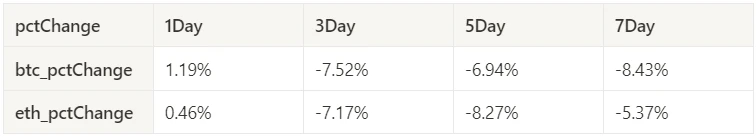
The table shows the price change rate over the past week.
Price-Volume Distribution (Support and Resistance)
Over the past week, BTC and ETH prices fell to low levels and formed dense trading areas.
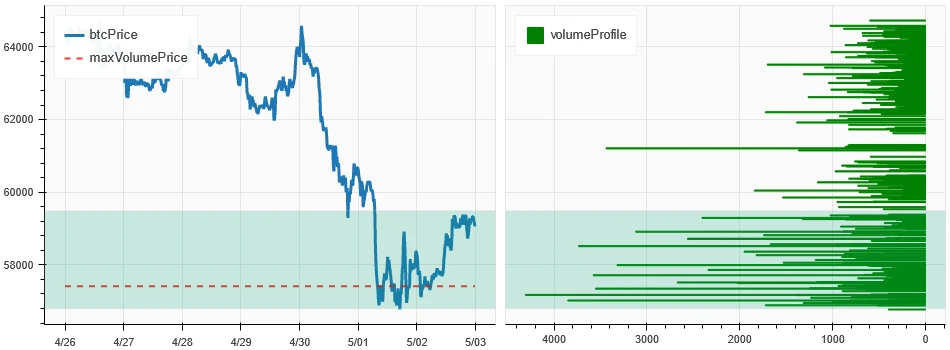
The above chart shows the distribution of dense trading areas for BTC over the past week.
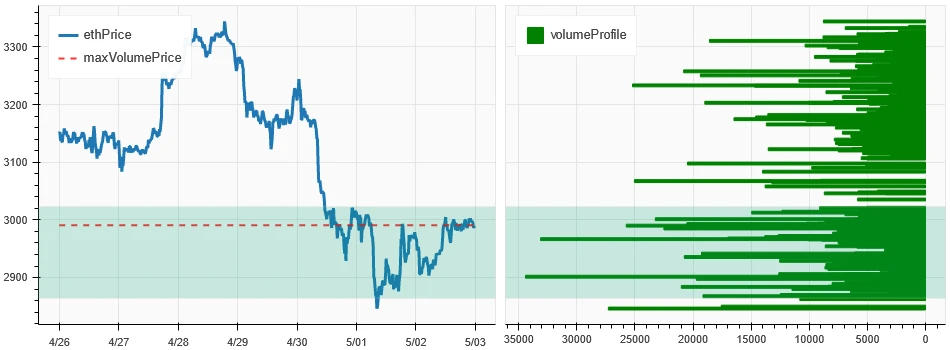
The above chart shows the distribution of dense trading areas for ETH over the past week.
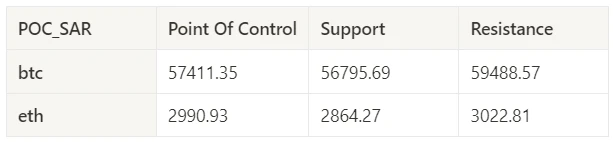
The table shows the dense trading areas for BTC and ETH each week over the past week.
Volume and Open Interest
Over the past week, BTC and ETH trading volumes were at their highest during the May 1st interest rate decision; open interest in both BTC and ETH saw a slight increase.
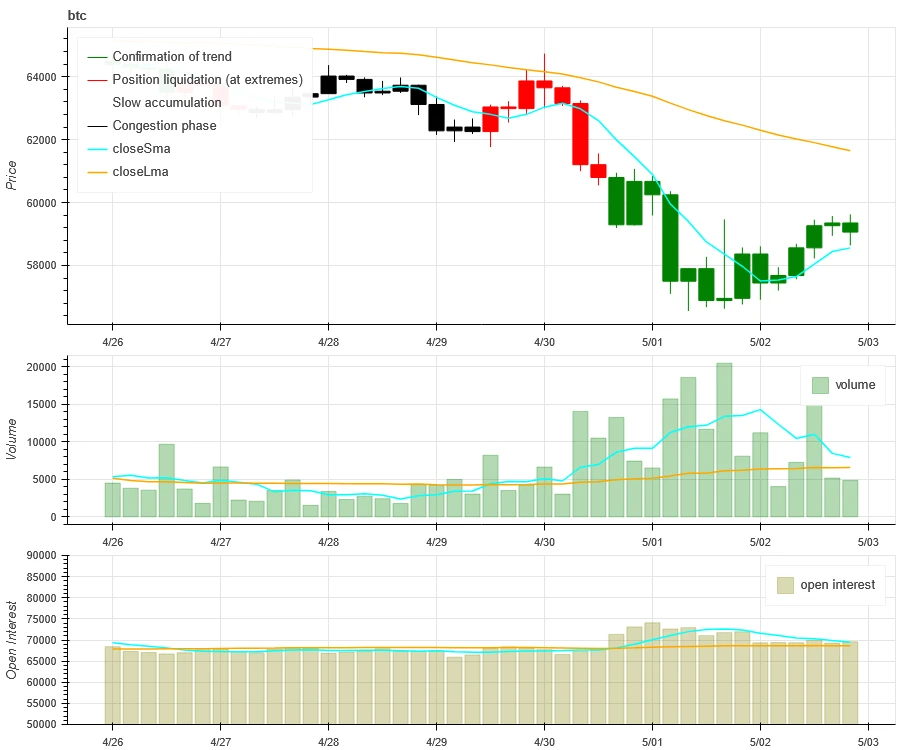
The top section of the above chart shows the price trend of BTC, the middle section shows the trading volume, and the bottom section shows the open interest. The light blue line represents the 1-day average, and the orange line represents the 7-day average. The color of the candlestick represents the current state: green indicates price increase with volume support, red indicates closing positions, yellow indicates slow accumulation of positions, and black indicates crowded conditions.
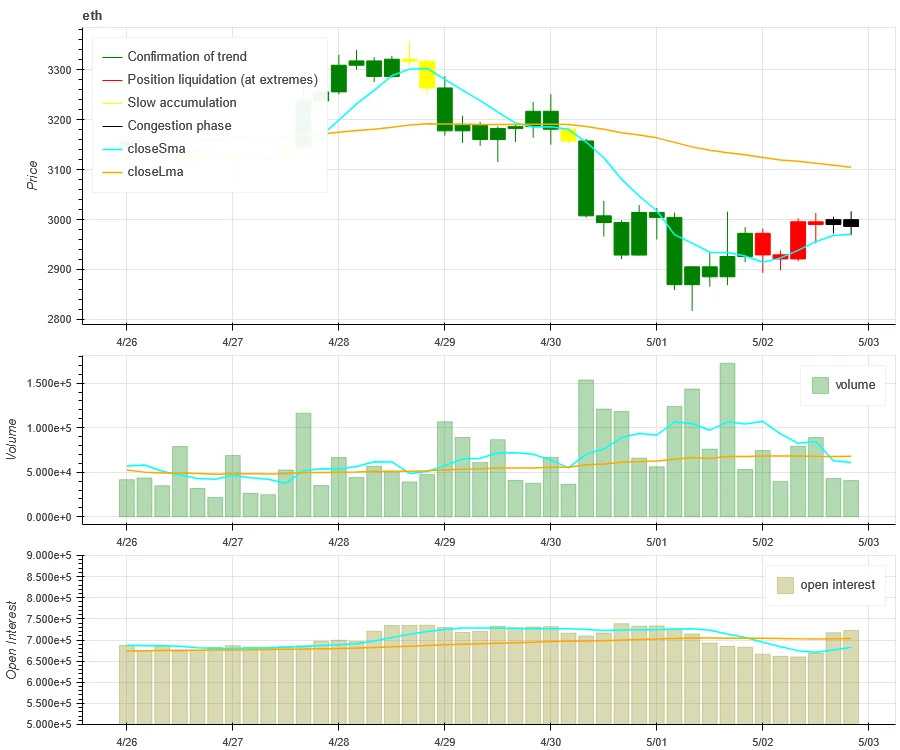
The top section of the above chart shows the price trend of ETH, the middle section shows the trading volume, and the bottom section shows the open interest. The light blue line represents the 1-day average, and the orange line represents the 7-day average. The color of the candlestick represents the current state: green indicates price increase with volume support, red indicates closing positions, yellow indicates slow accumulation of positions, and black indicates crowded conditions.
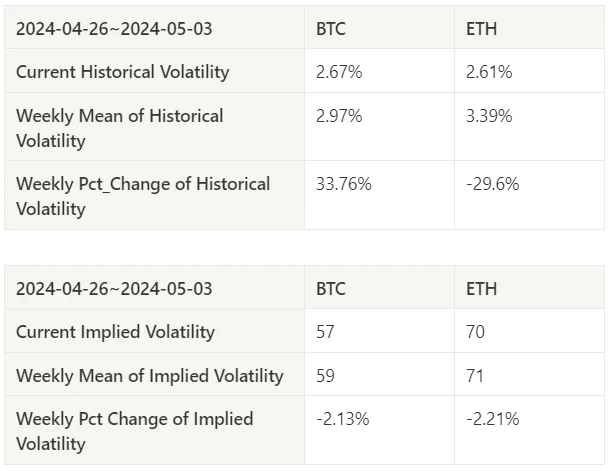
Historical Volatility and Implied Volatility
Over the past week, historical volatility for both BTC and ETH peaked after a decline to 4.30; implied volatility for both BTC and ETH decreased.
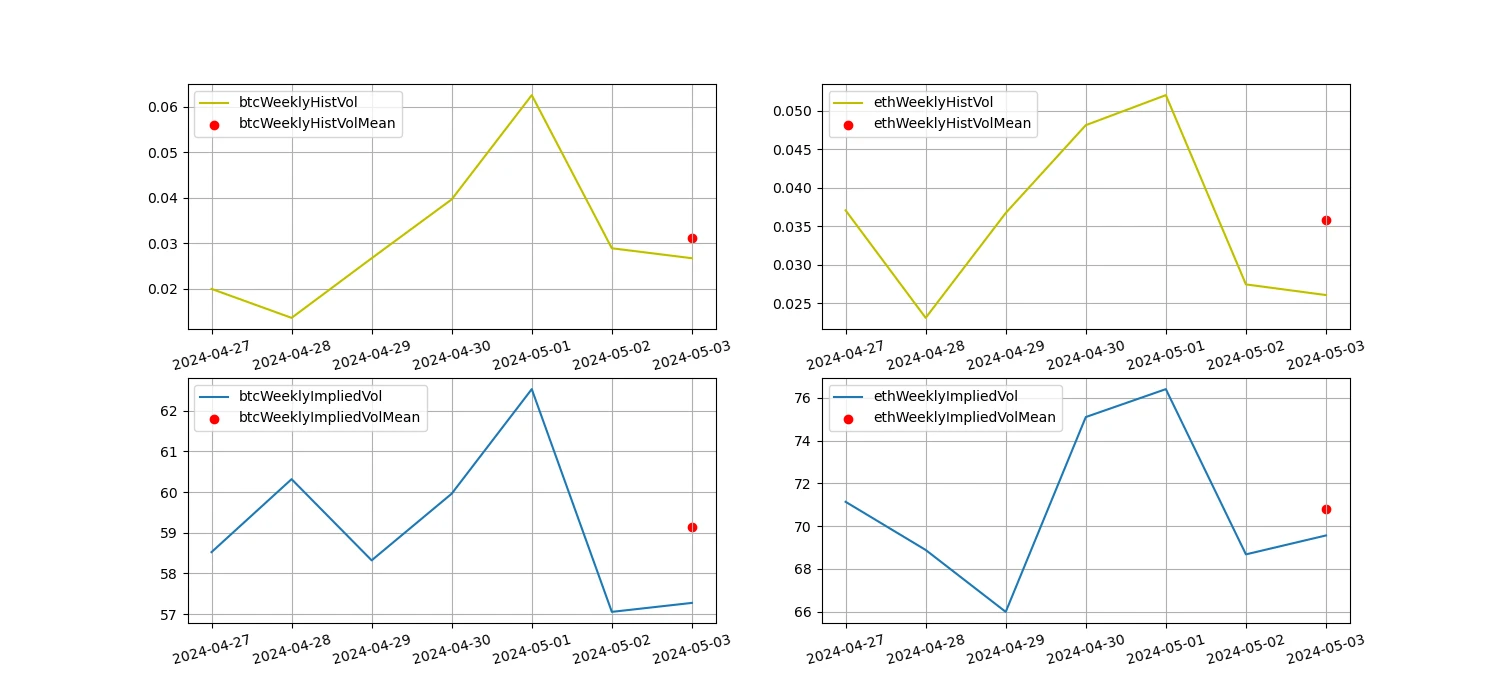
The yellow line represents historical volatility, the blue line represents implied volatility, and the red dots represent the 7-day average.
Event-Driven
In terms of events, the Federal Reserve interest rate meeting ruled out the possibility of further rate hikes, and Bitcoin surged and then stabilized during the meeting.
Sentiment Indicators
Momentum Sentiment
Over the past week, the Hang Seng Index (HSI) has been the strongest performer among Bitcoin, gold, Nasdaq, Hang Seng Index, and the Shanghai and Shenzhen 300 Index, while Bitcoin has performed the worst.
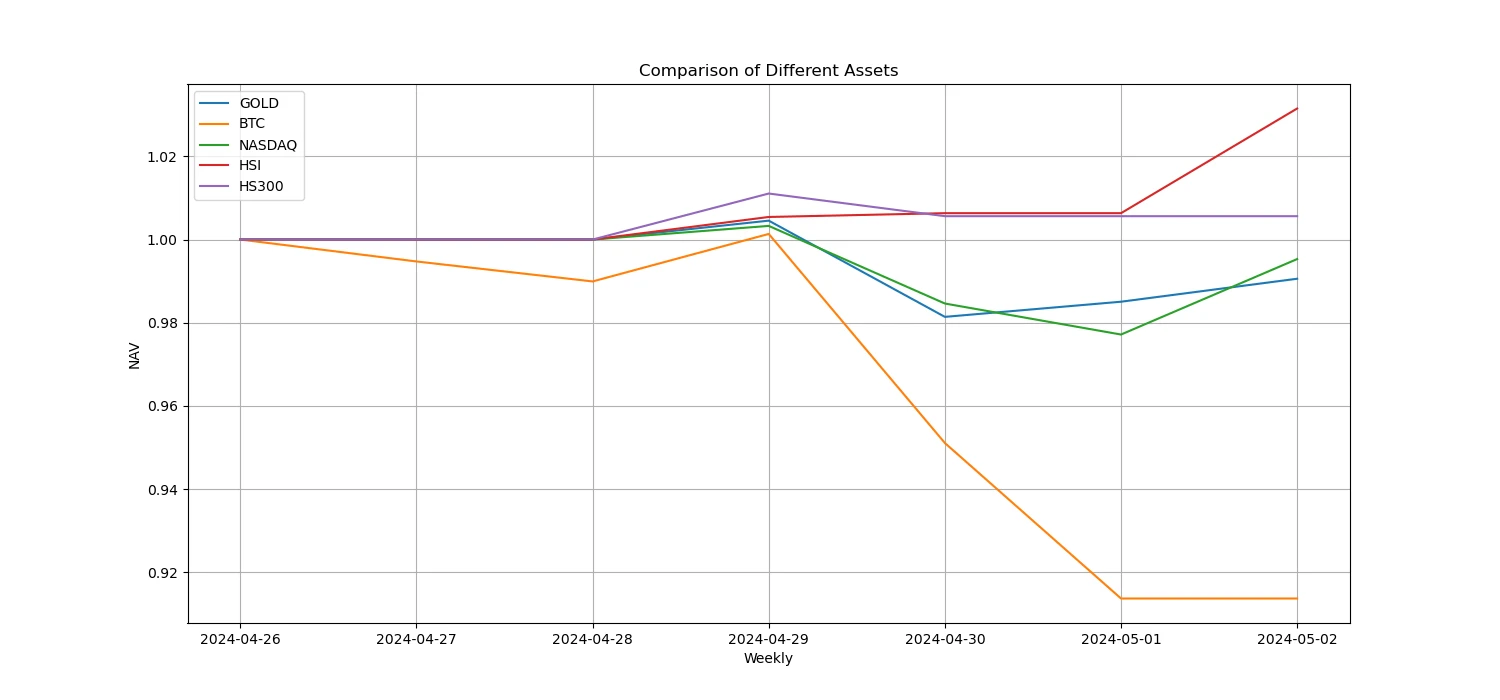
The above chart shows the performance of different assets over the past week.
Lending Rates and Borrowing Sentiment
Over the past week, the average annualized USD lending yield was 11.2%, with short-term rates around 12.9%.
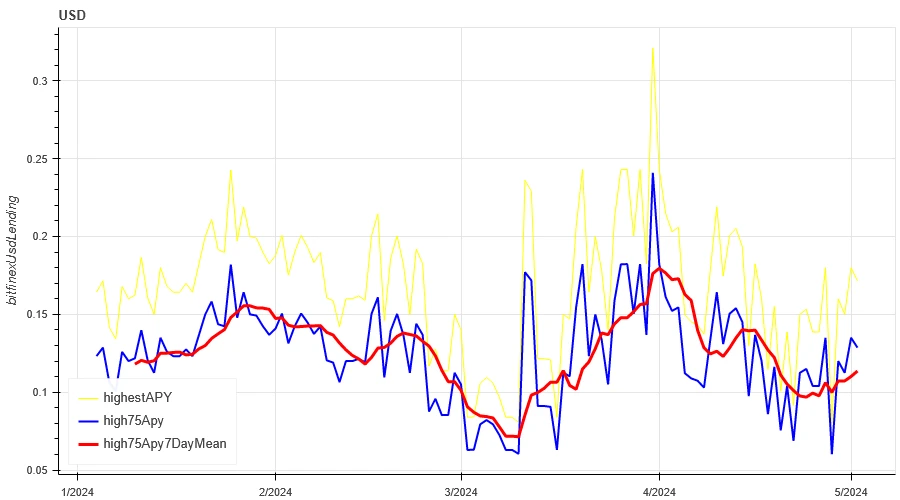
The yellow line represents the highest price of USD rates, the blue line represents 75% of the highest price, and the red line represents the 7-day average of 75% of the highest price.
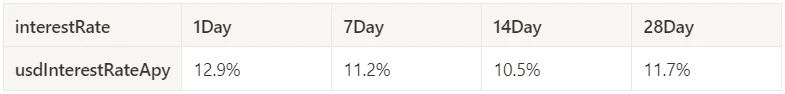
The table shows the average returns of USD rates for different holding periods.
Funding Rates and Contract Leverage Sentiment
Over the past week, the average annualized BTC funding yield was 6%, and the contract leverage sentiment remained low.

The blue line represents the funding rate for BTC on Binance, and the red line represents its 7-day average.
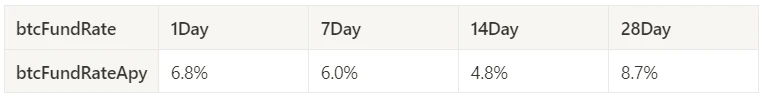
The table shows the average returns of BTC funding for different holding periods.
Market Correlation and Consistency Sentiment
Over the past week, the correlation among the selected 129 coins has risen to around 0.85, and the consistency between different varieties has continued to increase.
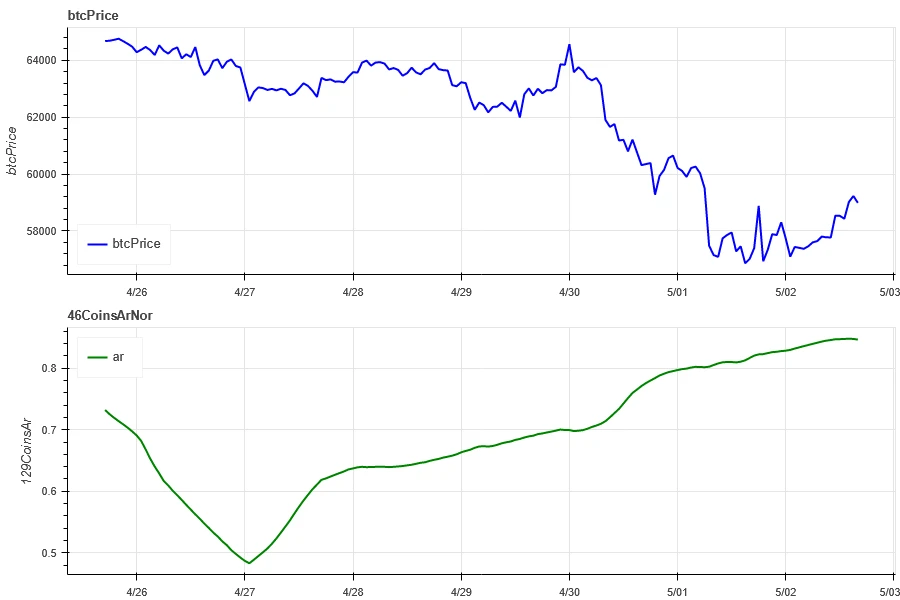
The blue line represents the price of Bitcoin, and the green line represents the overall correlation among the following coins: ['1000floki', '1000lunc', '1000pepe', '1000shib', '1000xec', '1inch', 'aave', 'ada', 'agix', 'algo', 'ankr', 'ant', 'ape', 'apt', 'arb', 'ar', 'astr', 'atom', 'audio', 'avax', 'axs', 'bal', 'band', 'bat', 'bch', 'bigtime', 'blur', 'bnb', 'btc', 'celo', 'cfx', 'chz', 'ckb', 'comp', 'crv', 'cvx', 'cyber', 'dash', 'doge', 'dot', 'dydx', 'egld', 'enj', 'ens', 'eos','etc', 'eth', 'fet', 'fil', 'flow', 'ftm', 'fxs', 'gala', 'gmt', 'gmx', 'grt', 'hbar', 'hot', 'icp', 'icx', 'imx', 'inj', 'iost', 'iotx', 'jasmy', 'kava', 'klay', 'ksm', 'ldo', 'link', 'loom', 'lpt', 'lqty', 'lrc', 'ltc', 'luna2', 'magic', 'mana', 'matic', 'meme', 'mina', 'mkr', 'near', 'neo', 'ocean', 'one', 'ont', 'op', 'pendle', 'qnt', 'qtum', 'rndr', 'rose', 'rune', 'rvn', 'sand', 'sei', 'sfp', 'skl', 'snx', 'sol', 'ssv', 'stg', 'storj', 'stx', 'sui', 'sushi', 'sxp', 'theta', 'tia', 'trx', 't', 'uma', 'uni', 'vet', 'waves', 'wld', 'woo', 'xem', 'xlm', 'xmr', 'xrp', 'xtz', 'yfi', 'zec', 'zen', 'zil', 'zrx’]
Market Breadth and Overall Sentiment
Over the past week, out of the selected 129 coins, 4.7% had prices above the 30-day moving average, compared to 35% for BTC. The percentage of coins that were more than 20% above the lowest price in the past 30 days was 3.1%, and the percentage of coins that were less than 10% below the highest price in the past 30 days was 4.7%. The market breadth indicator over the past week shows that the overall market is in a weak phase.
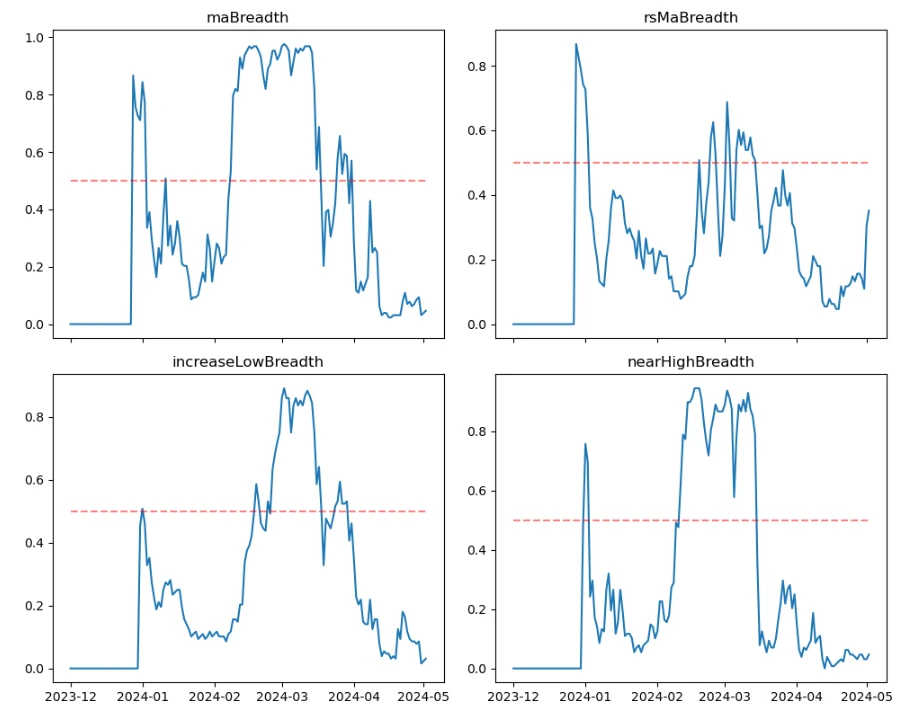
The chart above shows the proportion of various width indicators for the past 30 days for the following coins: ['1000floki', '1000lunc', '1000pepe', '1000shib', '1000xec', '1inch', 'aave', 'ada', 'agix', 'algo', 'ankr', 'ant', 'ape', 'apt', 'arb', 'ar', 'astr', 'atom', 'audio', 'avax', 'axs', 'bal', 'band', 'bat', 'bch', 'bigtime', 'blur', 'bnb', 'btc', 'celo', 'cfx', 'chz', 'ckb', 'comp', 'crv', 'cvx', 'cyber', 'dash', 'doge', 'dot', 'dydx', 'egld', 'enj', 'ens', 'eos','etc', 'eth', 'fet', 'fil', 'flow', 'ftm', 'fxs', 'gala', 'gmt', 'gmx', 'grt', 'hbar', 'hot', 'icp', 'icx', 'imx', 'inj', 'iost', 'iotx', 'jasmy', 'kava', 'klay', 'ksm', 'ldo', 'link', 'loom', 'lpt', 'lqty', 'lrc', 'ltc', 'luna2', 'magic', 'mana', 'matic', 'meme', 'mina', 'mkr', 'near', 'neo', 'ocean', 'one', 'ont', 'op', 'pendle', 'qnt', 'qtum', 'rndr', 'rose', 'rune', 'rvn', 'sand', 'sei', 'sfp', 'skl', 'snx', 'sol', 'ssv', 'stg', 'storj', 'stx', 'sui', 'sushi', 'sxp', 'theta', 'tia', 'trx', 't', 'uma', 'uni', 'vet', 'waves', 'wld', 'woo', 'xem', 'xlm', 'xmr', 'xrp', 'xtz', 'yfi', 'zec', 'zen', 'zil', 'zrx’]

Summary
In the past week's market, the prices of Bitcoin (BTC) and Ethereum (ETH) both dropped on 4.30, with the highest historical volatility on 4.30, and the highest trading volume during the Federal Reserve interest rate decision, with a slight increase in open interest. The implied volatility of BTC and ETH both decreased from the beginning of the week. In addition, the funding rates remained low, indicating continued low sentiment in contract trading. The market breadth indicator shows that the overall market is still in a weak phase. In terms of events, the Federal Reserve interest rate meeting ruled out the possibility of further rate hikes, and Bitcoin rose and fell during the meeting.
Twitter: @DerivativesCN
Website: https://dcbot.ai/
Medium: https://medium.com/@DerivativesCN
免责声明:本文章仅代表作者个人观点,不代表本平台的立场和观点。本文章仅供信息分享,不构成对任何人的任何投资建议。用户与作者之间的任何争议,与本平台无关。如网页中刊载的文章或图片涉及侵权,请提供相关的权利证明和身份证明发送邮件到support@aicoin.com,本平台相关工作人员将会进行核查。


