Today, the Federal Open Market Committee (FOMC) and ADP employment report are pending release, but as the market has already anticipated the delay in interest rate cuts, the expected impact on the market is likely to be very limited.
Let's start the analysis with the daily chart today.
【BTC Daily Chart】
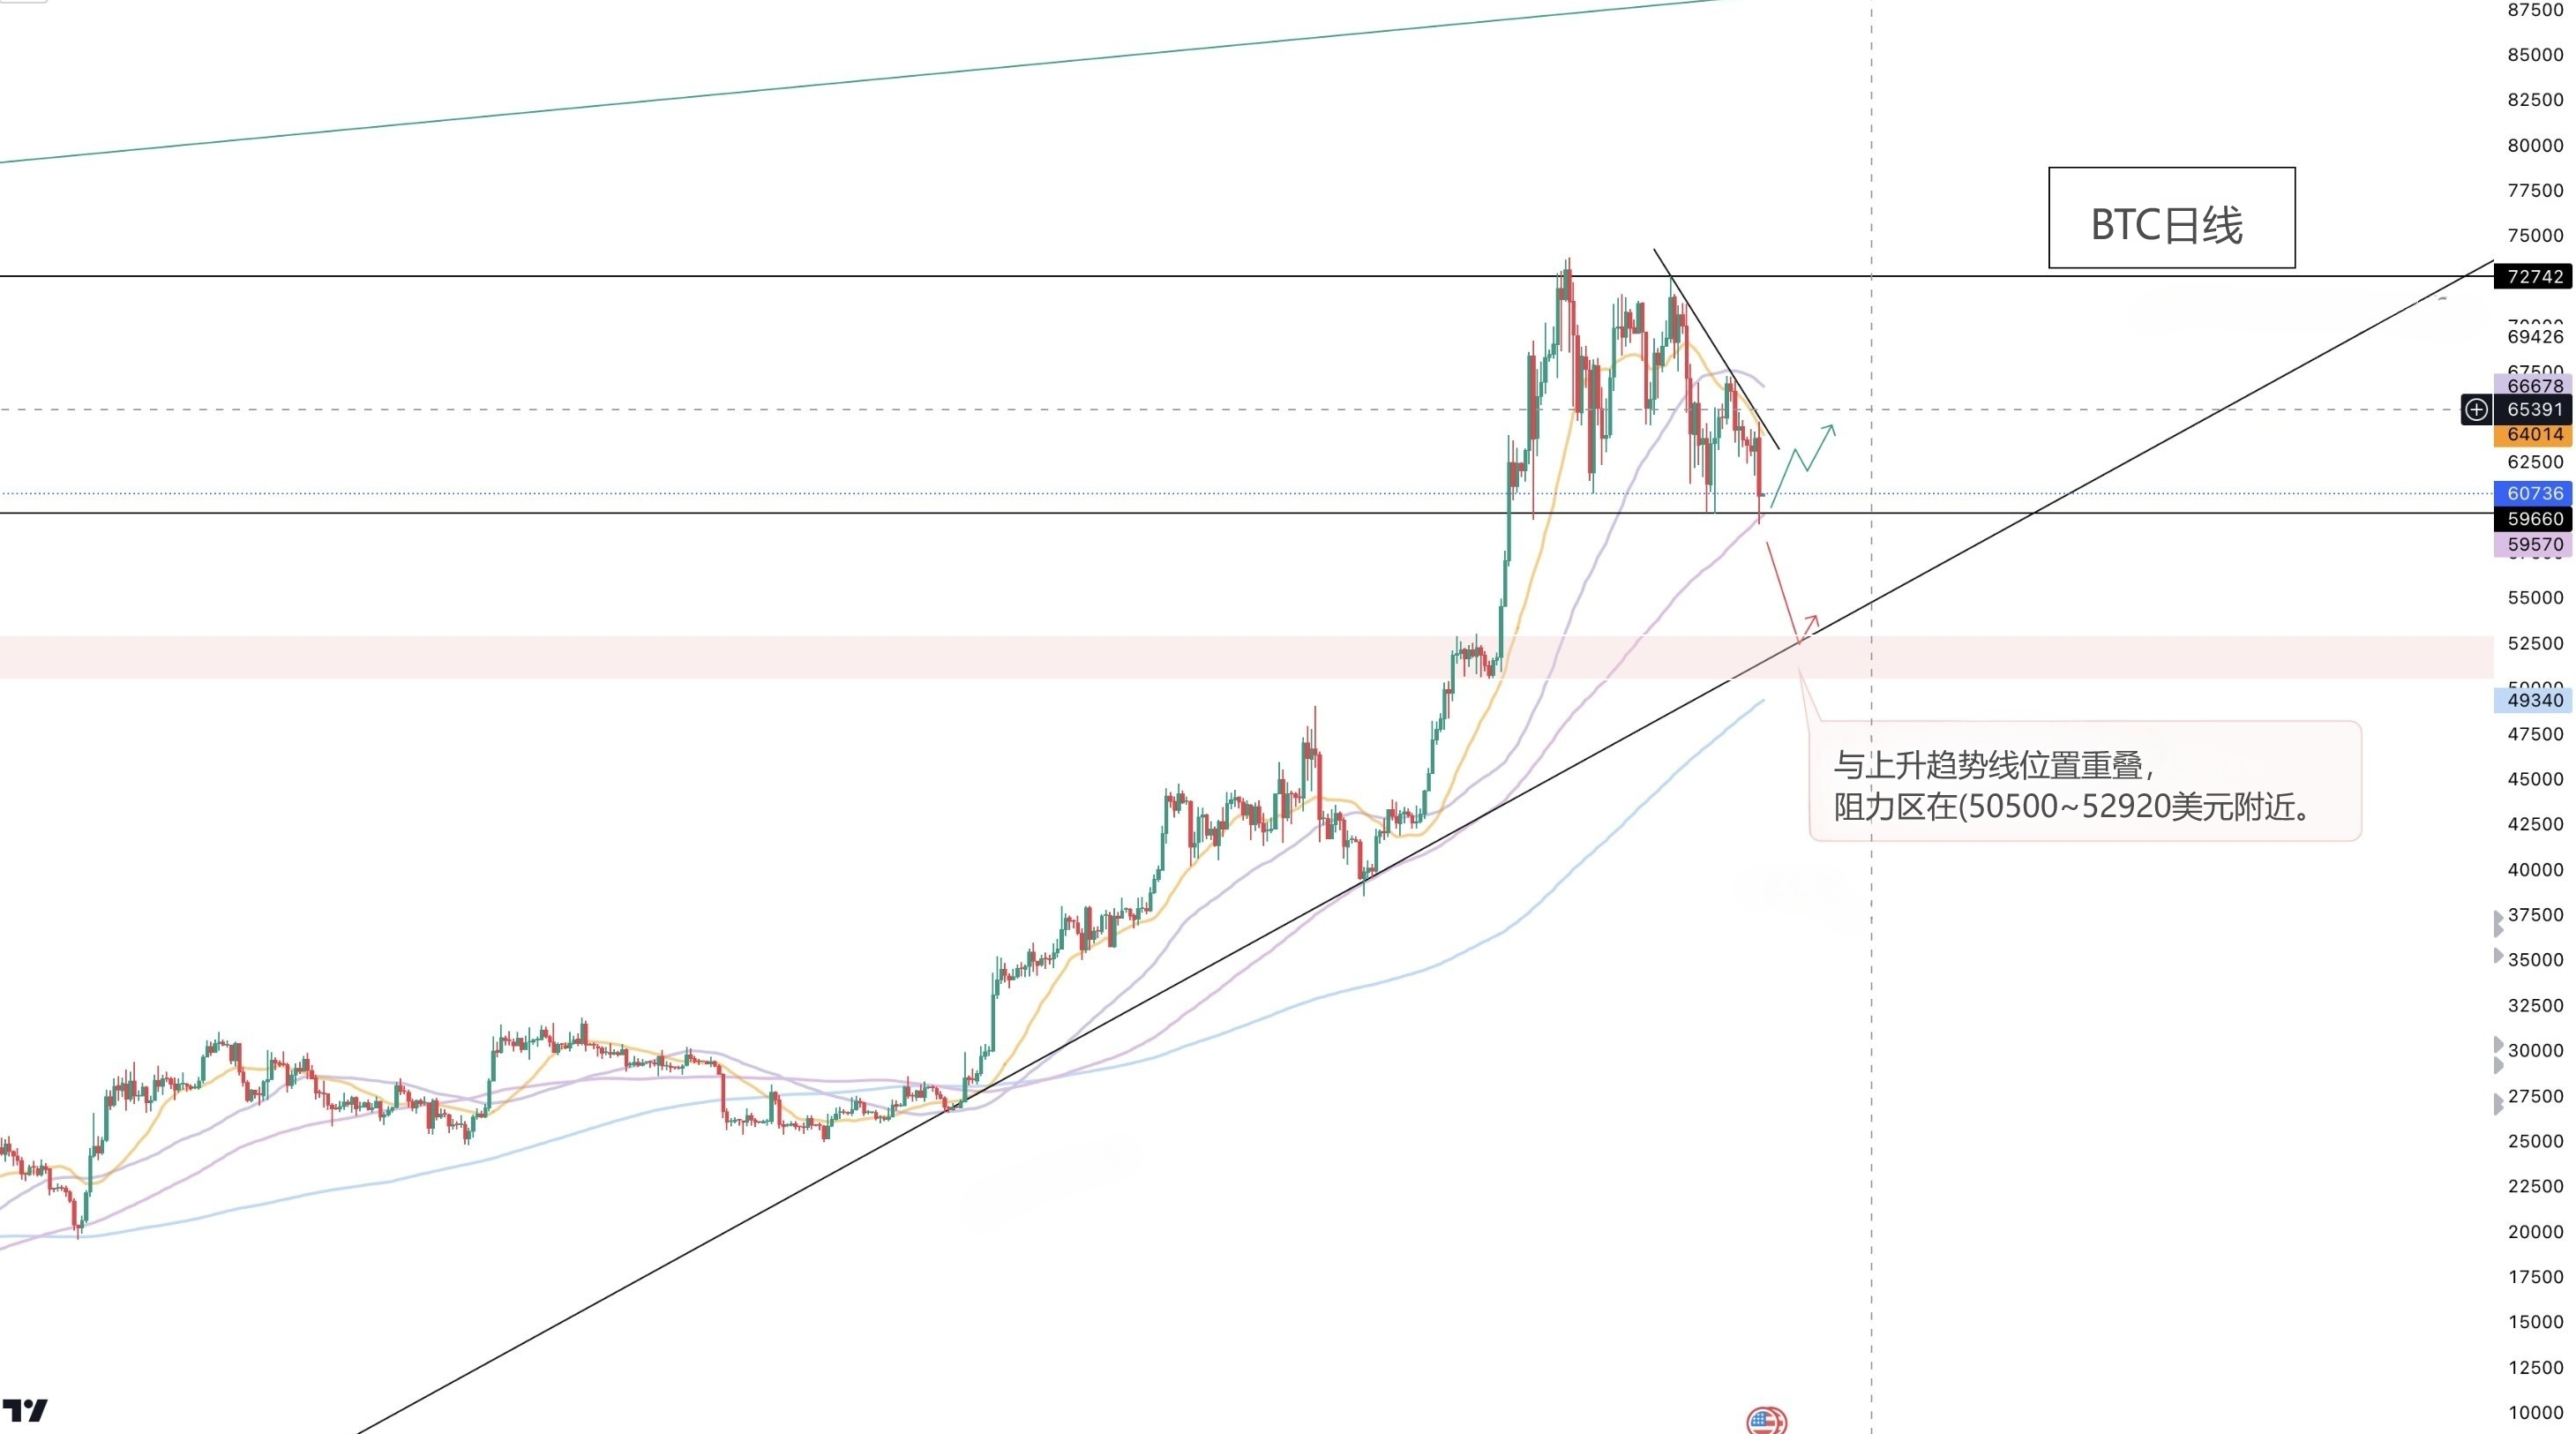
Currently, the price is facing resistance from the 20-day moving average and the downtrend line of the high point on the daily chart, leading to a decline, although a rebound has occurred at the 100-day moving average on the daily chart.
However, if the support of the 100-day moving average on the daily chart is broken, it is expected that BTC will decline to the uptrend line since October 2023, which is close to the 200-day moving average on the daily chart.
So, if BTC is to rise again, it needs to break through these two resistance points on the daily chart.
【4-hour Chart】
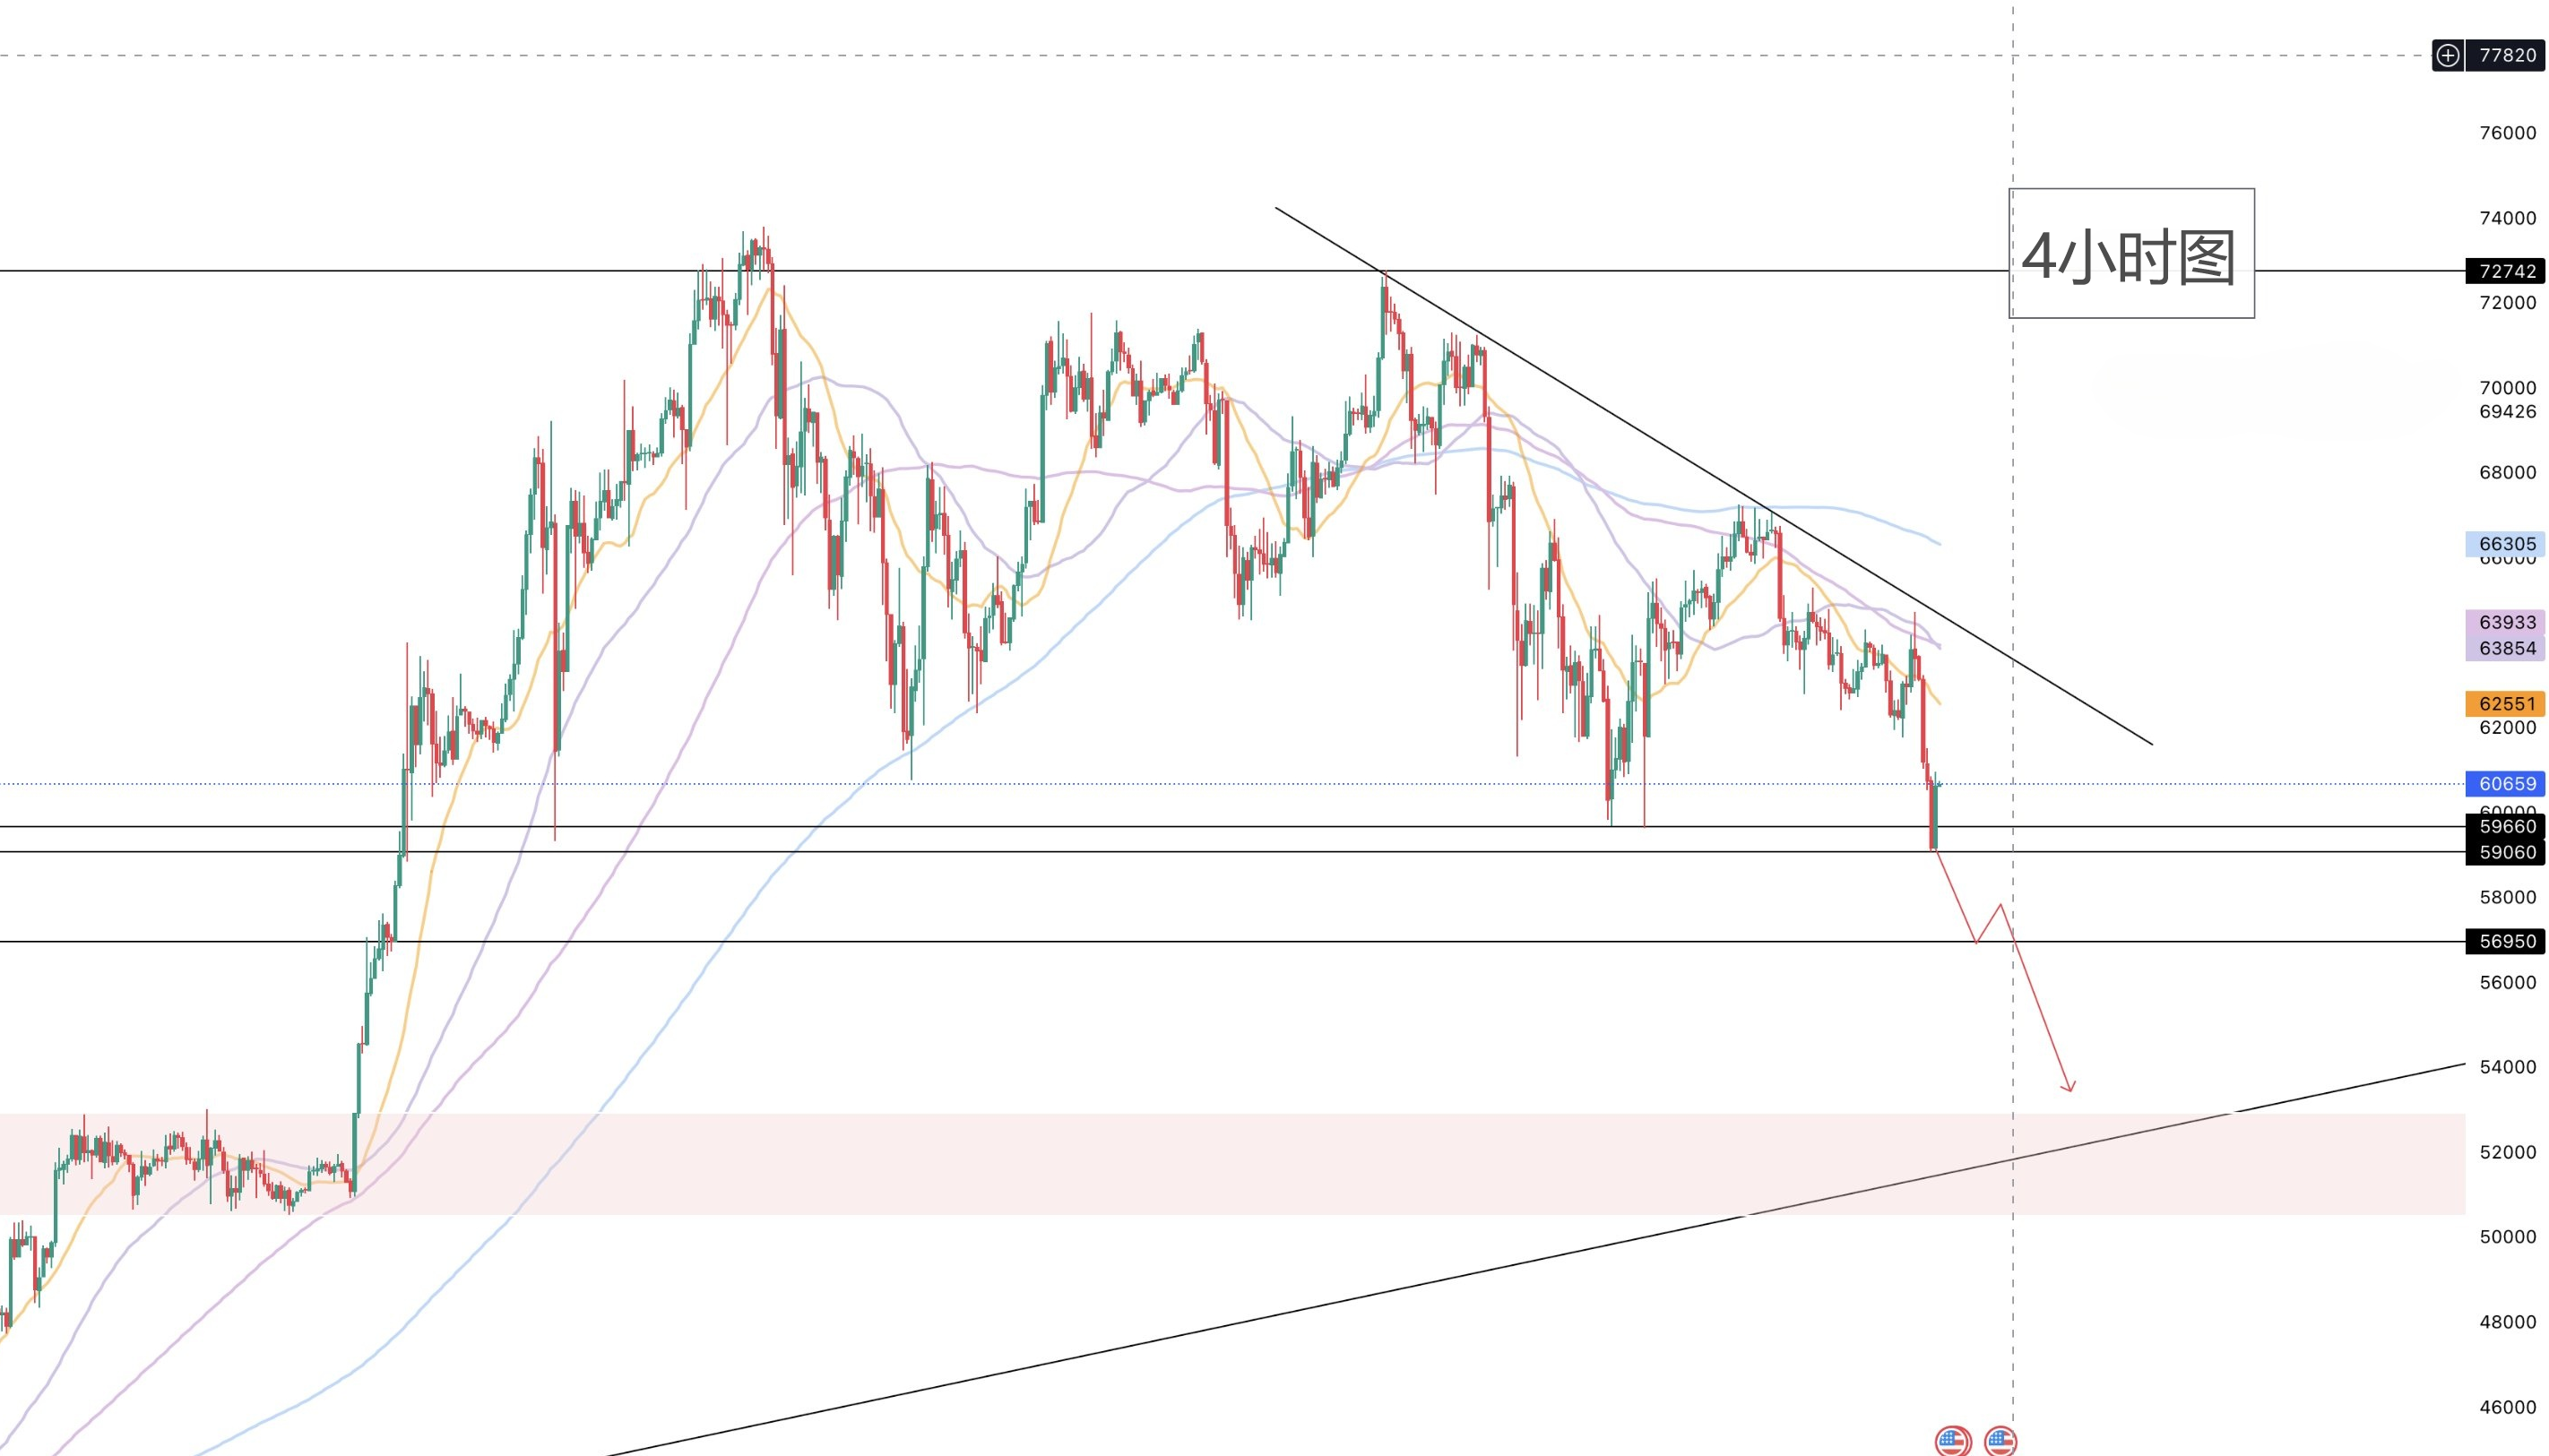
On the 4-hour chart, the price has rebounded around $59,060 (near the 100-day moving average on the daily chart). If the support works, short-term opportunities for long positions can be sought from here.
If it falls below around $59,060, the price is expected to continue to decline to around $56,950.
【1-hour Chart】
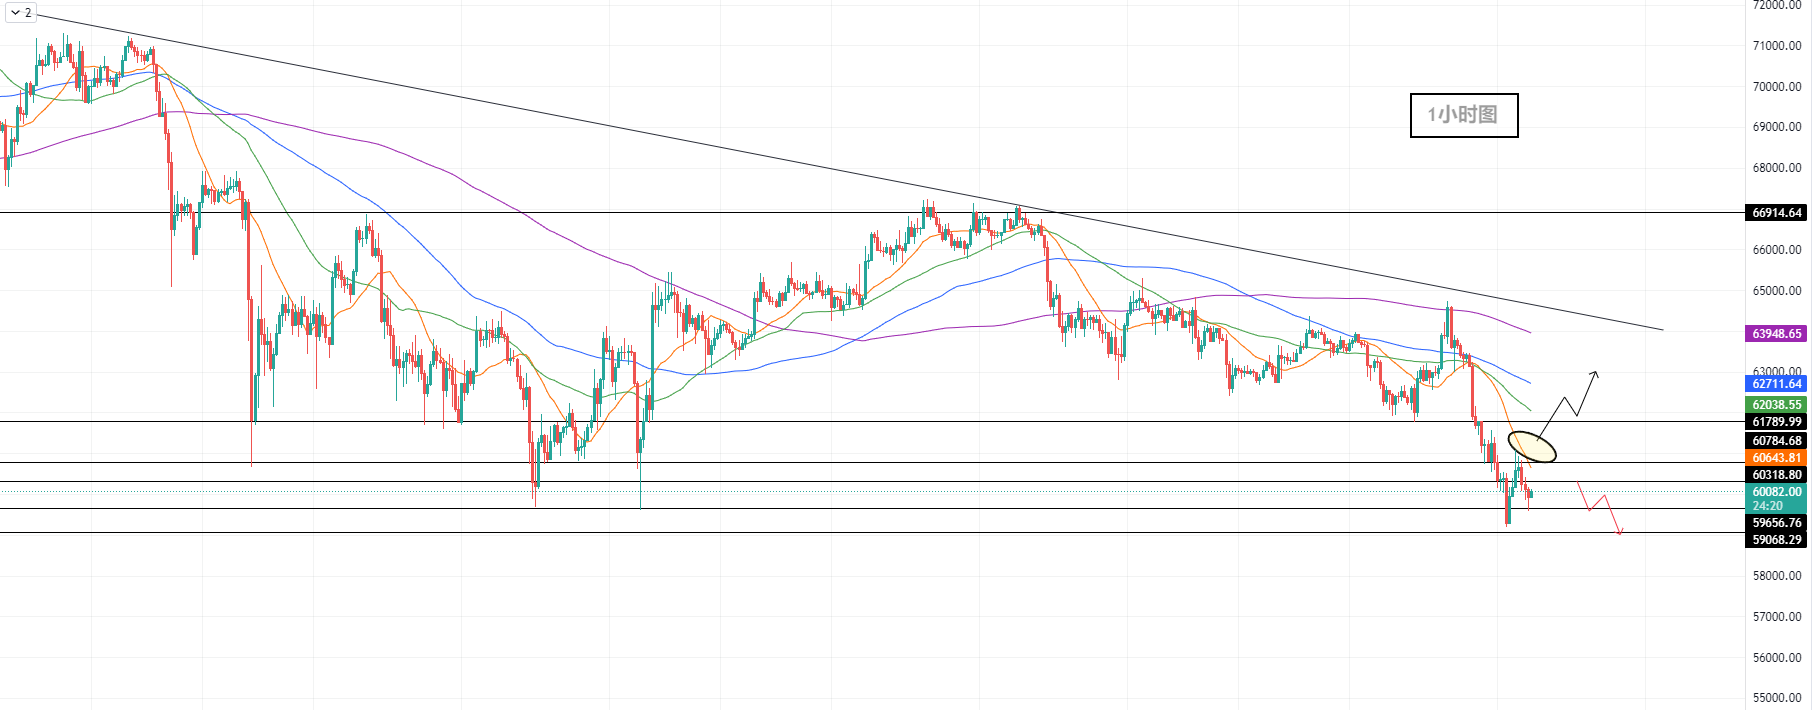
From the short-term perspective of the 1-hour chart, BTC is experiencing a small rebound. Although the author wanted to go long near $60,960 in the early morning, the 20-day moving average on the 1-hour chart rebounded near $61,120 in the morning. Therefore, for those who want to enter long positions within the day, they can consider these two areas:
20MA Moving Average (60648) - 60960 for Long Positions, Stop Loss at 500, Target 61800-62400
If the 20-day moving average on the 1-hour chart is broken, the price is expected to rise to $61,780. If it continues to rise, due to the movement of the 50-day and 100-day moving averages on the 1-hour chart, friends holding long positions need to pay attention.
From the perspective of the moving averages, there is still a downward trend, so the author believes that there is no need to forcefully go long.
Originally, around $60,790 was a resistance level. If the price stalls here, it should not go against the trend. If the resistance near $60,790 is broken and the resistance near $60,350 is also broken.
Then those who want to go short can consider these two areas: 62400-62700 for Short Positions, Stop Loss at 500, Target 62000-61500
This article is exclusively planned and published by Master Chen (WeChat public account: Coin God Master Chen). If you need to understand more real-time investment strategies, untangling, spot contract trading techniques, operational skills, and knowledge of candlesticks, you can add Master Chen for learning and communication, hoping to help you find what you want in the currency circle. Focusing on BTC, ETH, and altcoin spot contracts for many years, there is no 100% method, only 100% going with the trend; daily updates on macro analysis articles across the network, technical indicator analysis of mainstream coins and altcoins, and spot mid-to-long-term replay price prediction videos.

Gentle reminder: This article is only written by Master Chen's column public account (as shown in the picture above). Other advertisements at the end of the article and in the comment section are not related to the author. Please distinguish carefully between true and false. Thank you for reading.
免责声明:本文章仅代表作者个人观点,不代表本平台的立场和观点。本文章仅供信息分享,不构成对任何人的任何投资建议。用户与作者之间的任何争议,与本平台无关。如网页中刊载的文章或图片涉及侵权,请提供相关的权利证明和身份证明发送邮件到support@aicoin.com,本平台相关工作人员将会进行核查。


