Last week, the U.S. stock market welcomed the busiest "earnings week" of the first quarter, with nearly half of the listed U.S. stocks choosing to release their earnings reports this week. After experiencing a major plunge last Friday, the market's attention is focused on the earnings reports of tech giants that have already been released or are yet to be released this week.
Amid the "earnings report frenzy," several "public chain financial report" data charts released by blockchain data analysis company Token Terminal on its official Twitter account a few days ago have also attracted attention and discussion within the crypto community. The financial situation of L1 and L2 public chains such as ETH, Solana, and Base has become more intuitive with the release of several sets of data. However, the initial reaction of many to the "public chain financial report" is: Is this concept really reasonable?
The term "earnings report" has always been distant from the crypto industry. In a market where the business model is not yet clear and team monetization still relies mainly on token issuance, data such as active addresses, TVL, and market value seem to be more transparent. Whether the traditional logic of financial reports is applicable in the crypto market, and whether the subject of measurement is the protocol or the team, as well as which statistical indicators should be used, all make this business seem out of place when compared to traditional business. Constantly shouting "Mass Adoption" on the surface while harboring doubts about the "Ponzi game" in their hearts is probably the common view and understanding of the industry among crypto enthusiasts.
So, is the concept of financial reports really applicable in the crypto industry? I tend to lean towards an affirmative answer. Although there may be significant differences in specific indicators and presentation logic, public chains (especially general-purpose public chains like Ethereum and Solana) need the ability to self-generate revenue just like traditional companies at their core. Otherwise, they will truly become Ponzi schemes.
So, for a public chain, what does it mean to have "the ability to self-generate revenue"?
Public Chains Burning Through Money
In fact, in the current crypto industry, almost all public chains except for Bitcoin, a decentralized ledger, need to have the ability to self-generate revenue in order to survive in the long term and securely.
For BTC, its market value and price reflect the volume of wealth from the outside world being put into the Bitcoin ledger, and this wealth is willing to pay "property custody fees" to miners in order to obtain security for the Bitcoin network. However, this system does not seem to work for general-purpose public chains like Ethereum and Solana. This is because miners are a profit-driven group, and they will go wherever they can make the most money. Moreover, general-purpose public chains, which are responsible for maintaining the "world computer," do not have much attraction to wealth from the outside world. Therefore, from the perspective of supply and demand, the burden of paying the cost of hiring miners (now mostly validators) to secure the network generally falls on the network itself.
In simple terms, general-purpose public chains need to find ways to "generate revenue" to pay the validators who maintain the network. This involves not only simply distributing token incentives but also ensuring that the tokens distributed have long-term value support. This is the basic ability of a public chain to self-generate revenue. Of course, revenue generation is not just for the sake of "survival." In the stock market, stronger revenue-generating ability means stronger buyback power and stock price expectations, and the same applies to the public chain business.
Following this logic, it becomes clear what data should be included in a "public chain financial report."
First and foremost is operating income. For public chains, this part comes entirely from network fees, and the portion of fees that are destroyed can be seen as the network's revenue (equivalent to buyback). The more network activity there is, the higher the fee income. Next is operating costs, including the portion of network fees paid to validators (supply-side fees) and the token incentives distributed by the network. The lower the token incentives distributed, the lower the cost. Finally, there is gross profit, which is the result of token destruction minus token distribution (as well as validator costs). This is the ultimate manifestation of a public chain's revenue-generating ability and network value. It is easy to see that for a public chain, the amount of gas burned and block rewards distributed largely determine its revenue-generating ability and self-sustainability.
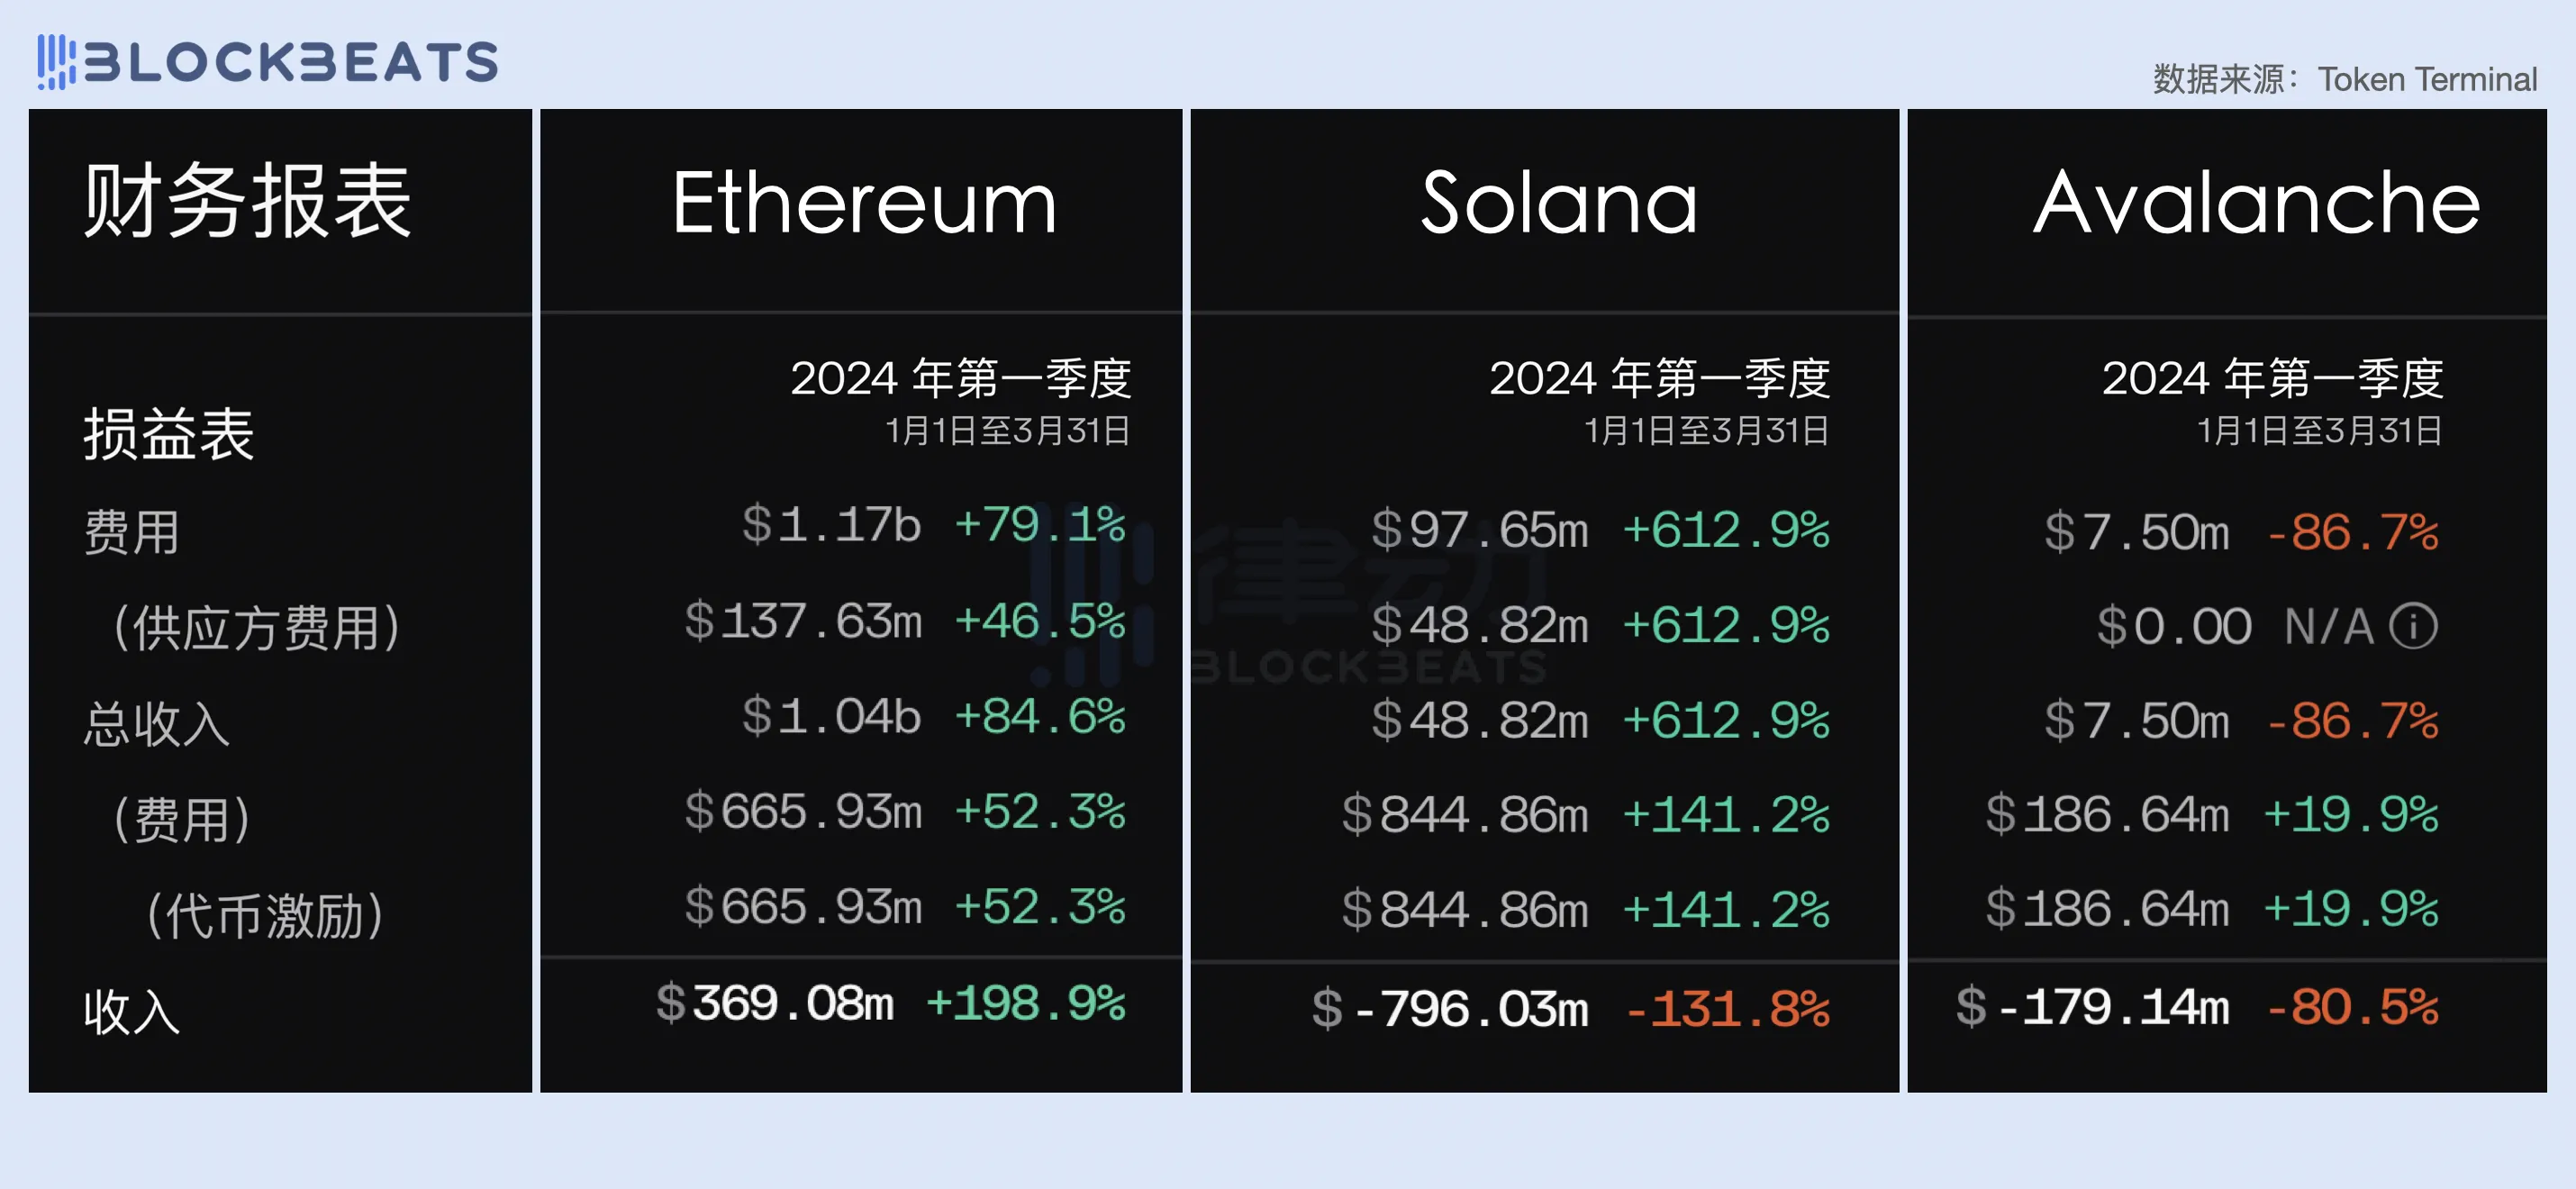
So, how did general-purpose public chains perform in terms of revenue generation in the first quarter of this year? We have selected three representative cases for comparative analysis: Ethereum, which conducts gas buyback and burn based on base fees, Solana, which uses 50% of fees for buyback and burn, and Avalanche, which burns 100% of fees.
From the "quarterly report," it can be seen that Ethereum remains the public chain with the strongest revenue-generating ability in the current crypto world, achieving a revenue of 1.17 billion USD and a net profit of 369 million USD in the first quarter of 2024. Despite Solana's strong ecosystem momentum over the past six months, due to its advocacy of ultra-low gas fees and the lack of a dynamic fee mechanism, it only achieved revenue of less than 100 million USD in the first quarter, while its network operating costs (i.e., token incentives) were as high as 844 million USD, resulting in a total loss of 796 million USD. The Avalanche network had almost no revenue in the first quarter, with a loss of 179 million USD after deducting costs.
ETH: Barely Achieving Balance between Revenue and Expenses
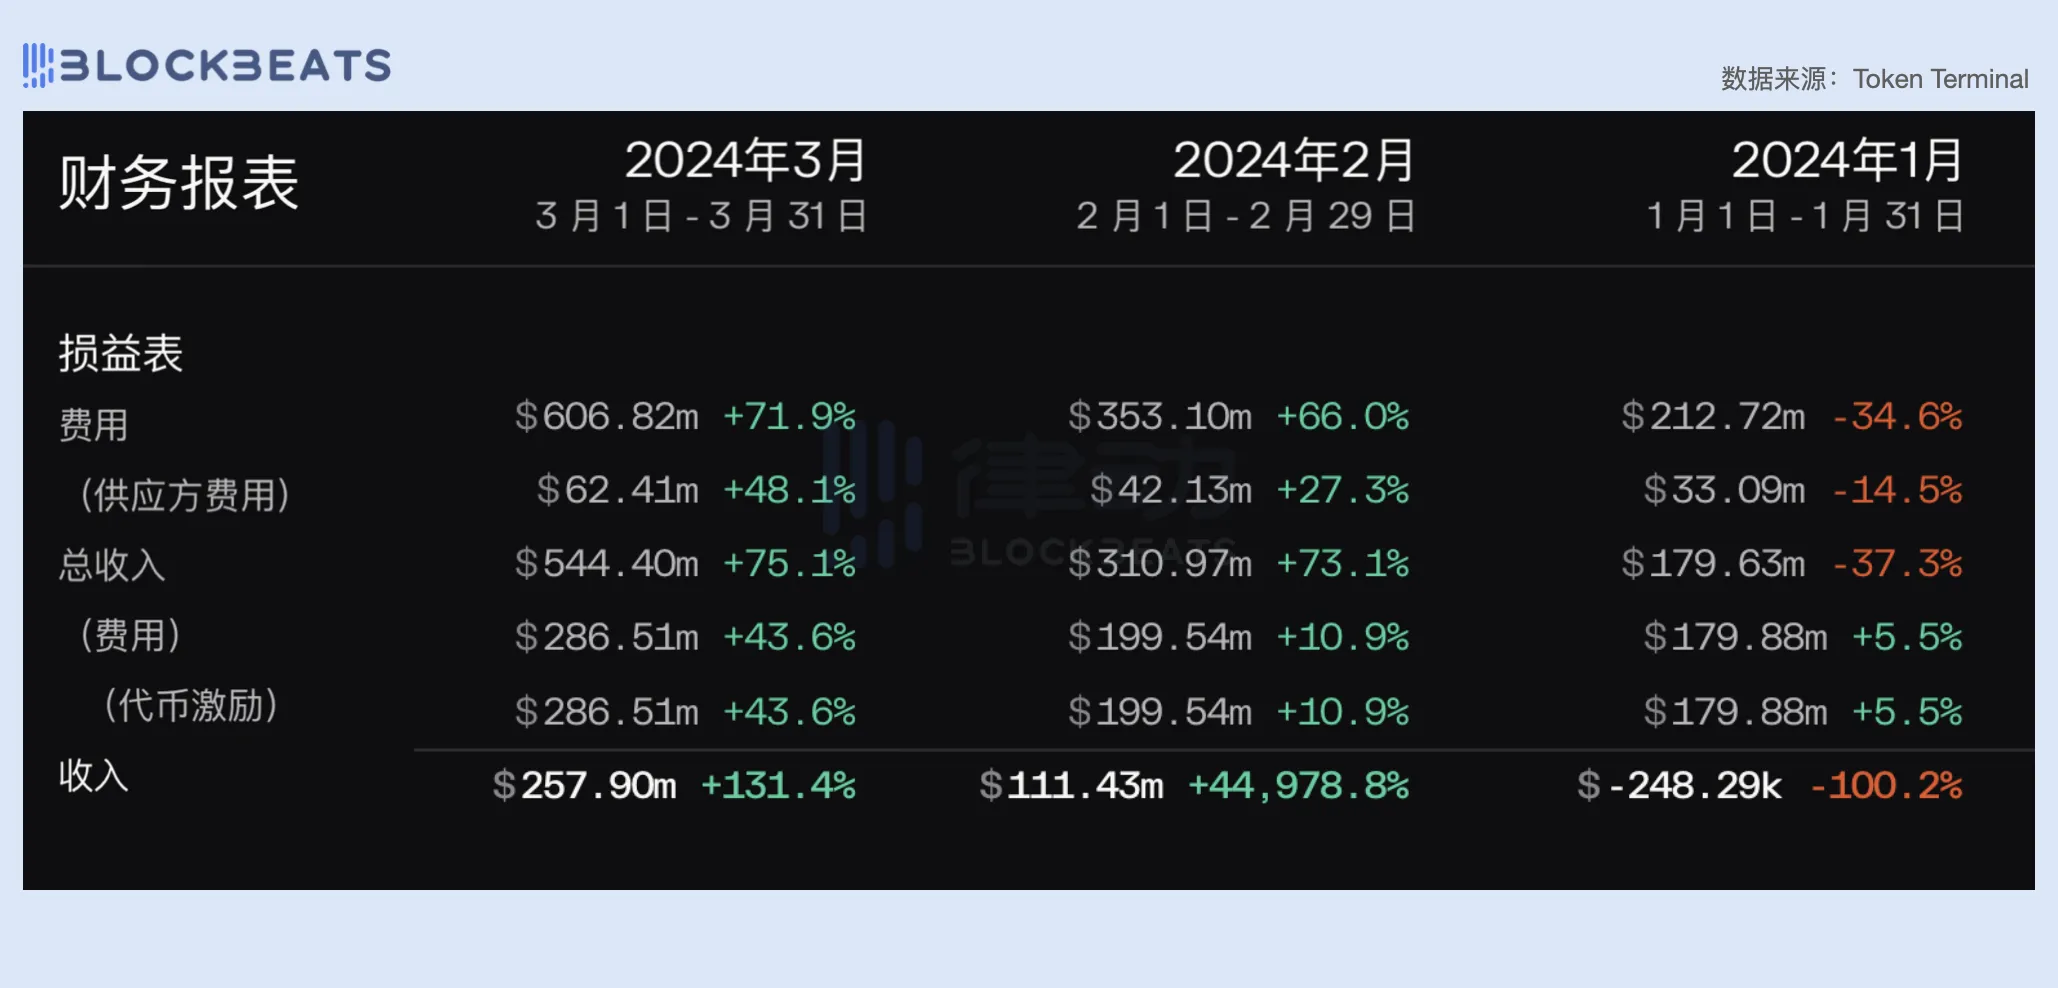
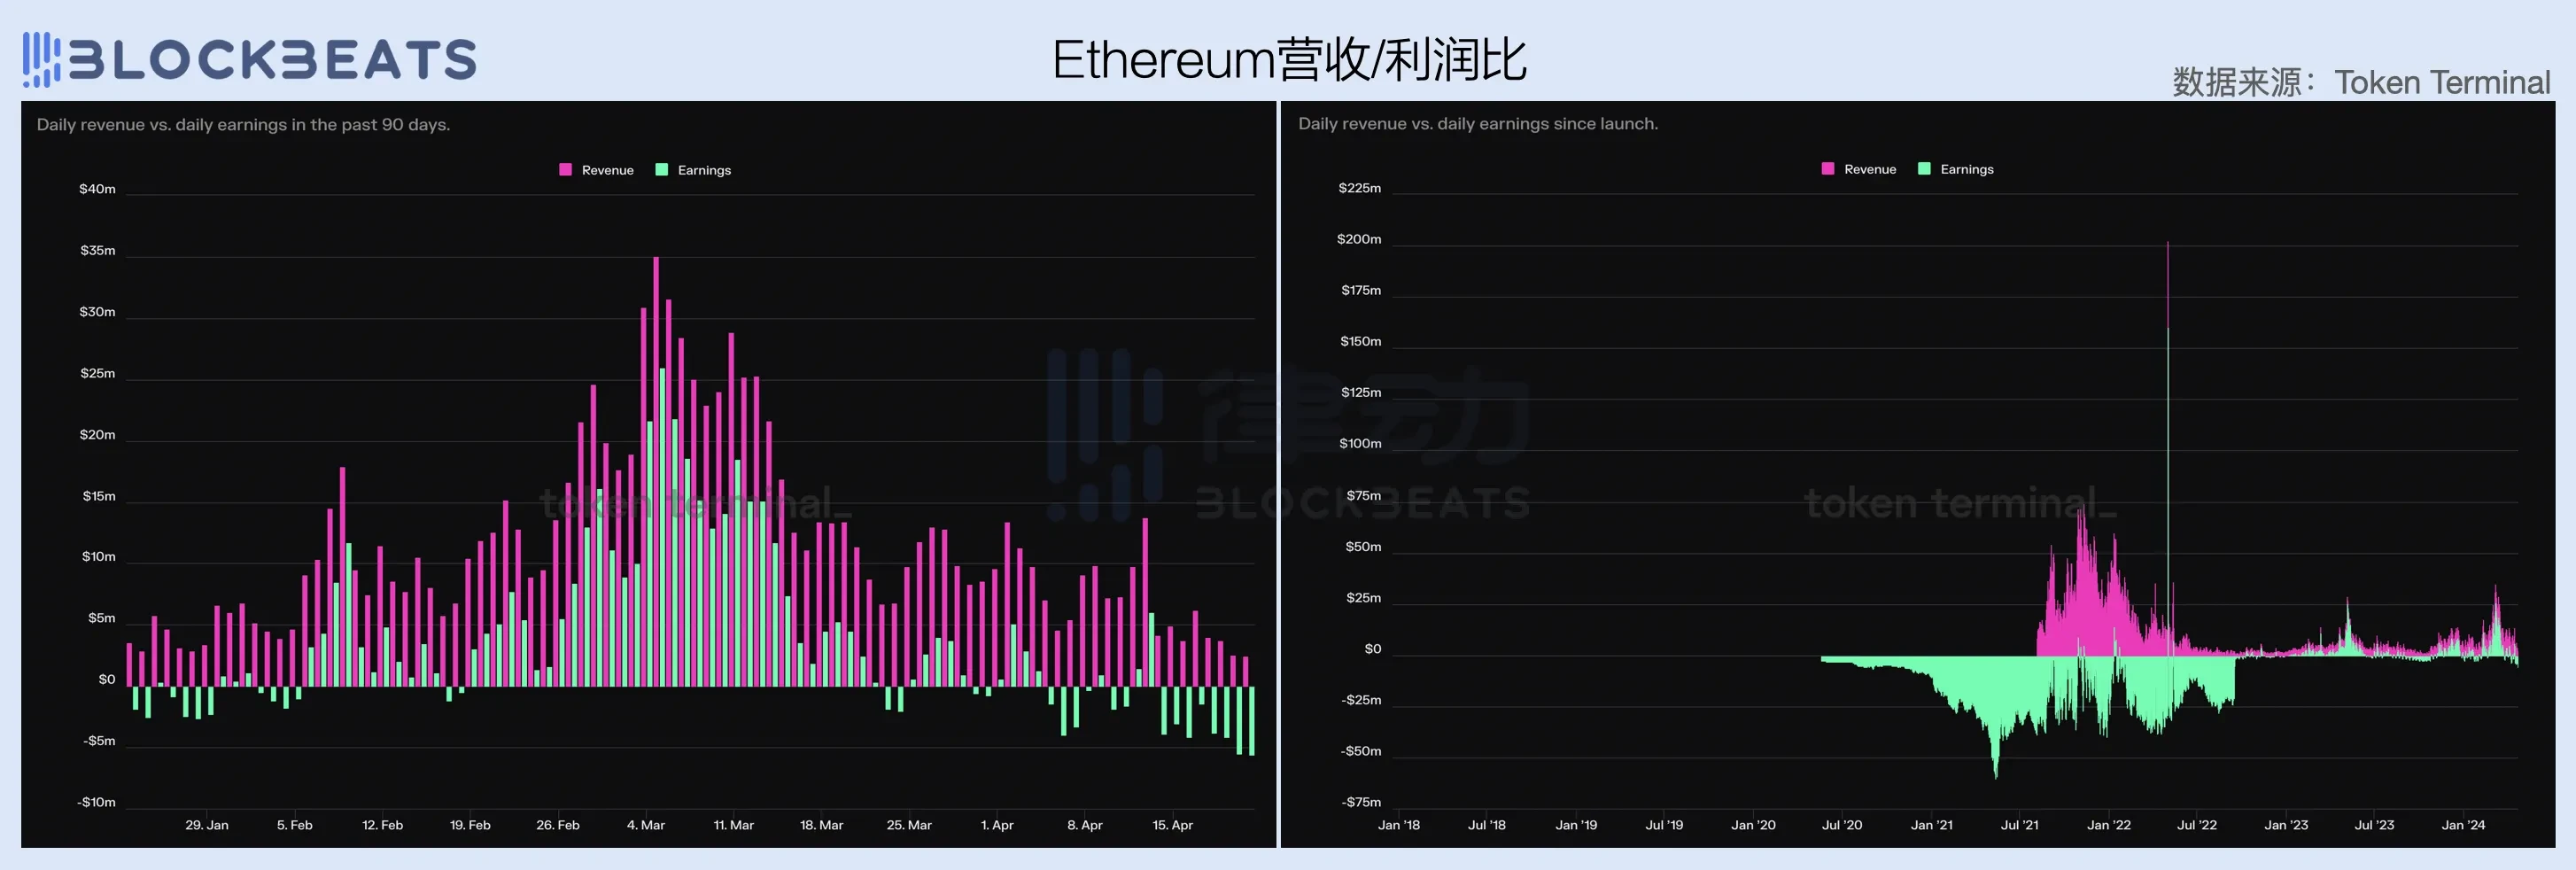
Looking into it further, the Ethereum network turned a profit in February and continued to grow its revenue throughout the first quarter, with a revenue of 606 million USD in March, accounting for 51.7% of the quarterly revenue. In March, with Bitcoin prices hitting a historic high and the crypto market sentiment soaring, Ethereum network's average gas fees per transaction and total fee income saw significant increases due to the surge in on-chain transaction volume.
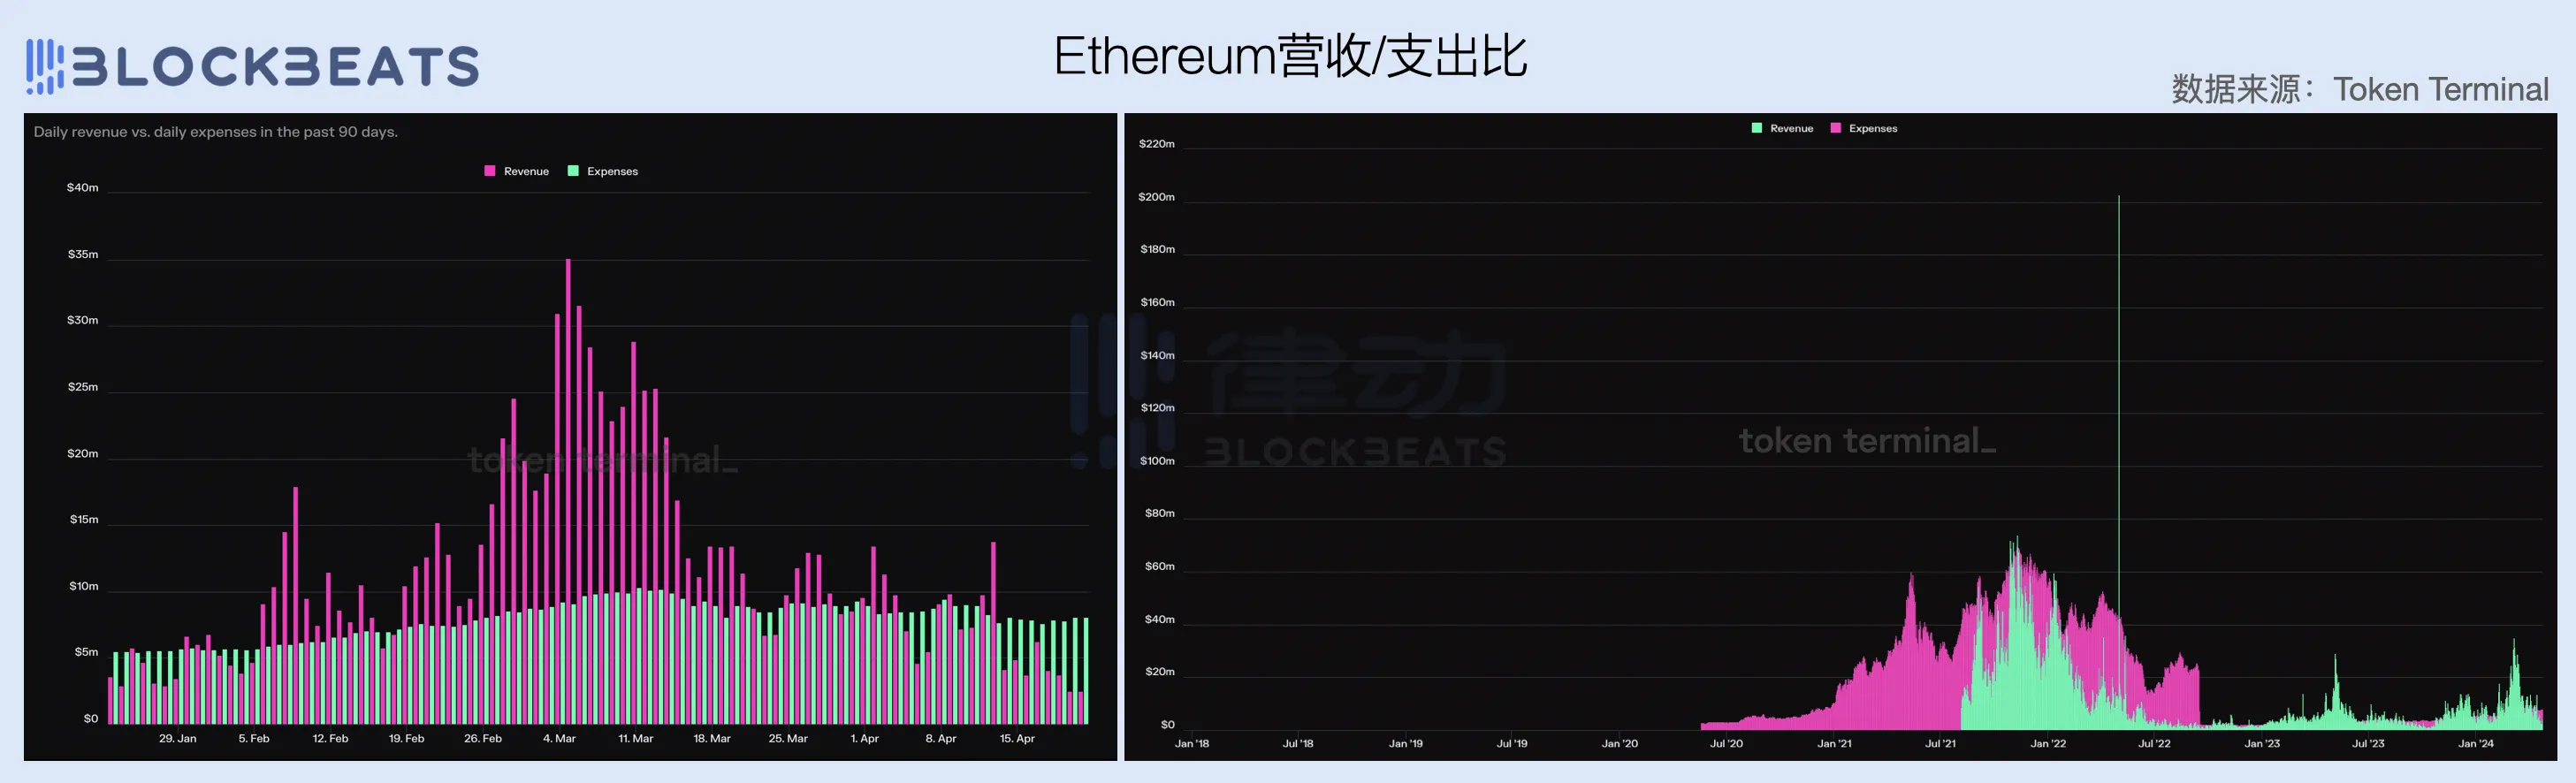
In terms of the comparison between network revenue and operating costs, the Ethereum network's operating costs have remained relatively stable, hovering around 4 million USD per day since the merge in September 2022. However, with the rise in ETH prices and block space demand, this number has been climbing since mid to late February and currently stands at around 8 million USD per day.
In terms of revenue, Ethereum introduced the gas buyback and burn mechanism with the implementation of EIP-1559 in August 2021, which truly began to generate network revenue. EIP-1559 stipulates that all base fees required for each transaction will be burned, so the network's revenue is directly proportional to the on-chain transaction volume and block space demand. The more on-chain transactions and the greater the block space demand, the higher the average base fee burned.
However, it is worth noting that when we extend our observation to the previous bull market, Ethereum's current revenue-generating ability has actually decreased, which is strongly related to market cycles. In comparison, during the peak of the bull market at the end of 2021, Ethereum's daily average revenue was roughly three times what it is now.
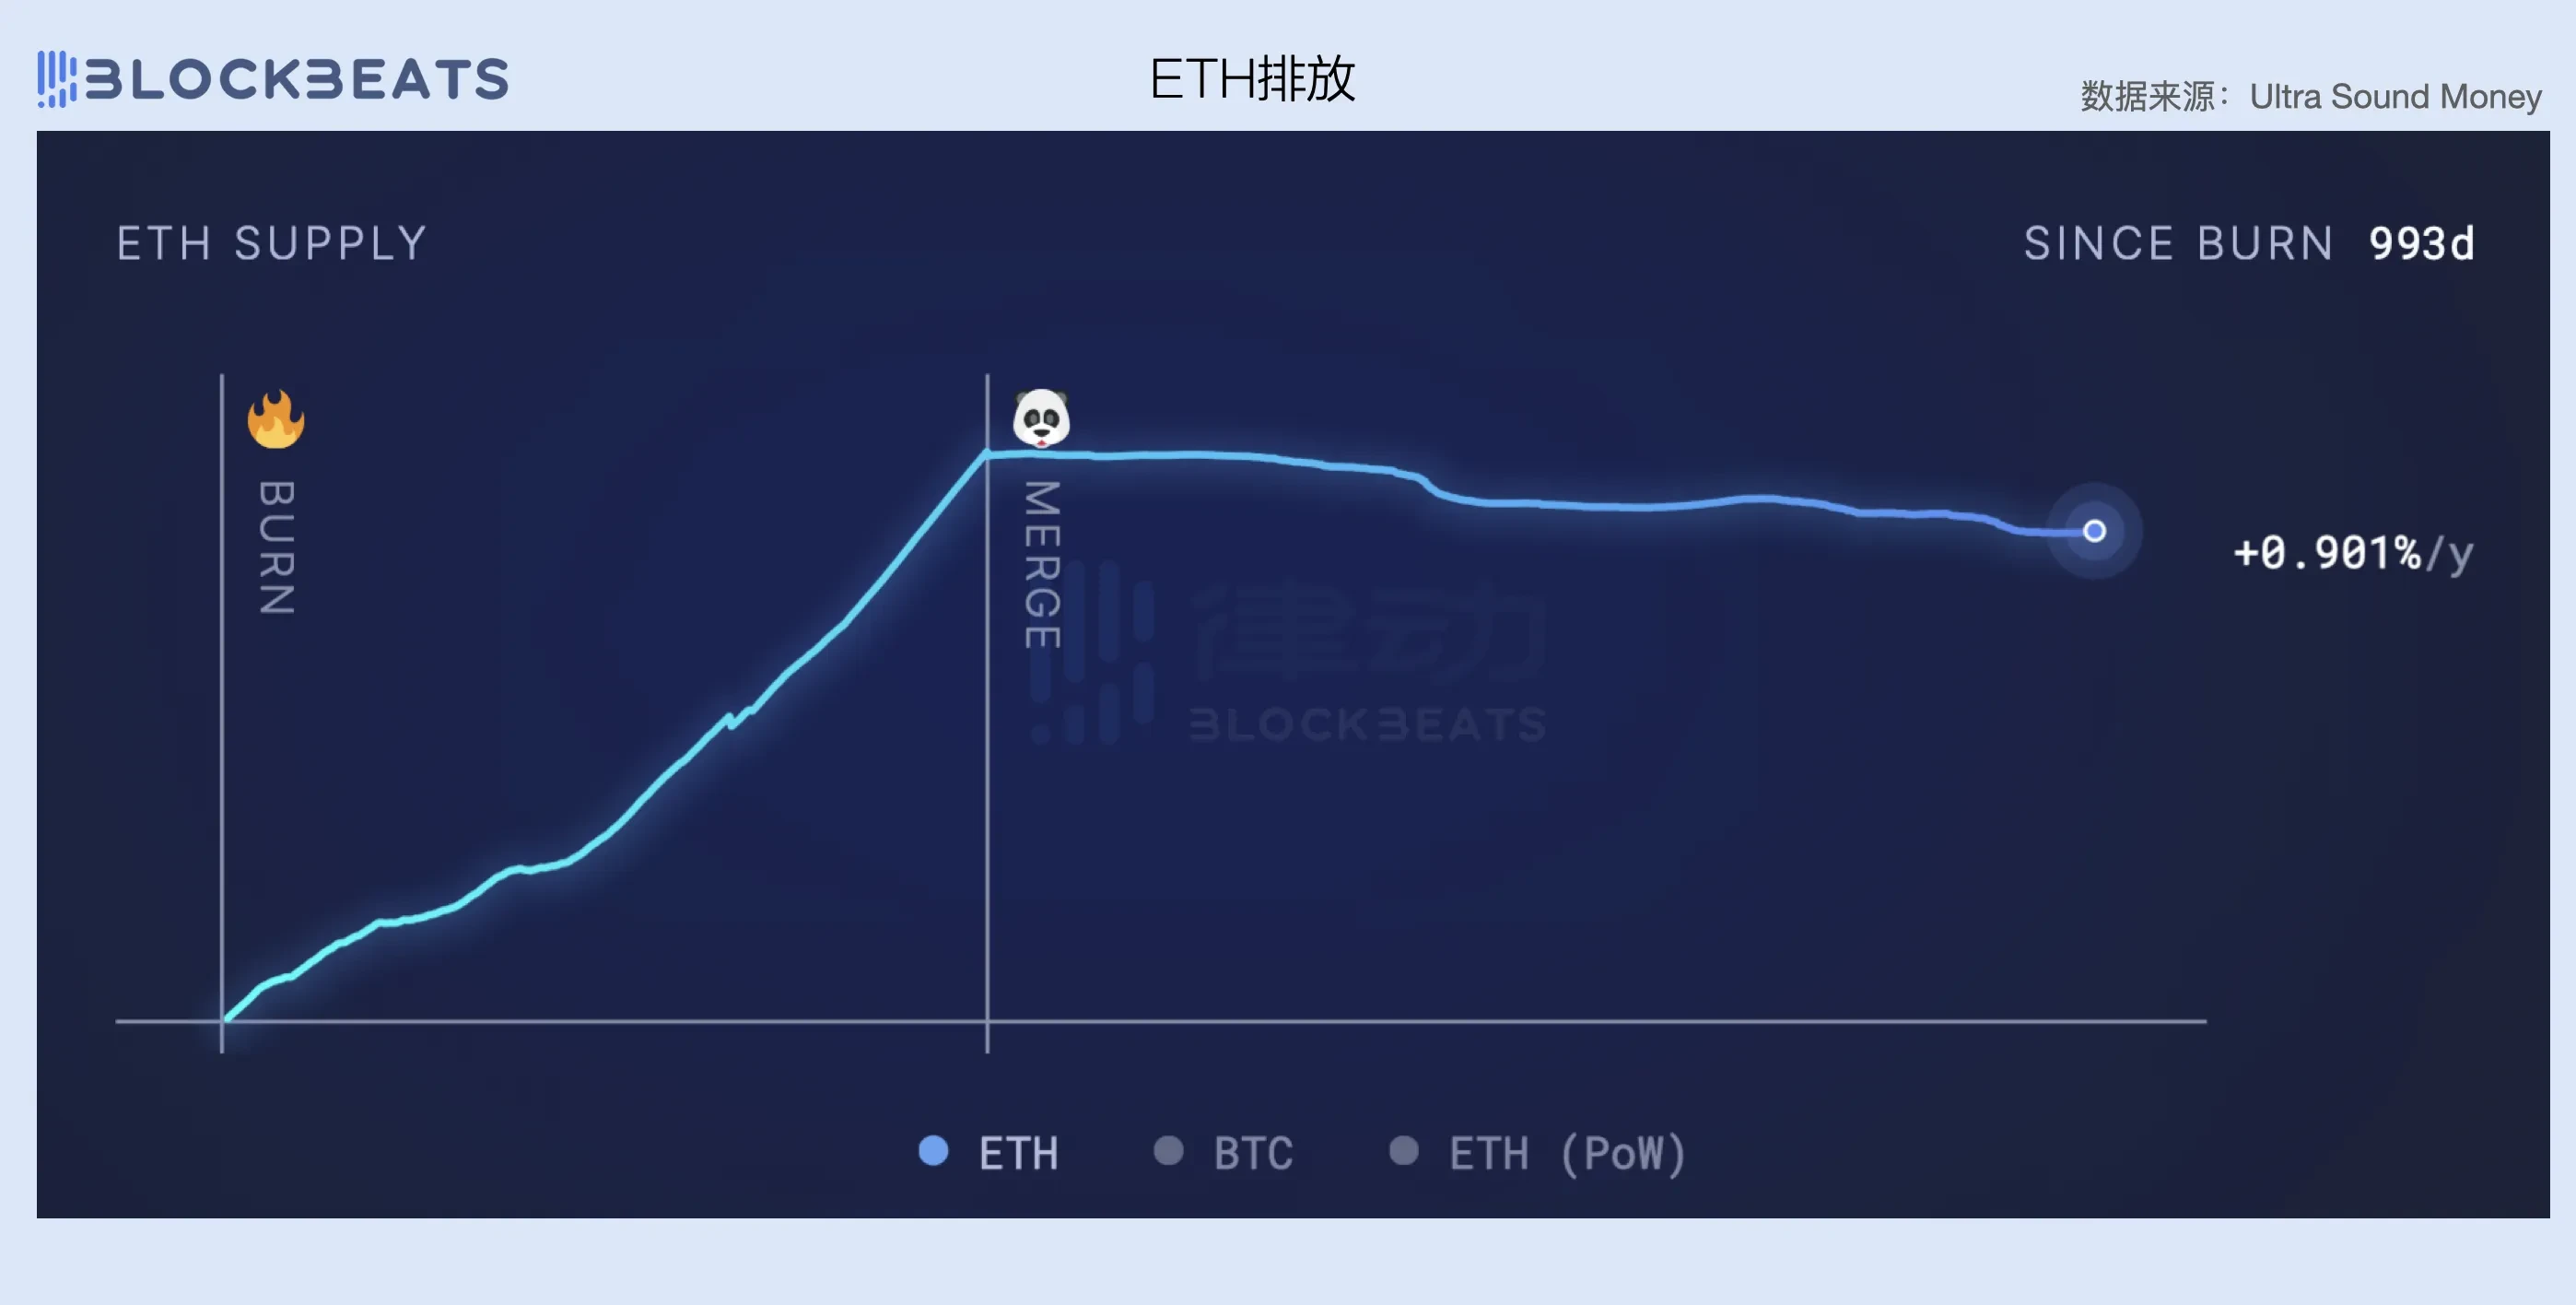
Another point to note is that the transition to PoS has indeed become a key factor in Ethereum achieving a balance between revenue and expenses. Before the merge, Ethereum still needed economically intensive labor such as GPU miners to maintain its network, which resulted in very high operating costs paid to miners. According to the Ethereum official website, before the merge, Ethereum had to pay miners 2 ETH in operating costs every 13.3 seconds (i.e., one block), and including ommer blocks (blocks not included in the longest chain), Ethereum's daily operating costs were about 13,000 ETH.
After the transition to PoS, node validators no longer require high maintenance costs, and the network's operating costs are now based on the total staked ETH (about 14 million ETH), requiring only 1,700 ETH per day, saving the network about 88% of its costs. Therefore, despite the current decline in Ethereum's revenue-generating ability, the network can still maintain a basic balance between revenue and expenses compared to the steep decline in costs.
Looking at the comparison of network revenue and net profit data, the gross profit margin of the Ethereum network has remained at approximately 40% to 70% after the merge, with higher congestion leading to higher gross profit margins. Additionally, the entire network currently needs to maintain a daily revenue of 8 million USD to achieve profitability. For example, although it is not within the scope of the first quarter, the chart below shows that due to market conditions, Ethereum's fee revenue has been declining throughout April, causing the network to enter a loss-making state again after achieving profitability for two consecutive months. It is evident how difficult it is for a chain to be self-sufficient.
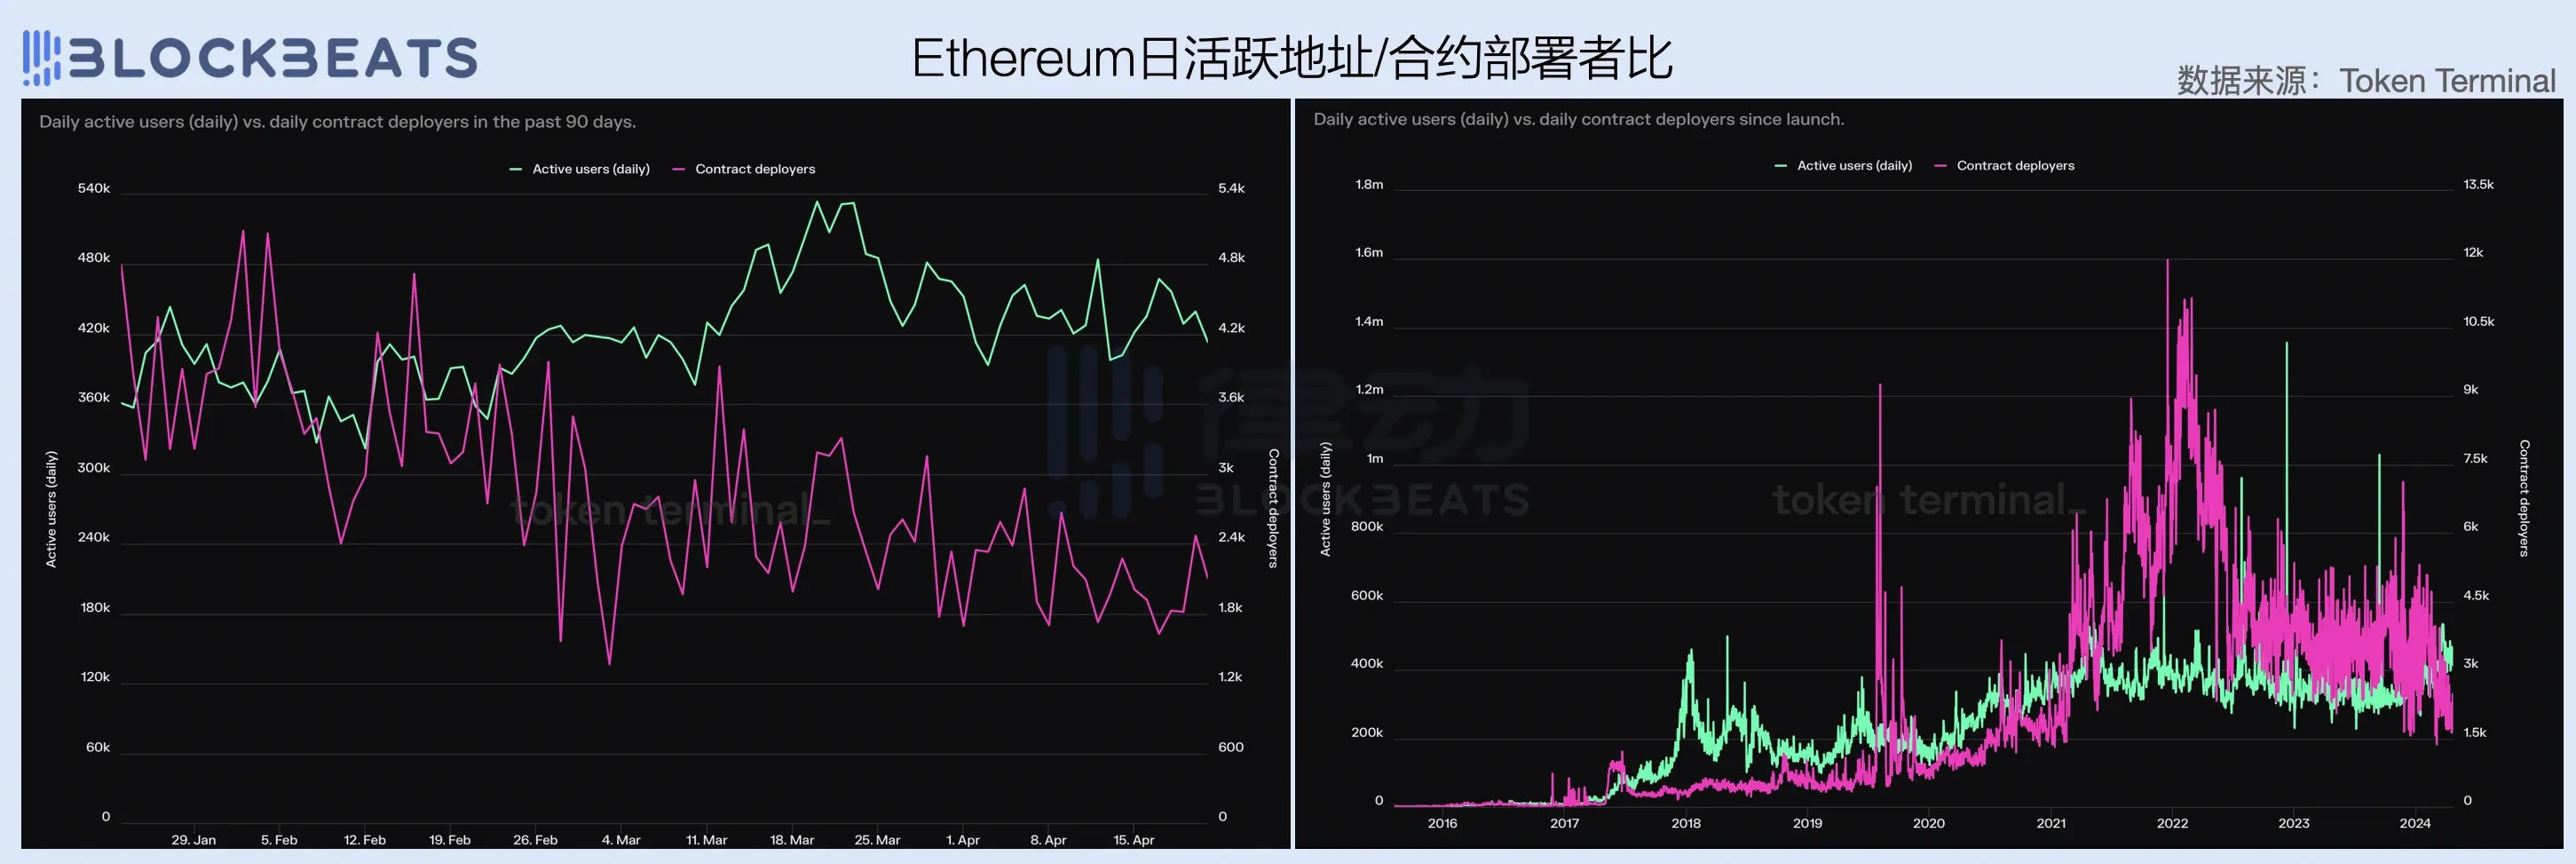
Further observation of the comparison between daily active addresses and contract deployers (ecosystem developer data proxy) on the Ethereum network provides additional insights. In the first quarter, the daily active addresses on the Ethereum network remained at around 420,000, but the number of contract deployers showed a significant decline, dropping from an average of 4,000 per day in January to 2,000 per day in March.
Looking back, the number of ecosystem developers on the Ethereum network seems to have been in a state of stagnation since the end of the previous bull market, and even began to accelerate its decline after February 2024. While the market entered a new upward cycle, the Ethereum network found itself in a predicament of developer exodus and a slowdown in active user growth, which is closely related to the lack of innovative application scenarios within the ecosystem.
During the bull market from 2020 to 2022, exciting native crypto innovations such as DeFi, NFT, GameFi, and SocialFi all emerged from the Ethereum ecosystem, and each narrative had a profound impact on the industry's future development. By 2024, people once again hoped that Ethereum could work miracles and bring about exciting narrative innovations, but at present, apart from the re-staking of Eigen Layer, there are almost no "new things" within the ecosystem that are exhilarating.
On the other hand, this is also due to a mismatch between market expectations and industry development trends. The innovative development of an industry and the capital effects it brings often show a cause-and-effect relationship. Similarly, just because the crypto market cycle occurs every four years, it does not mean that industry innovation should also follow the same rhythm. Of course, there are industries such as AI and nuclear fusion that rely on financial leverage to drive technological progress, but clearly blockchain and Web3 are not in this category.
More importantly, the crypto market in the past few months has been largely driven by Bitcoin ETF funds, and the macro environment has not brought significant liquidity injection to the market. In the realm of altcoins, it is more of a game between existing funds. In this context, the meme frenzy of Solana and the brewing "Base Season" narrative undoubtedly siphon off the Ethereum ecosystem.
Without playing the "low gas" and "mass consumption" cards, the core issue that the foundation and top VCs need to consider is how to increase the demand for blocks sold by the Ethereum network.
Solana: Burning Through Money to Drive Revenue
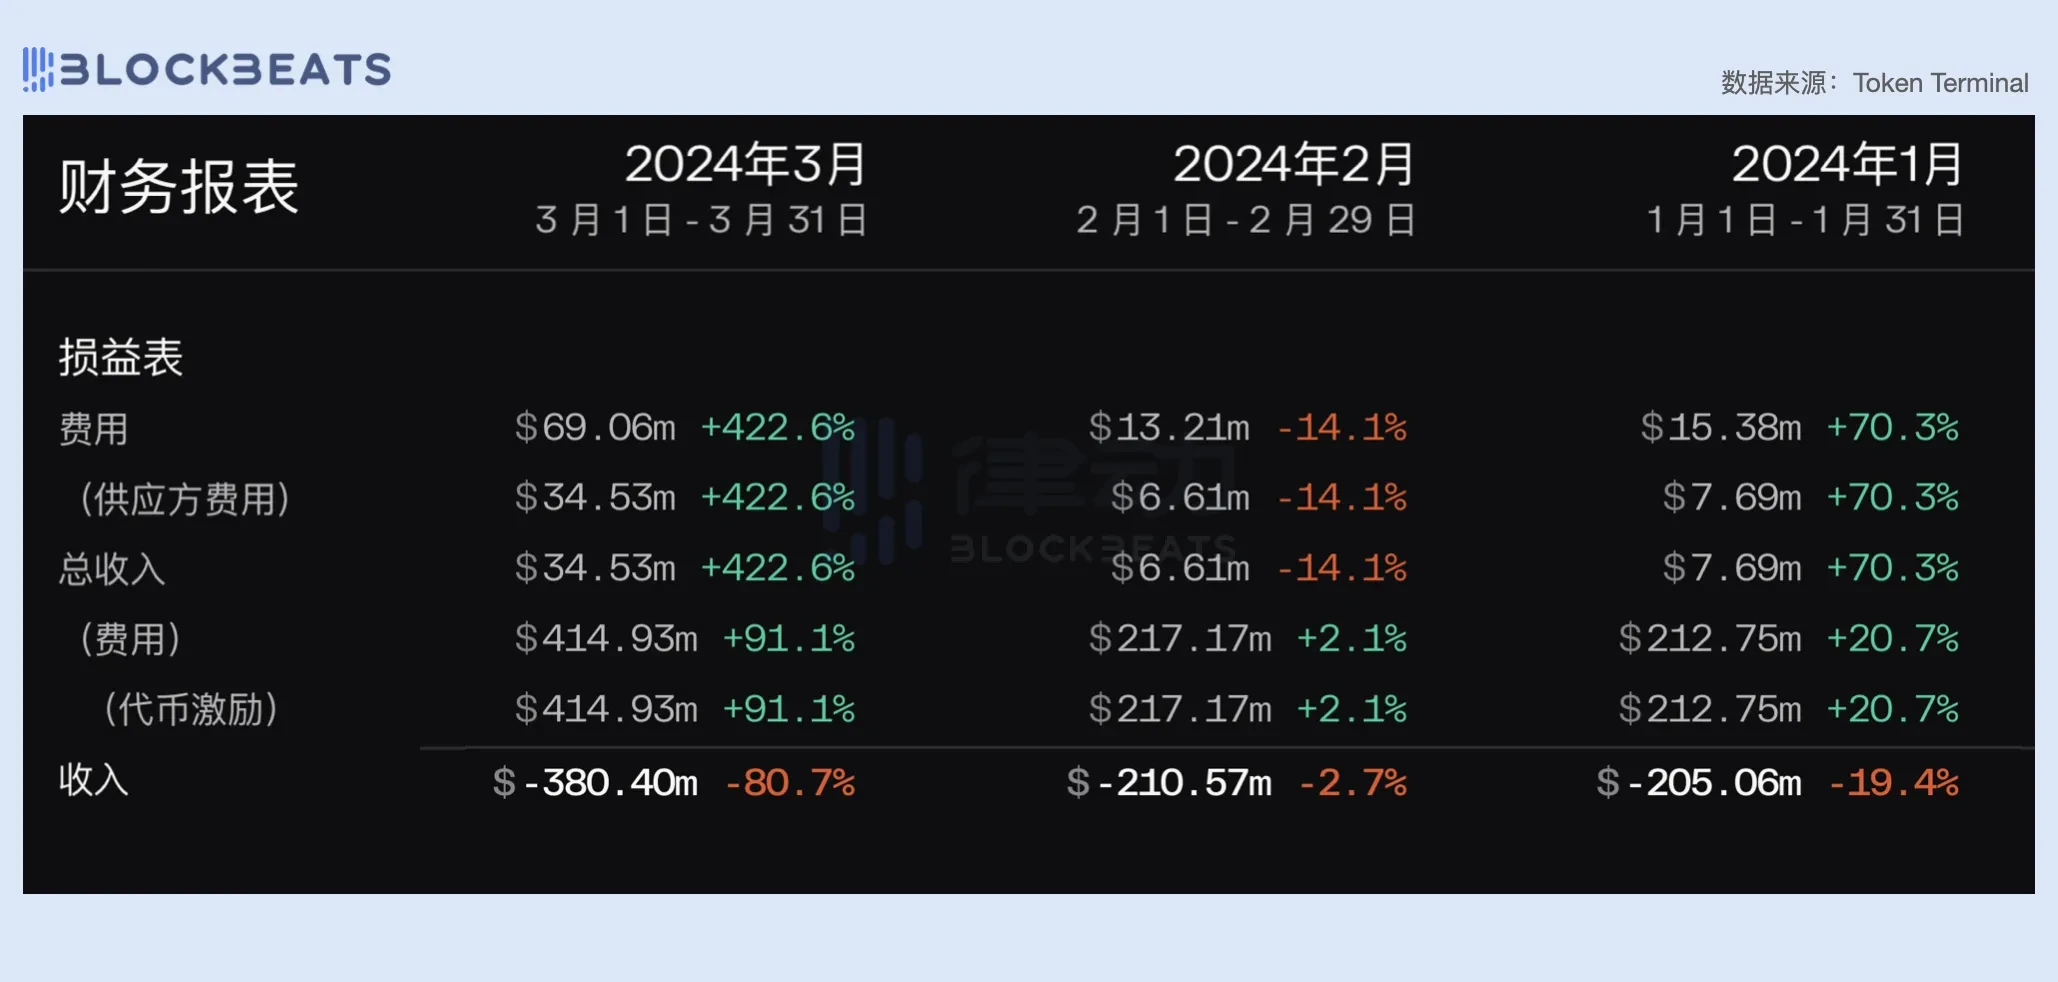
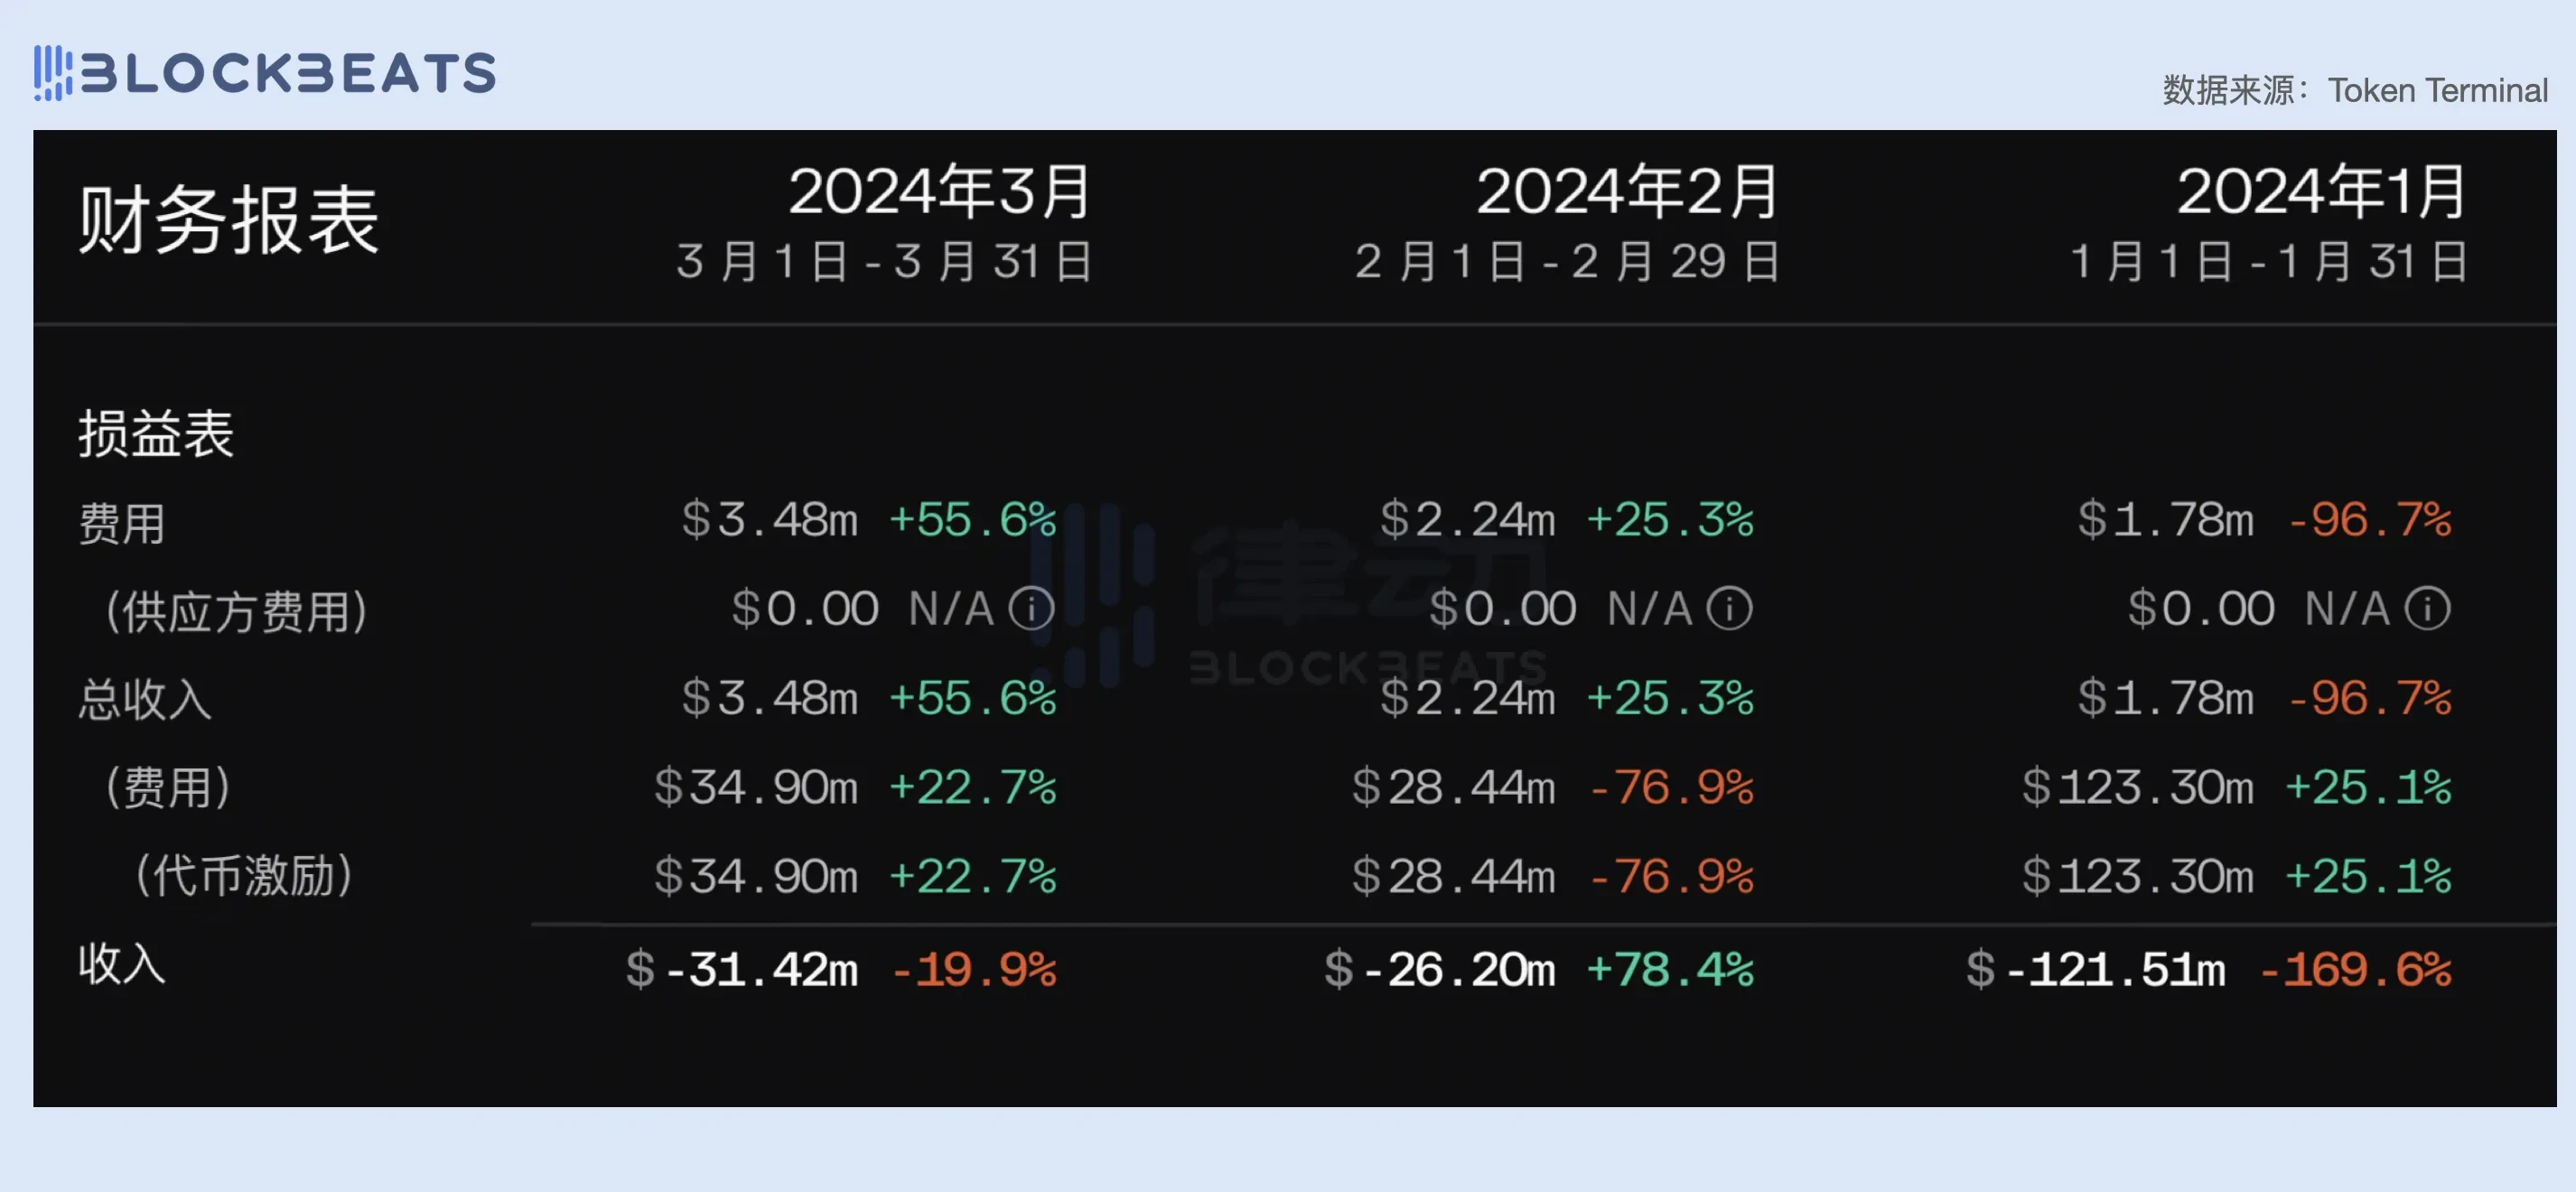
Compared to Ethereum, which has essentially achieved a balance between revenue and expenses, Solana is still in a clear "burning money phase," with an overall loss of 797 million USD in the first quarter, of which 380 million USD was lost in the third quarter, accounting for 47.6%. With the rise in SOL prices, Solana's network operating costs have continued to rise over the past quarter, increasing from 212 million USD in January to 414 million USD in March, nearly doubling.
However, it is worth noting that despite the significant increase in costs, Solana's revenue in the first quarter grew rapidly, with fee revenue (including supply-side fees) reaching 69 million USD in March, nearly five times the 15.38 million USD in January. This was due to the continuous meme frenzy within the Solana ecosystem in March and the surge in transaction volume and priority fees brought about by ORE mining, but it is still a drop in the bucket compared to the network's cost outlay.
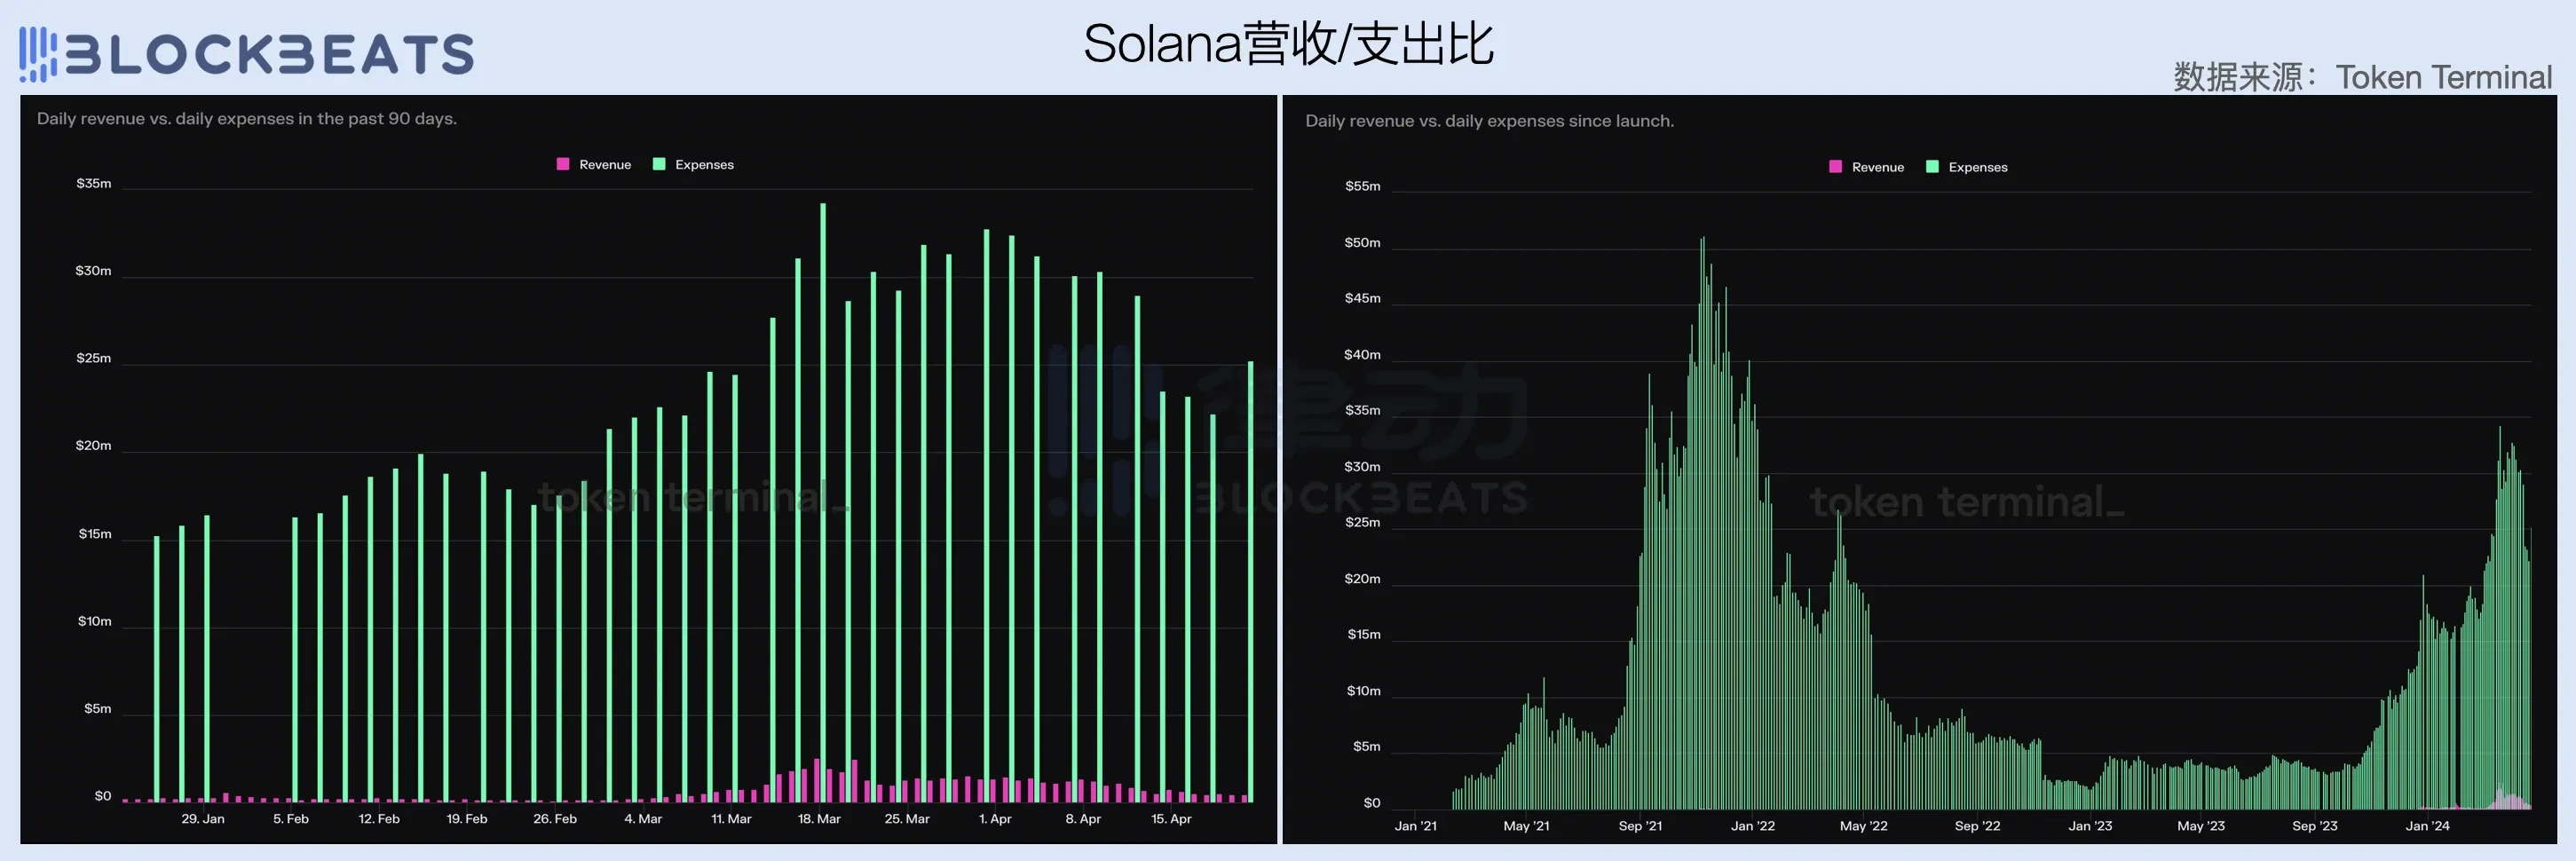
Looking at the comparison of network revenue and operating costs, Solana's expenditure-to-income ratio in the first quarter remained at 15 to 30 times, meaning that the network needs to spend 15 to 30 USD for every 1 USD earned, resulting in very high customer acquisition costs. However, a longer observation period reveals that achieving this data is already a huge improvement for the Solana network. In the past year and during the previous bull market, Solana's network revenue was almost negligible. In March, Solana's daily revenue reached 1 million USD, a significant increase compared to the daily revenue of 145,000 USD during the peak of the bull market in 2022.
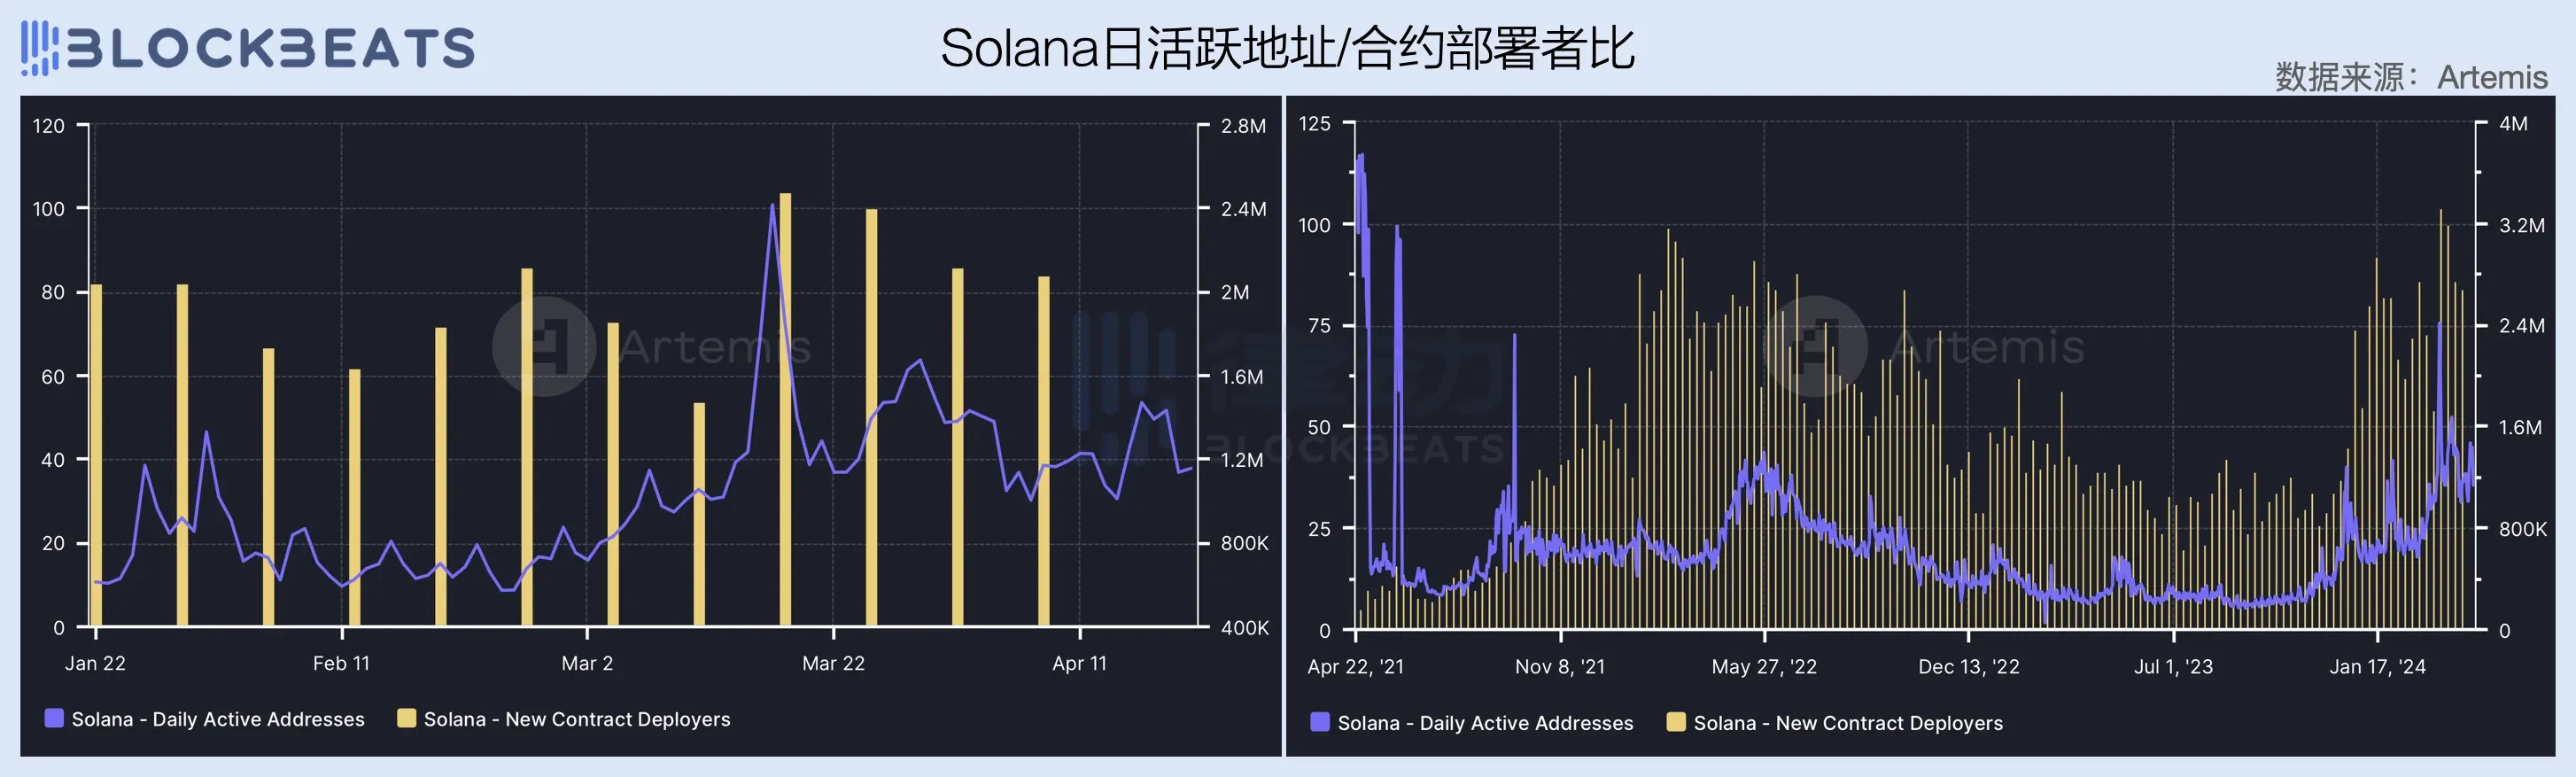
The strengthening of revenue-generating ability is inseparable from the growth of network users. Over the past quarter, Solana's daily active addresses have continued to rise, reaching a historic high of 2.4 million in mid-March with the successive eruption of "meme coins" such as BOME and SLERF. The number of contract deployers on the network has also shown an upward trend since the end of last year and has remained at an average of 80 per day throughout the first quarter.
Compared to Ethereum, Solana's adherence to a non-EVM compatible path has cultivated strong stickiness among developers within the ecosystem, effectively reducing the occurrence of "developer exodus." Additionally, a series of wealth creation waves starting from the JTO airdrop has attracted a large number of external users and developers to the network. However, it is important to note that due to the high growth of current Solana network users being mainly driven by "burning money subsidies," the ecosystem also lacks effective innovative application scenarios. Once the capital subsidies are withdrawn, this growth momentum is likely to quickly dissipate.
On the other hand, although 50% of Solana's transaction fees are used for buyback and burn, the significant increase in transaction volume has not brought substantial revenue, which indirectly reflects the existence of certain issues in Solana's fee mechanism.
Similar to Ethereum, Solana's fee mechanism is divided into base fees and priority fees, but unlike Ethereum's dynamic base fee mechanism, Solana's base fee is measured statically in Lamports (generally 0.000005 SOL), while the priority fee is measured in compute units required per transaction.
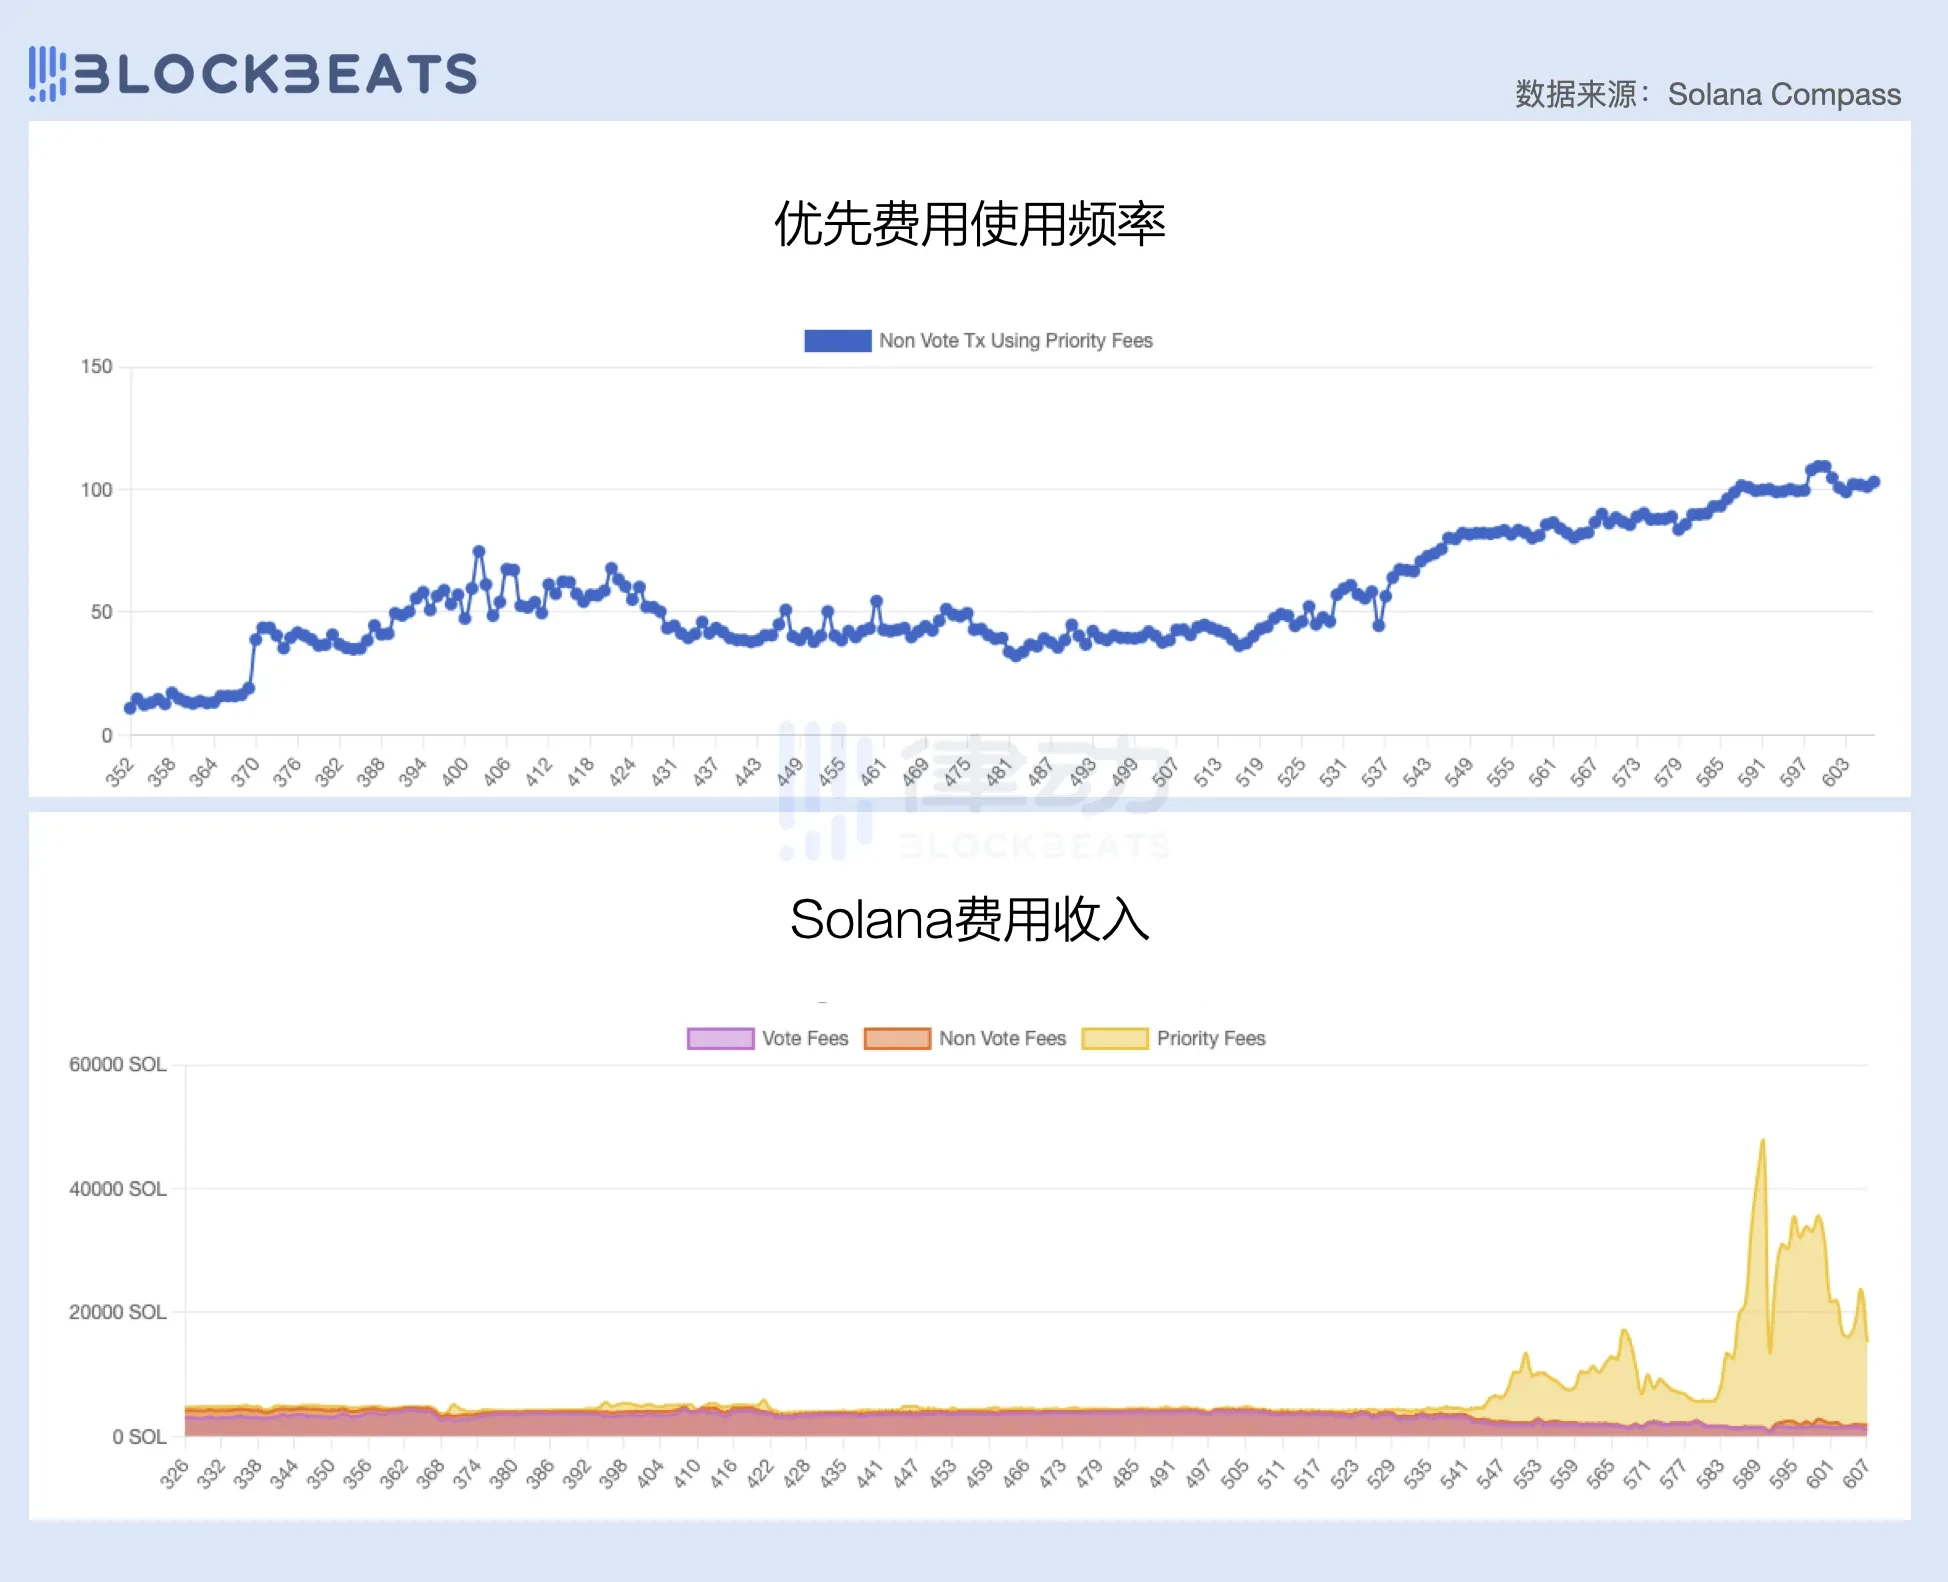
In the following image, it can be seen that since the beginning of the year, the proportion of priority fees has been continuously increasing, and most of Solana's fee revenue comes from priority fees. According to data from The Block, in January, Solana achieved a record high fee revenue of 15.6 million USD, with 11.9 million USD coming from priority fees, accounting for 92% of non-voting transaction fees.
However, many people have experienced a poor user experience on the Solana network in the past month, and it seems that the current priority fee mechanism does not effectively address the issue of pricing block space for specific transactions. Although setting priority fees can increase the chances of transactions being included in blocks, due to the nature of continuous block production on Solana, setting higher priority fees does not guarantee that transactions will be included in blocks earlier.
The lack of a dynamic fee mechanism for accurately pricing block space has led to many bots using spam to ensure their transactions are included in blocks, as in most cases, the basic fee cost of 0.000005 SOL does not exceed the expected profit after a successful transaction. According to a research report by Umbra Research, due to the high demand for Searcher speed, there are very few arbitrage transactions on the Solana network with priority fees exceeding 0.02 SOL, and approximately 96% of arbitrage attempts on the current Solana network fail.
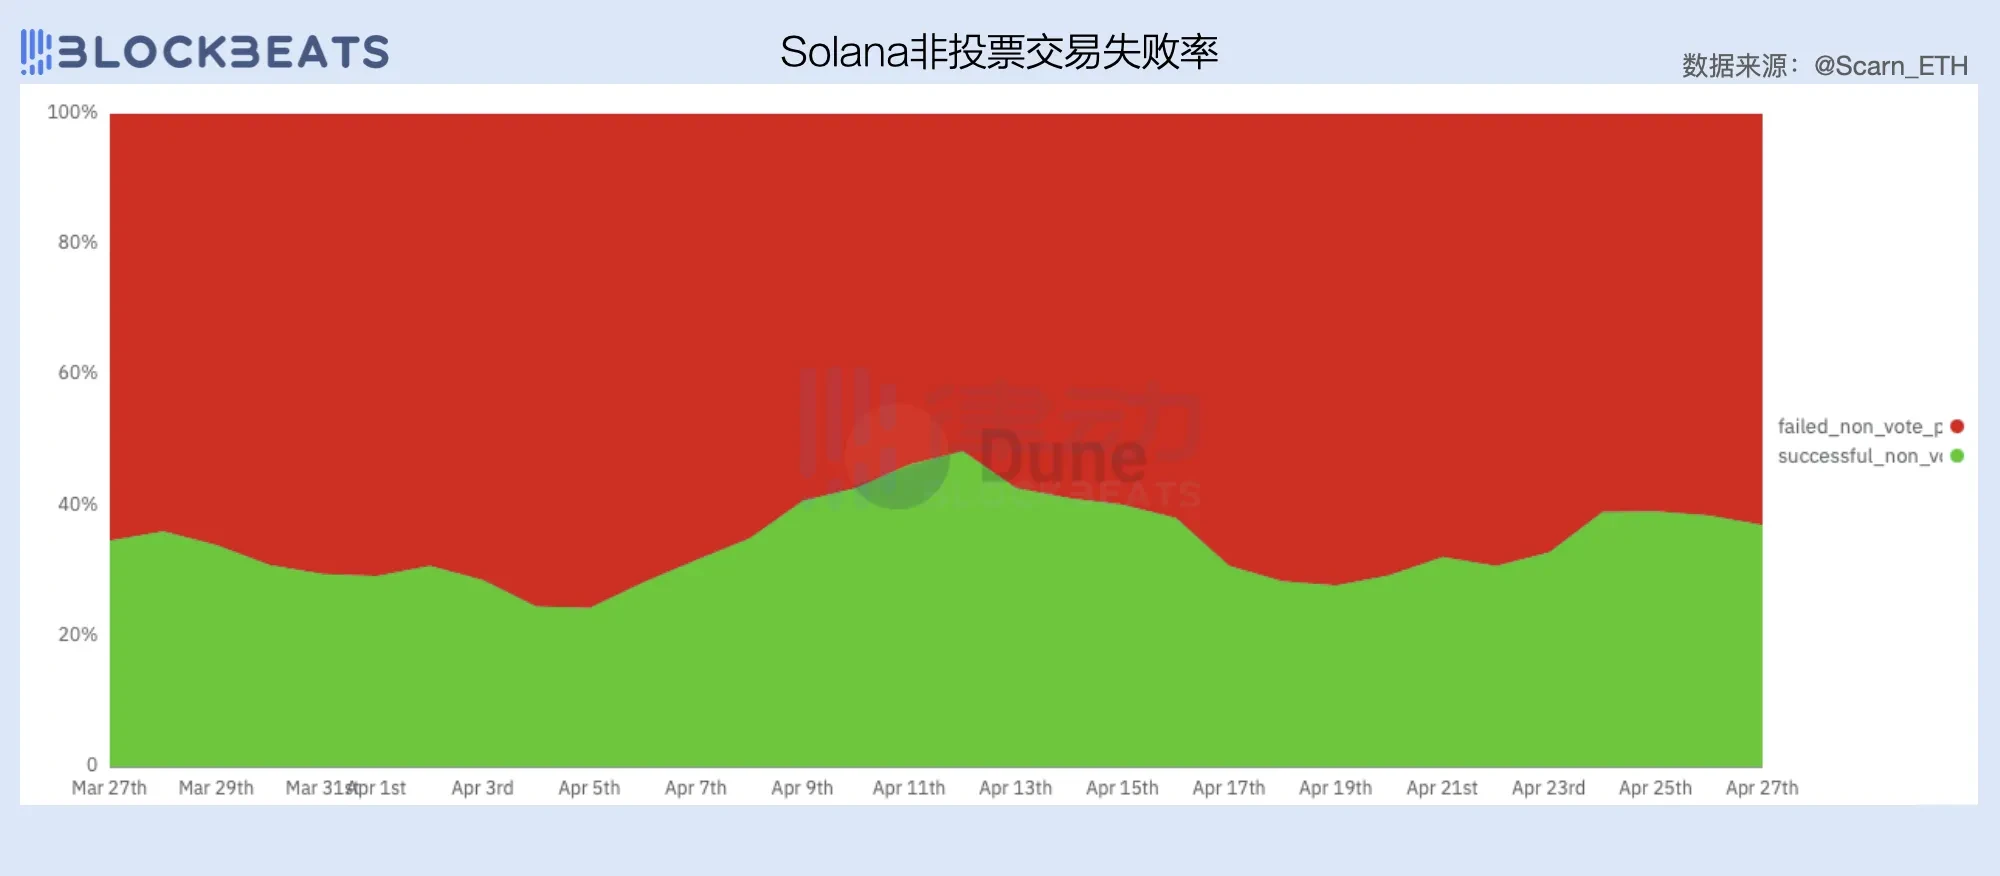
The large number of failed transactions has severely consumed block space, affecting not only the value capture efficiency of validators responsible for producing blocks but also causing a loss of users and transaction volume. After Jito's MEV pool was closed in early March, Solana urgently needs to find a cost-effective solution to effectively price block space and increase network fee revenue.
In addition to facing revenue growth challenges, Solana needs to put in more effort in cost control to achieve a balance between revenue and expenses.
To maintain a high-performance network, the costs paid to "super nodes" by the Solana network are inevitably high. According to Solana's inflation plan, the initial annual inflation rate of the network is 8%, decreasing at a rate of 15% per year, ultimately maintaining the annual inflation rate at 1.5%.
The good news is that Solana's design follows Moore's Law and promises to double the network's scalability every two years through the development of CPUs and other technologies, which means accommodating more users and generating higher fee revenue. The downside is that it will take approximately 10 years for Solana to reach the target inflation level, and until then, the network is likely to remain in a loss-making state.
Although using "low gas" to compete with Ethereum has indeed been effective, it is akin to reducing prices to promote sales of electric vehicles; no matter how fierce the price war, a way to make a profit must be found. Low fees mean that the selling point of Solana is no longer block premium, and achieving high transaction volume becomes crucial for survival. The question for investors is, how long can their money continue to burn?
Avalanche: Gradually Losing the Ability to Generate Revenue
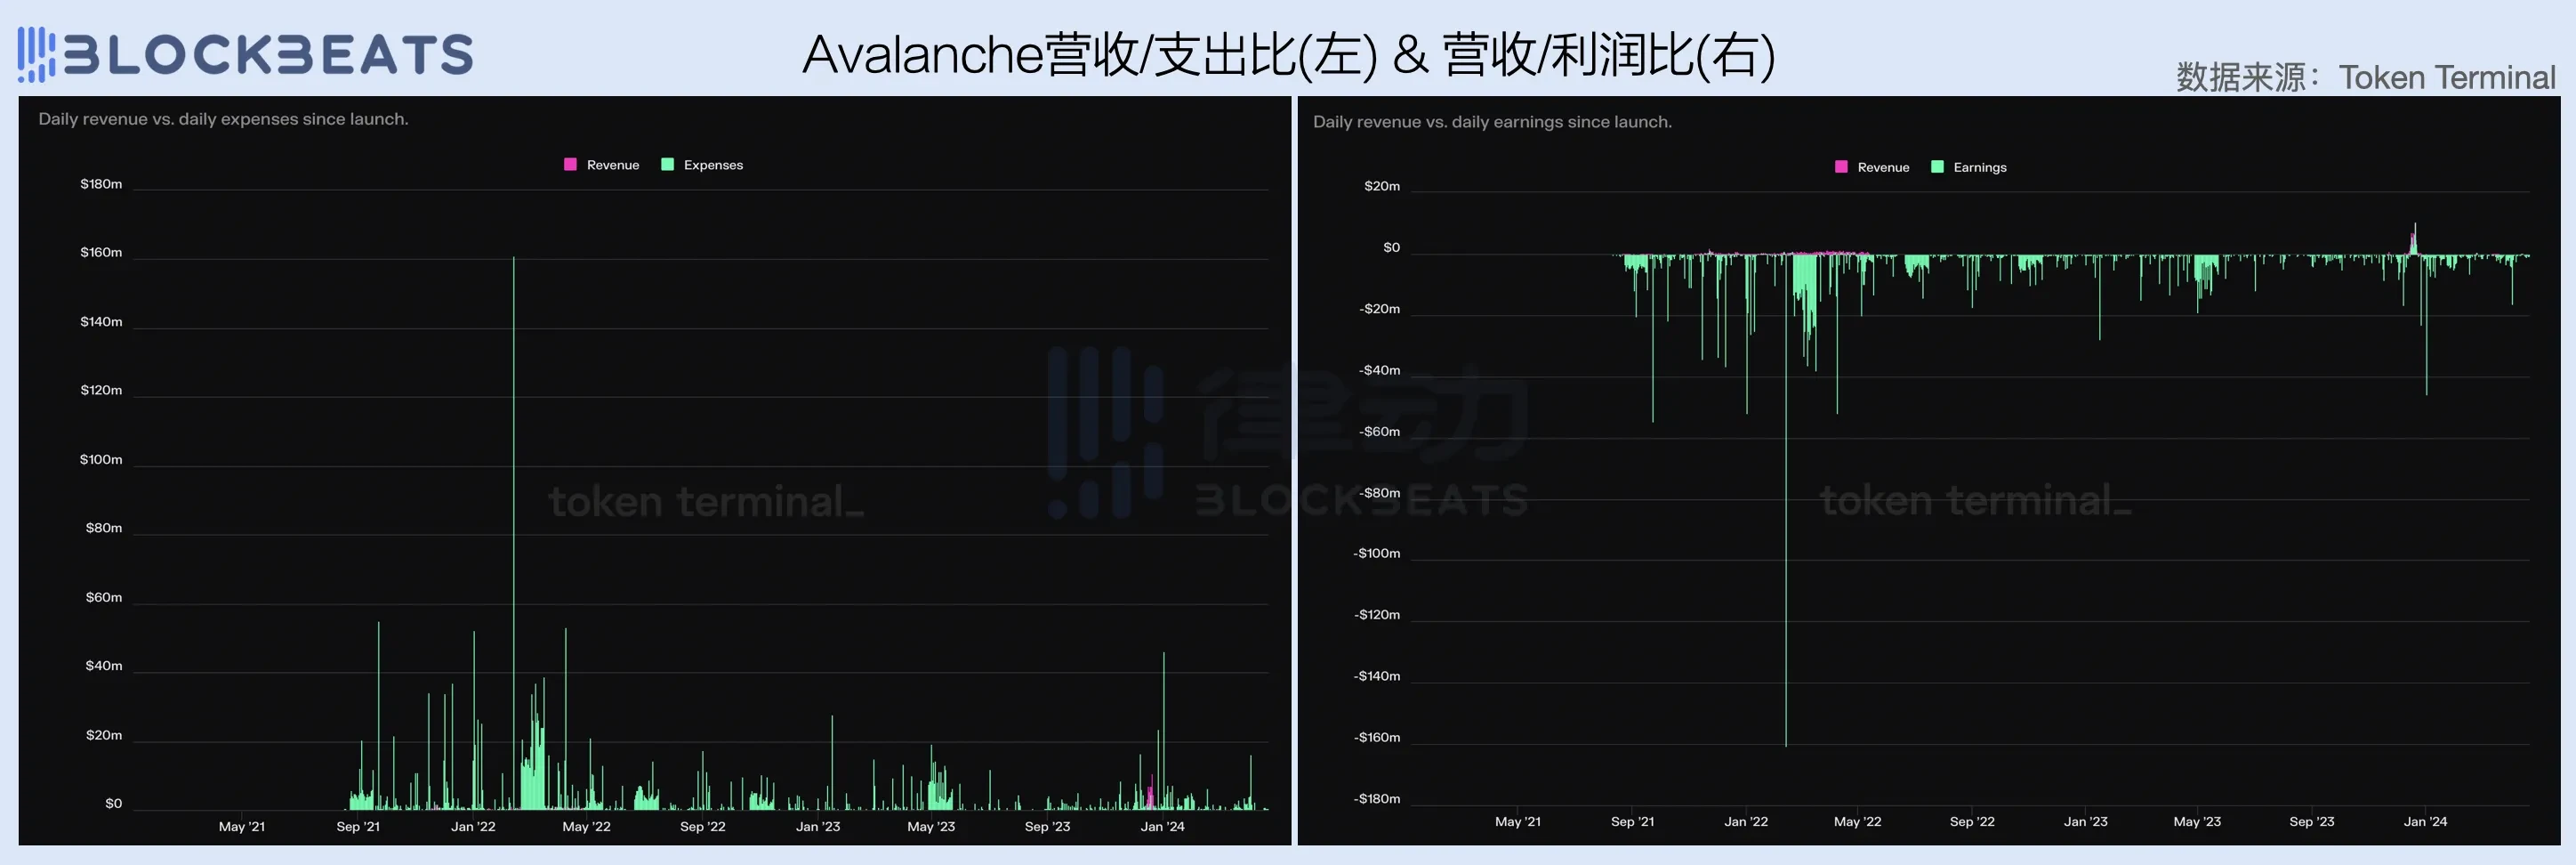
Compared to the previous two, Avalanche's situation is the most severe, with almost no revenue generated throughout the entire first quarter, while also incurring relatively high operating costs. This is largely related to the lack of attractiveness of applications within the Avalanche ecosystem in recent times. Since the end of last year, Avalanche has passively followed industry trends, first with the AVAV following the trend of inscriptions, and then the foundation lagging behind in launching a meme foundation. While it did ride the wave of traffic, the overall revenue-generating ability has been unproductive.
Although Avalanche has allocated 100% of transaction fees for buyback and burn, a longer observation reveals that, except for the brief profitability achieved through AVAV during the "EVM inscription frenzy" period, the rest of the time has been a frenzy of "burning money" similar to Solana.
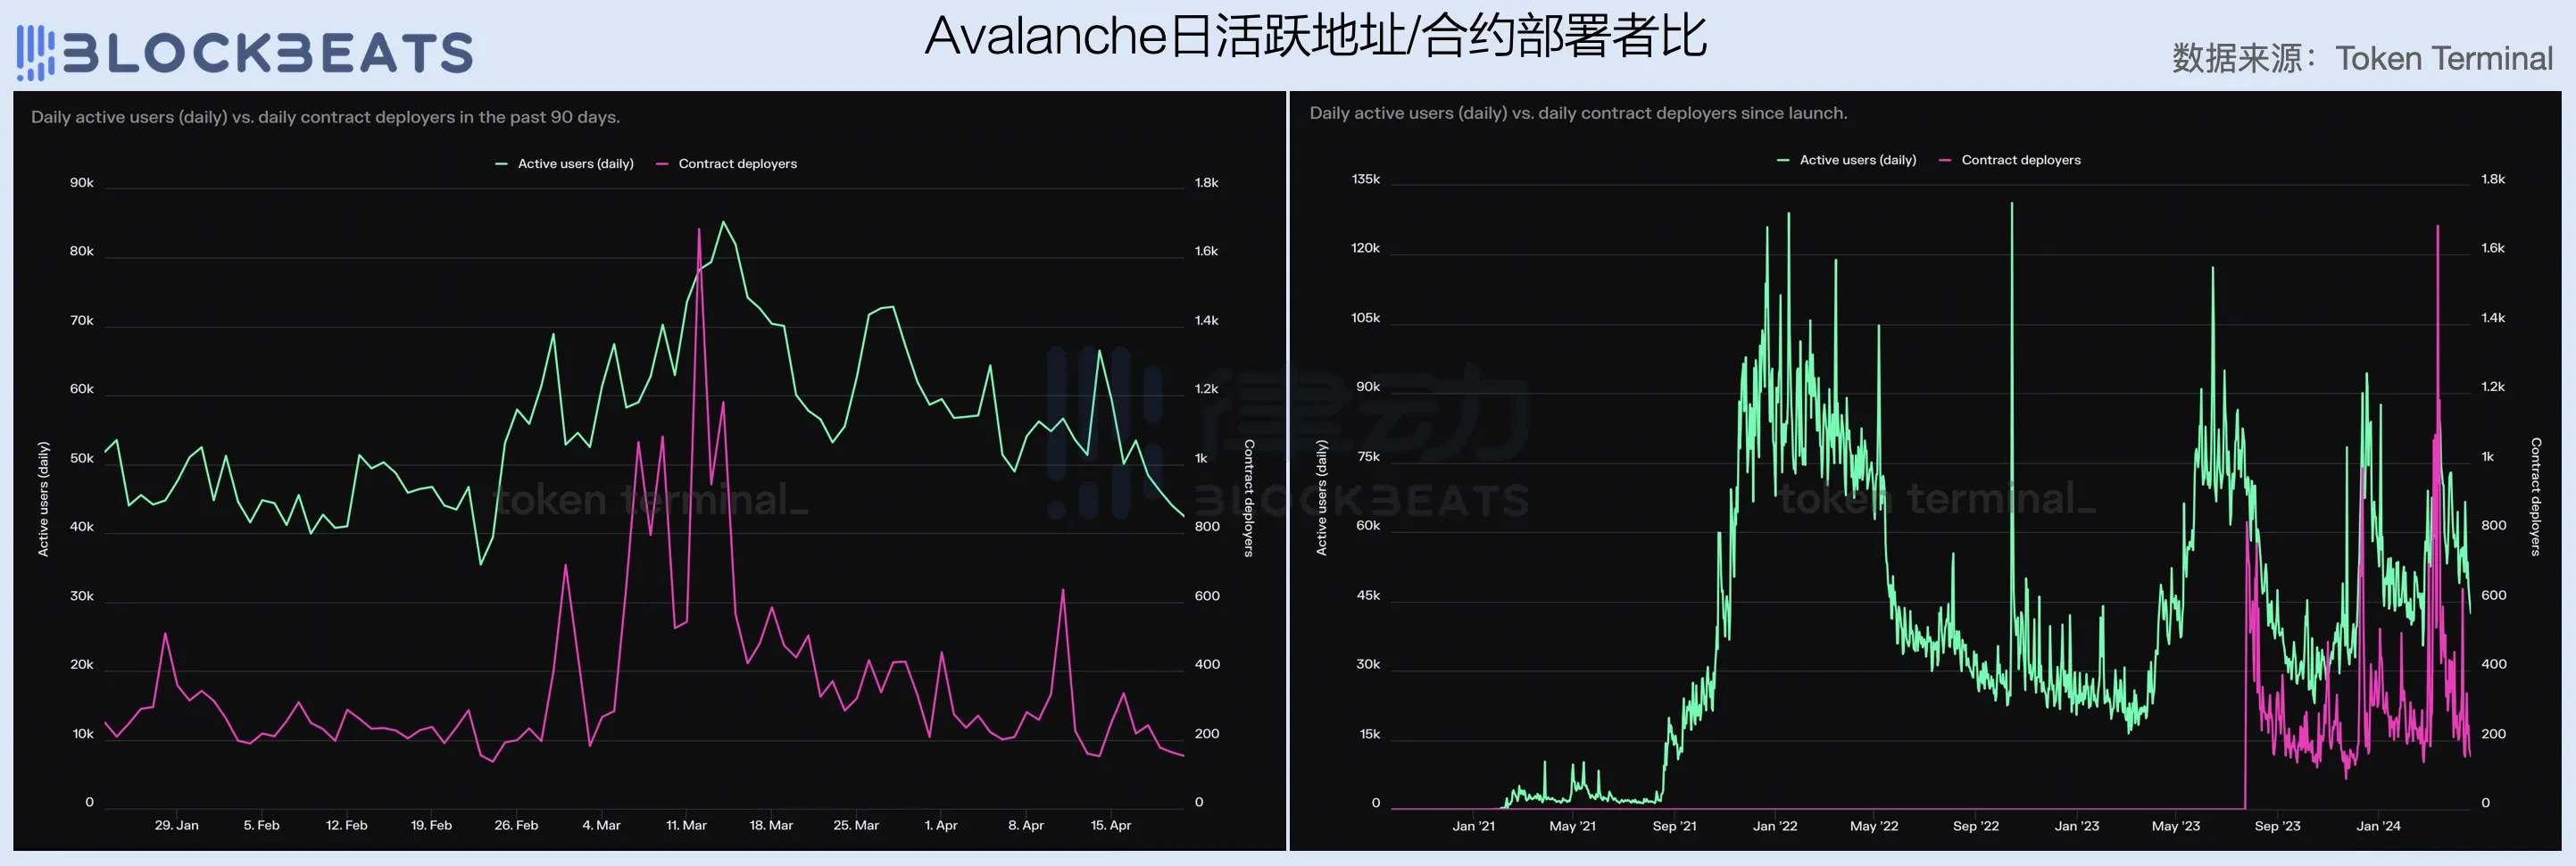
Looking at the number of daily active addresses and contract deployers, the user and developer numbers within the Avalanche ecosystem have severely declined in the first quarter, and long-term observations show extremely high volatility, indicating low user stickiness and a significant impact from market conditions and hotspots.
Actually, the somewhat pessimistic data for Avalanche in the first quarter to some extent reflects the challenges and difficulties faced by current EVM public chains, and even those that boast new languages and narratives. In an industry where user base growth is slow and there is an oversupply of block space in a stock market, it is difficult for products with similar user experiences to stand out in the market and compete with giants like Ethereum and Solana. Similar to the battles of the internet era, most public chains have chosen to burn money, but the same question remains: if there is no hope in sight, how long will capital be willing to persist?
L2 for Profit
High operating costs and high revenue uncertainty make it particularly difficult for public chain startups, which is why the top 10 market cap list in the crypto field has seen such frequent and drastic iterations over the past 10 years. However, with the emergence of modular trends led by Celestia and the development of RaaS infrastructure such as Altlayer, the industry has gradually explored a more certain entrepreneurial opportunity than public chains—L2.
The operating costs of an L2 include early-stage development, running sequencers, and uploading packaged transactions (DA). Excluding development costs, the fee revenue on an L2 can definitely cover the DA costs. Therefore, compared to L1 public chains, L2s almost never face the problem of not making ends meet, as long as the operating costs of the sequencer are low enough, L2 is a lucrative business. With the continuous improvement of related infrastructure for "one-click chain deployment," the cost of L2 entrepreneurship is also constantly decreasing, which is why there has been a recent surge of L2s.
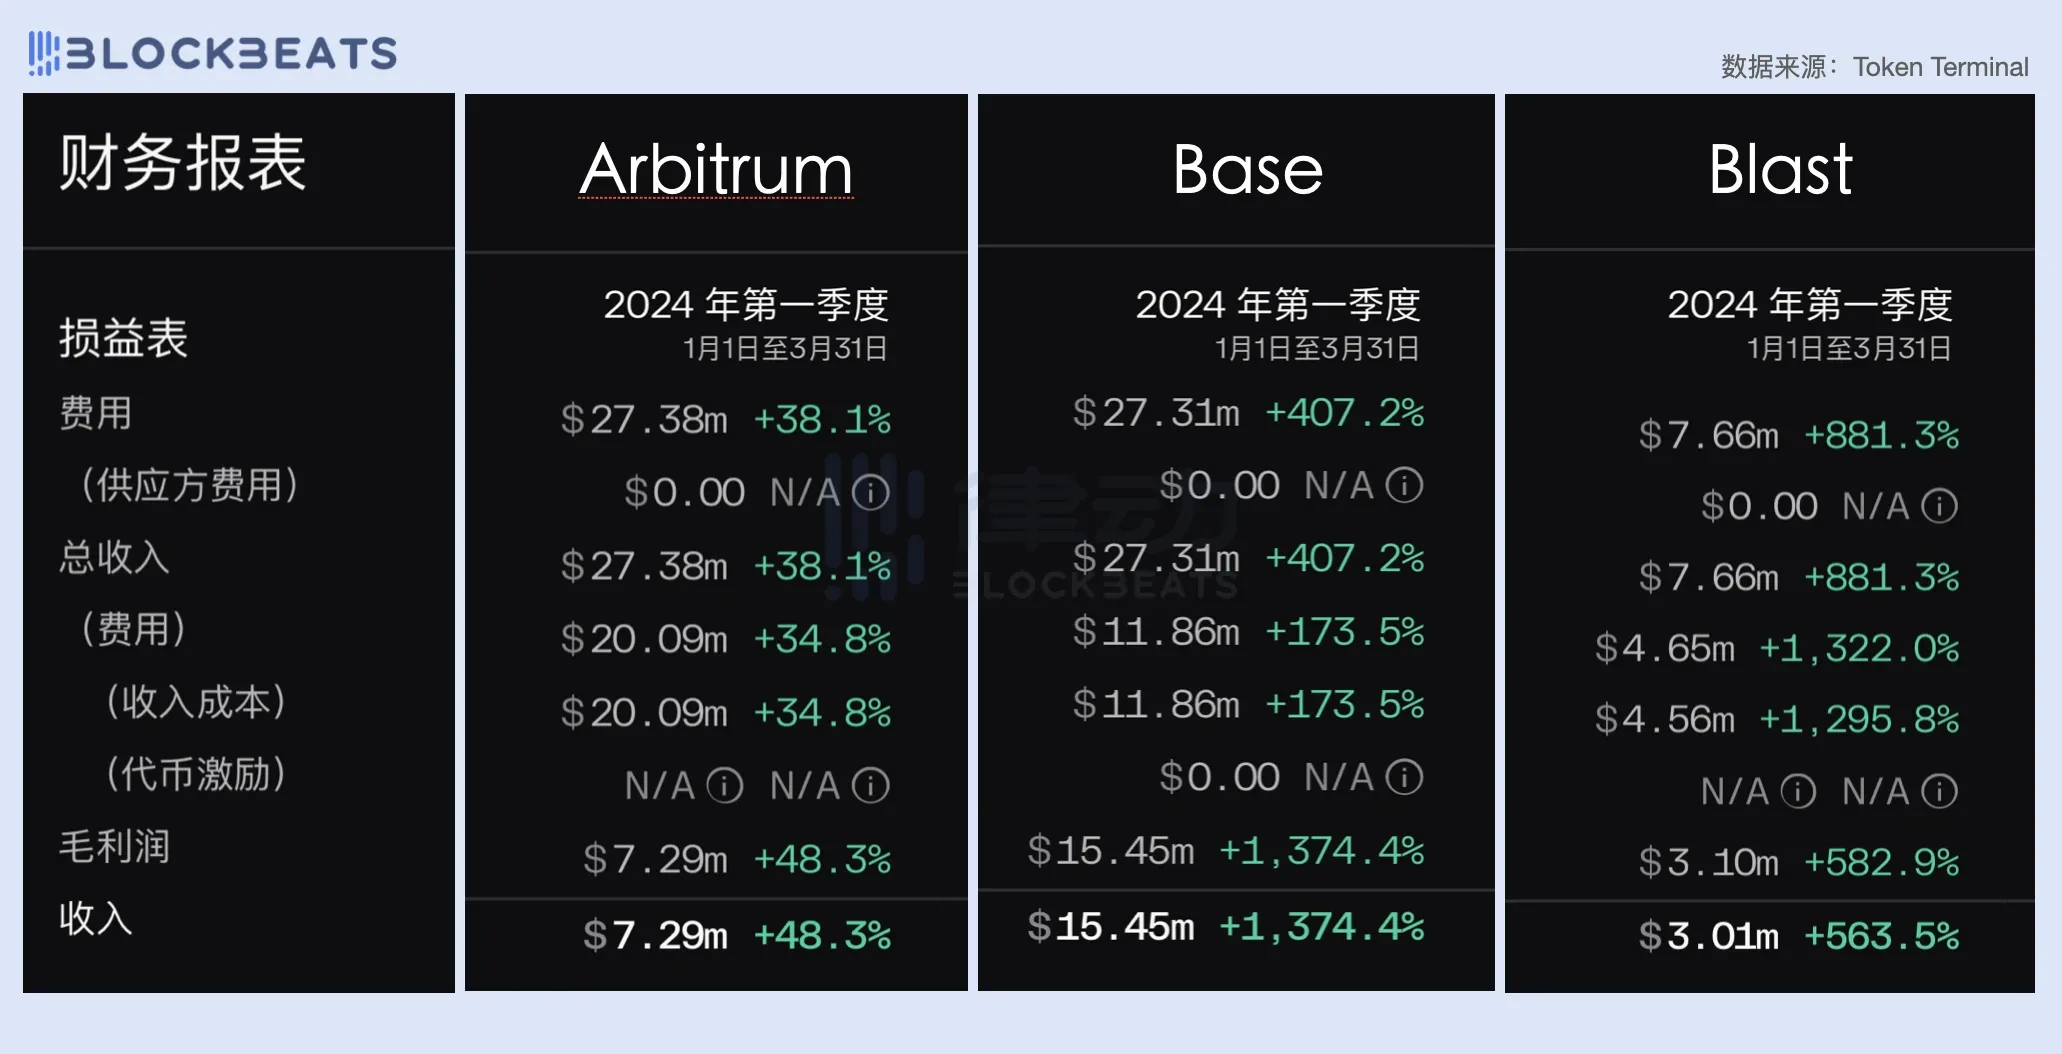
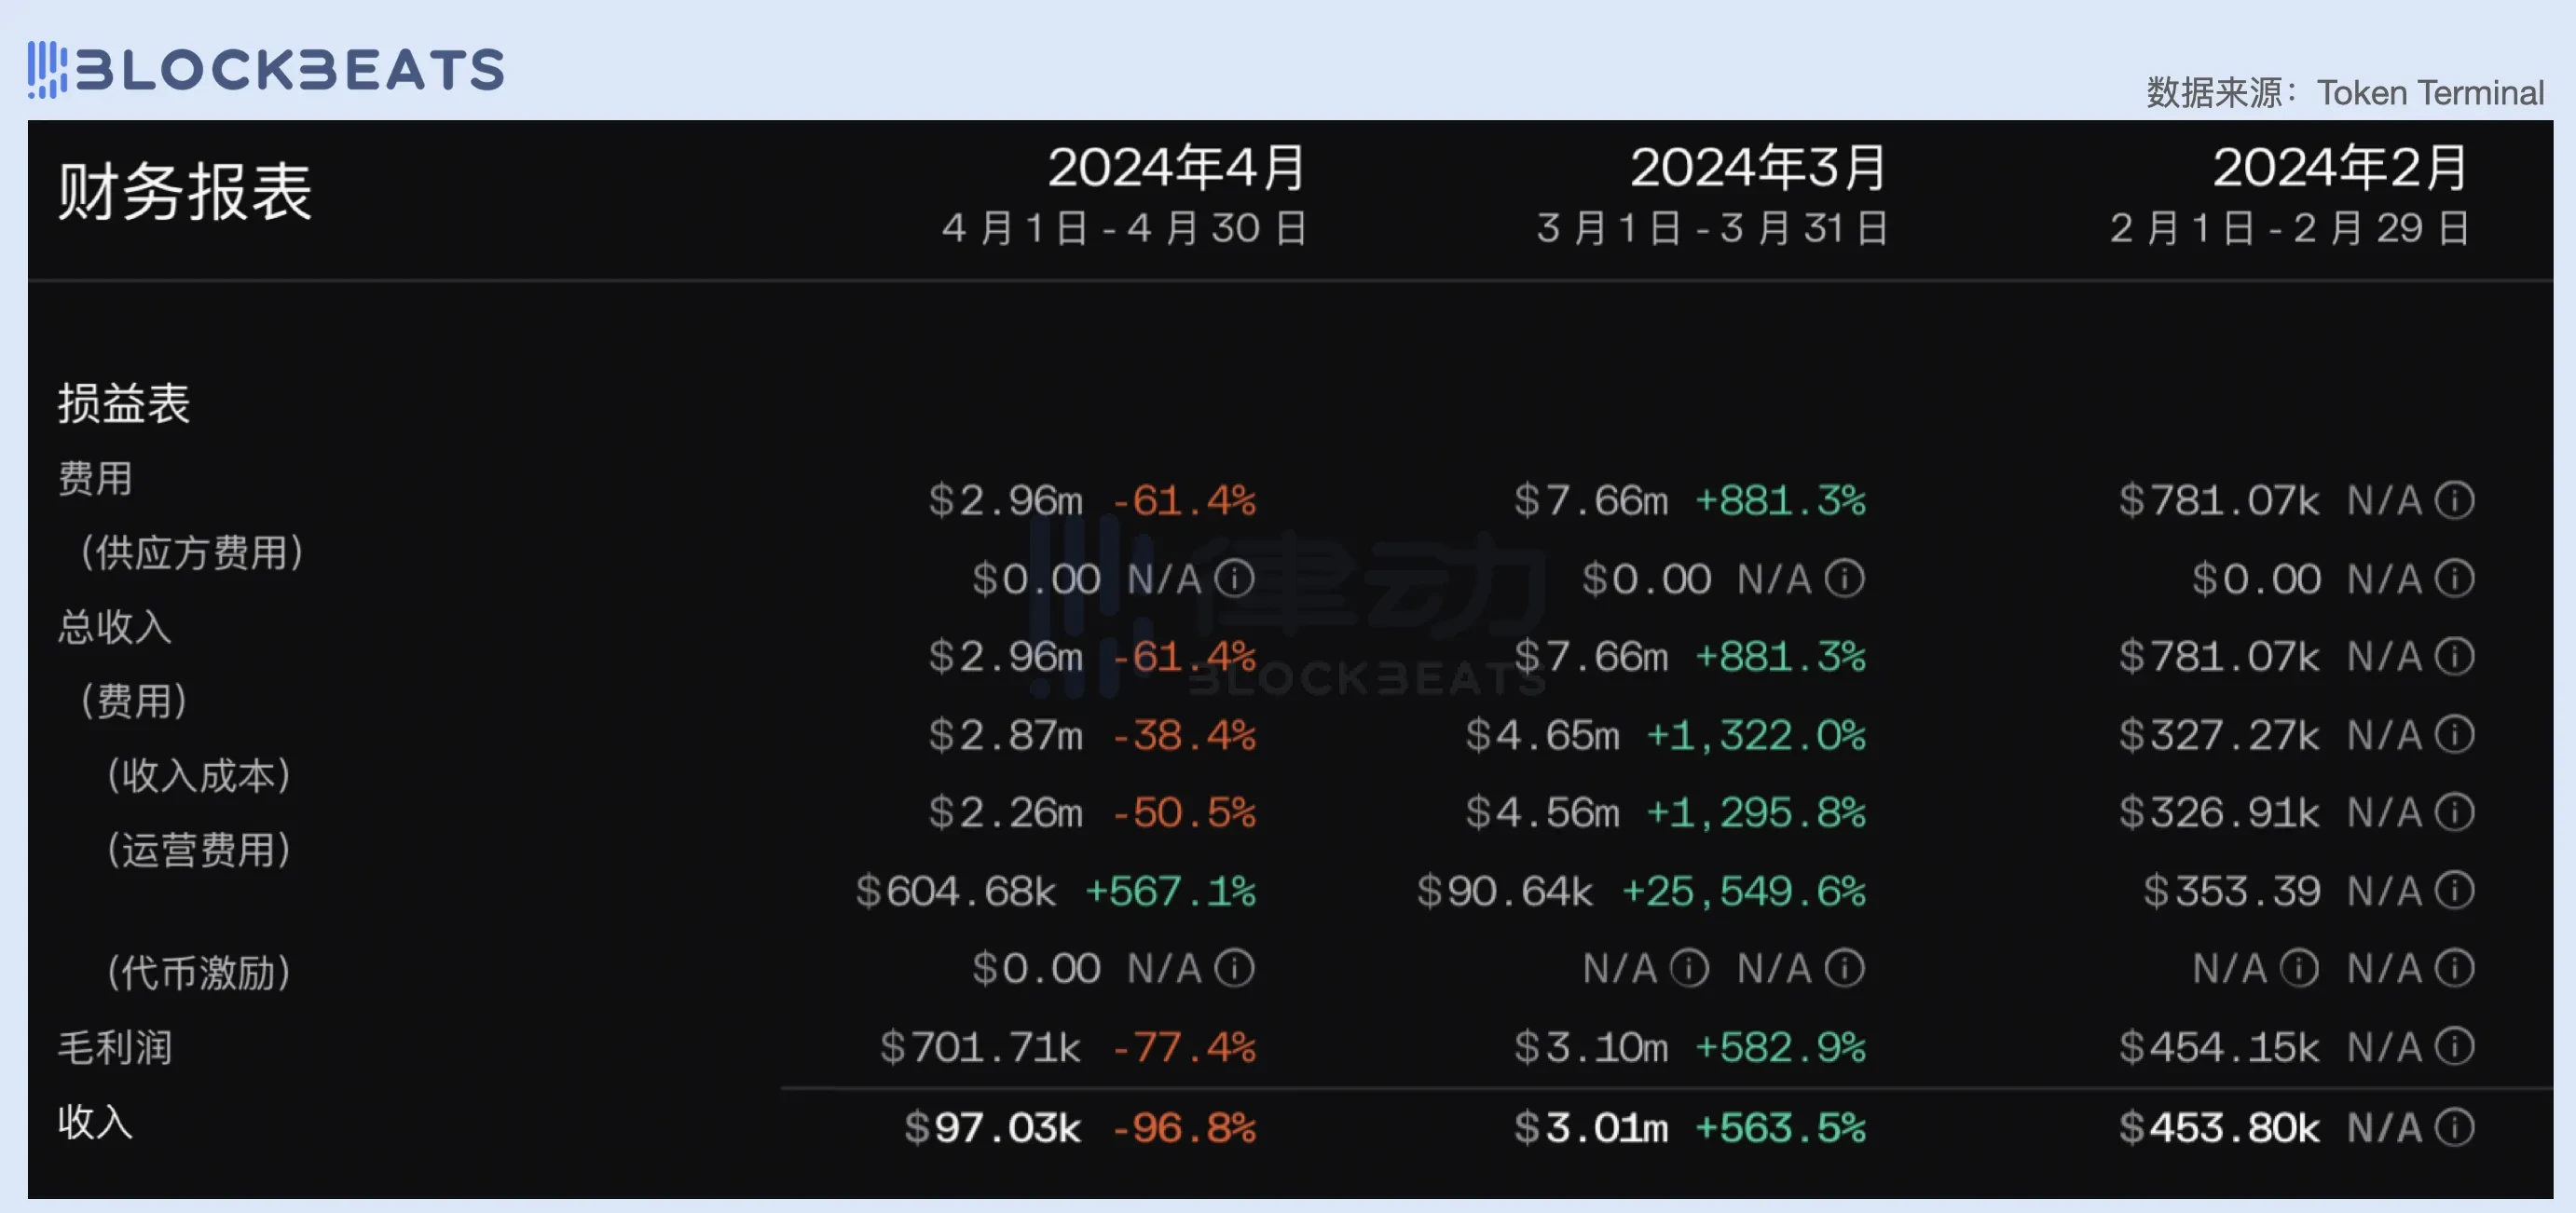
In this article, we have selected the performance of three L2s—Arbitrum, Base, and Blast—for comparison. You will find that while L1s consider the issue of profit and loss balance, for L2s, the concern seems to be more about how much profit can be made. In the first quarter, all three L2s achieved profitability, with Base and Arbitrum generating revenue of over 27 million USD each, while Blast, as a new force in L2, also achieved a quarterly revenue of 7.66 million USD, making many L1s pale in comparison.
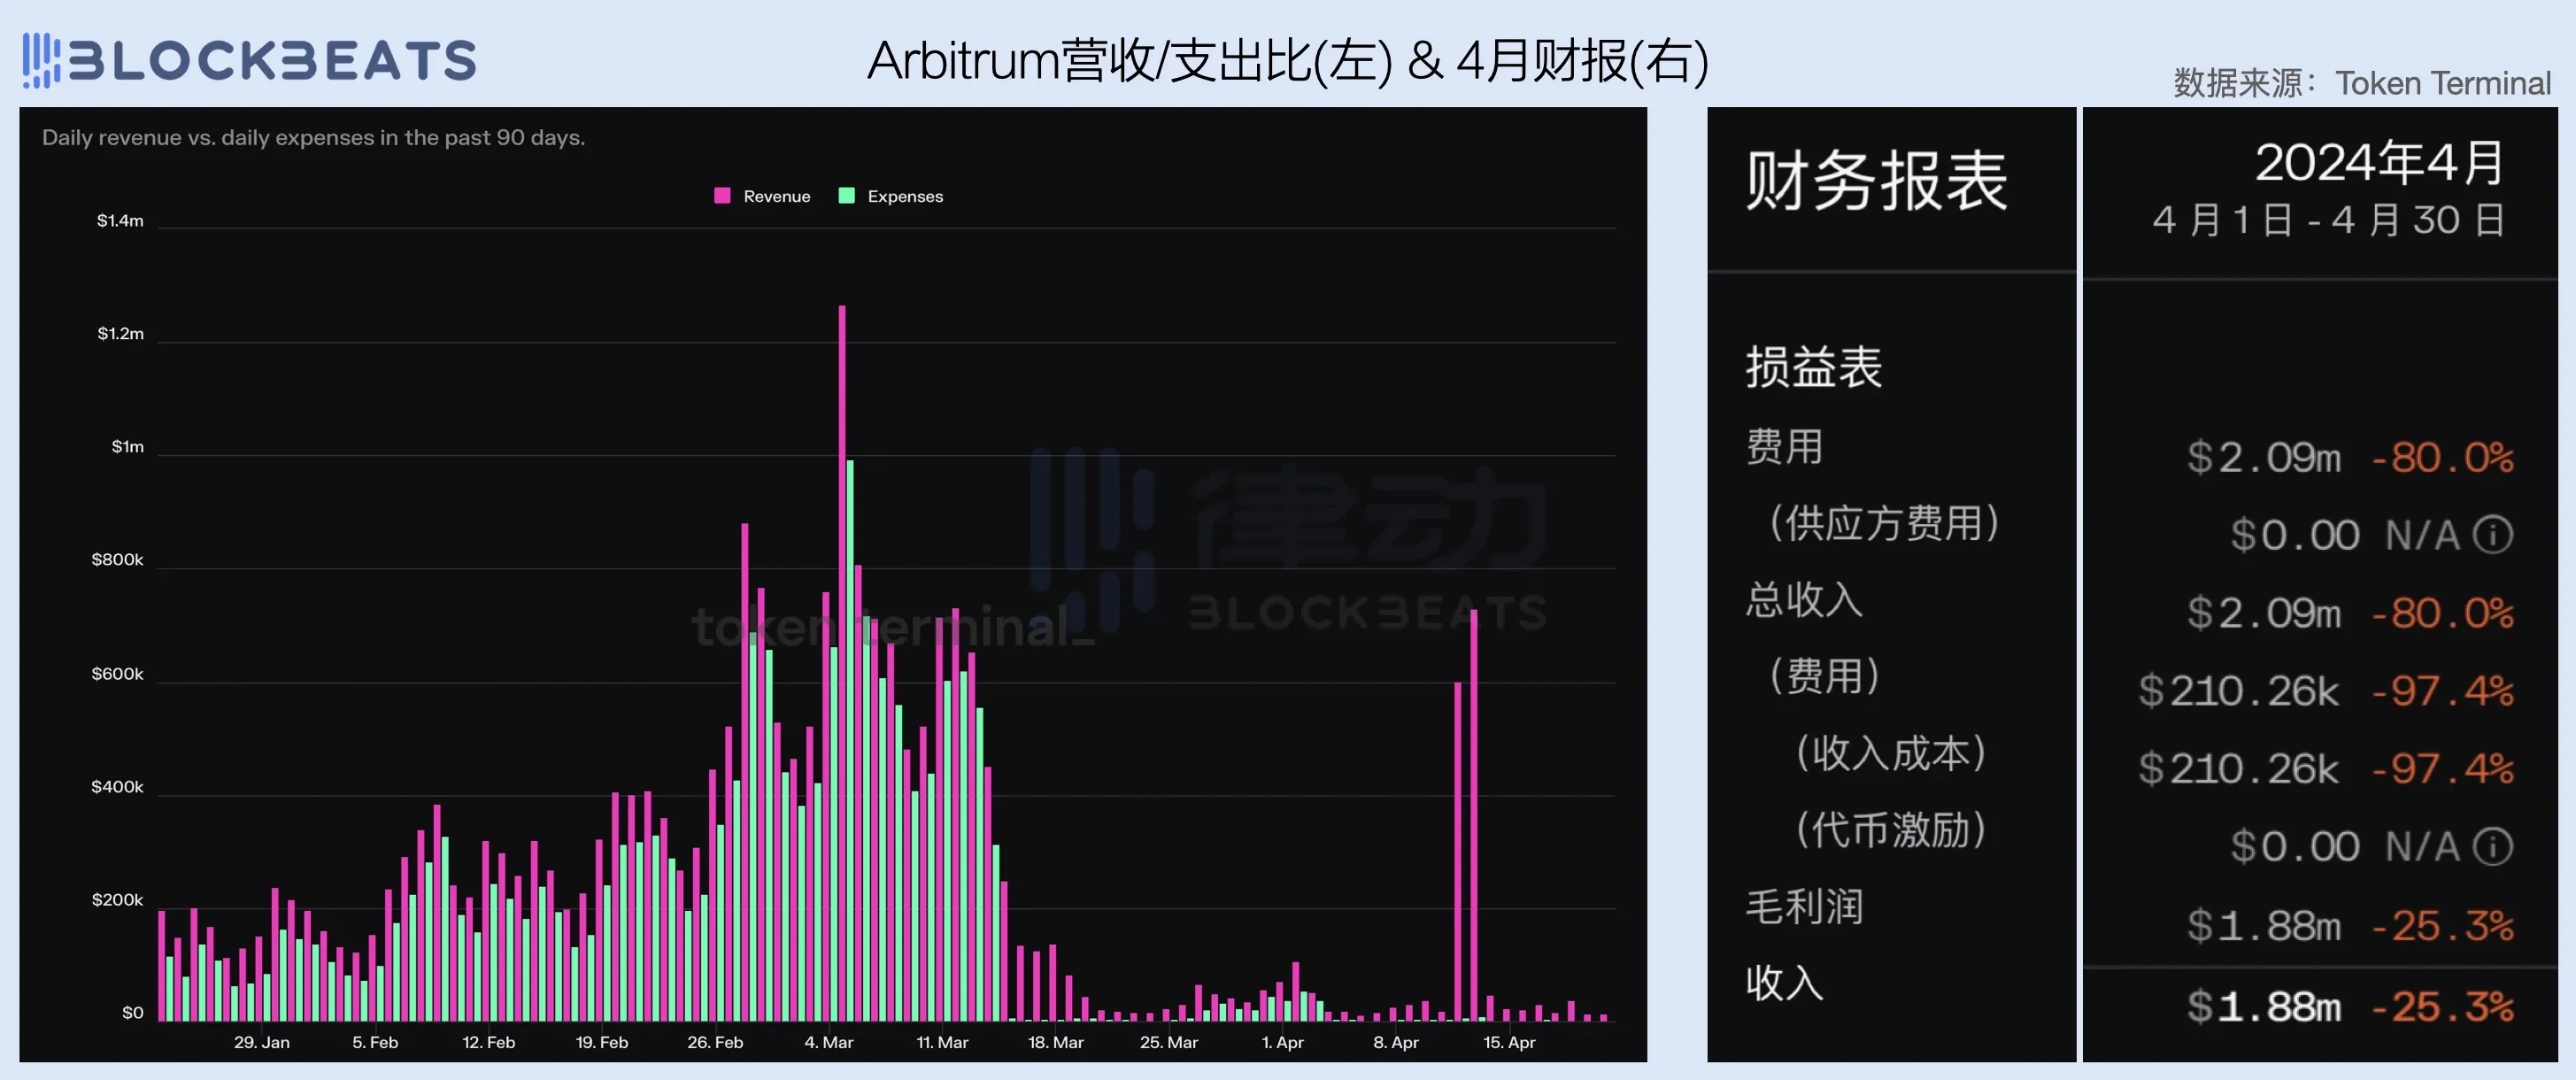
Stable Income for Arbitrum
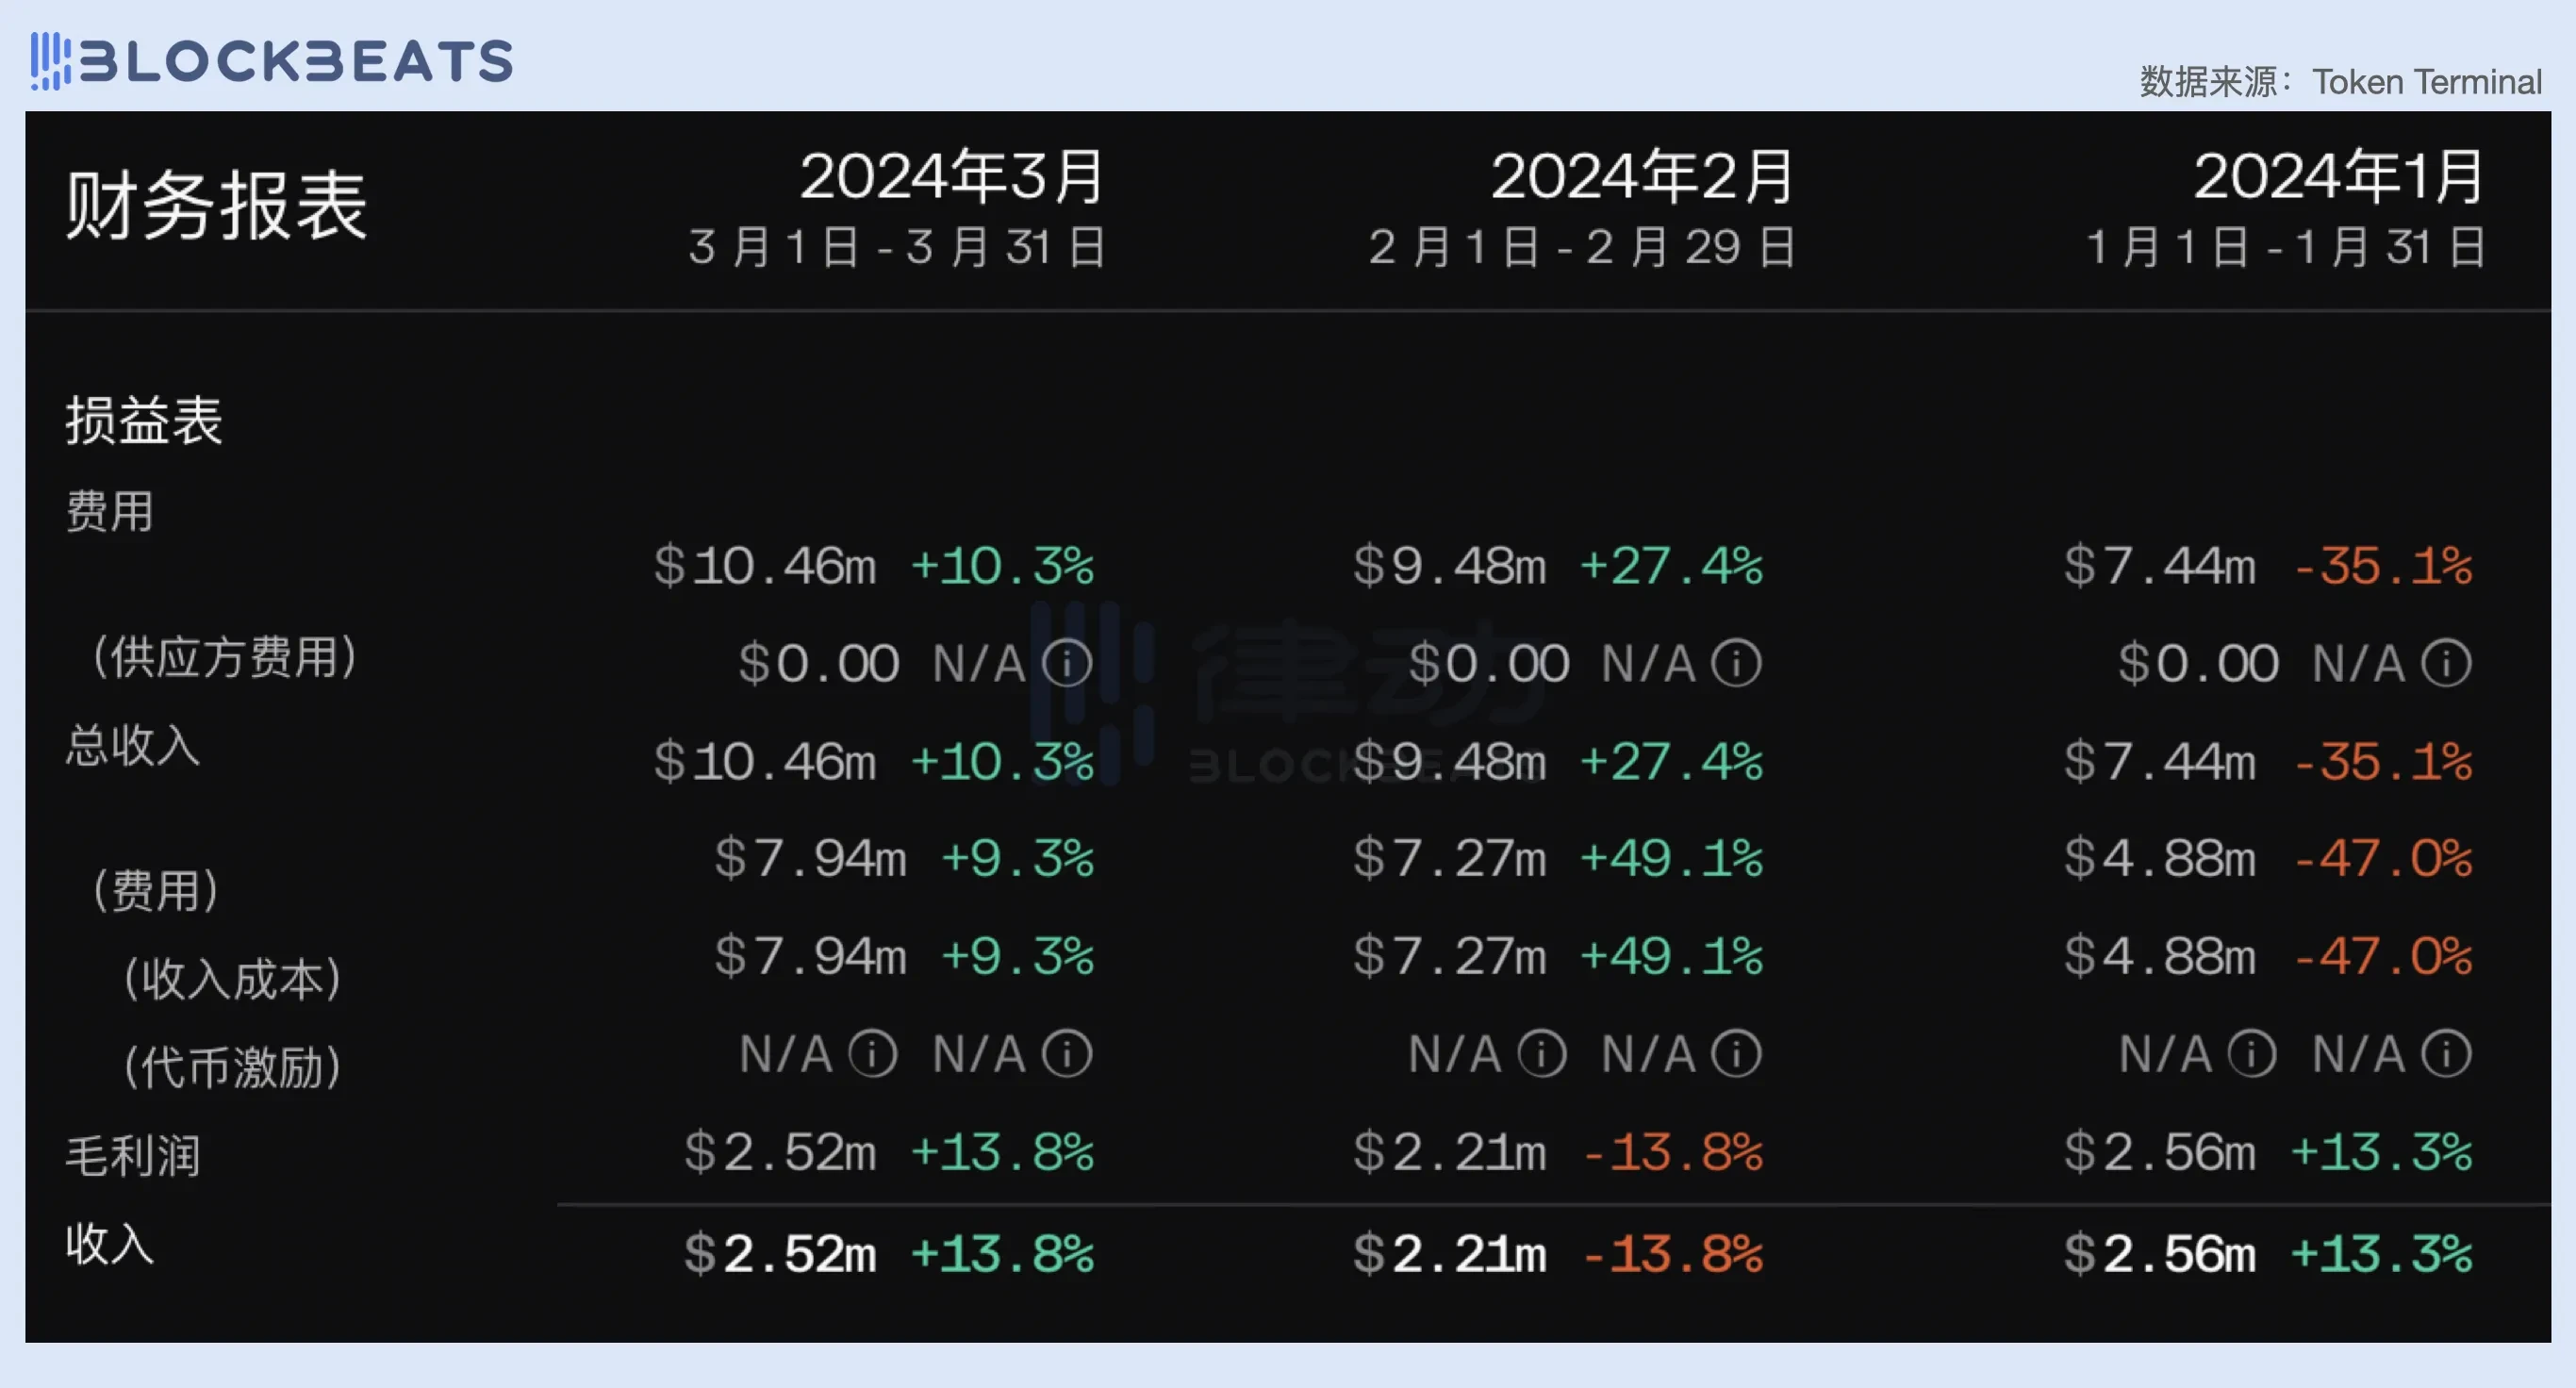
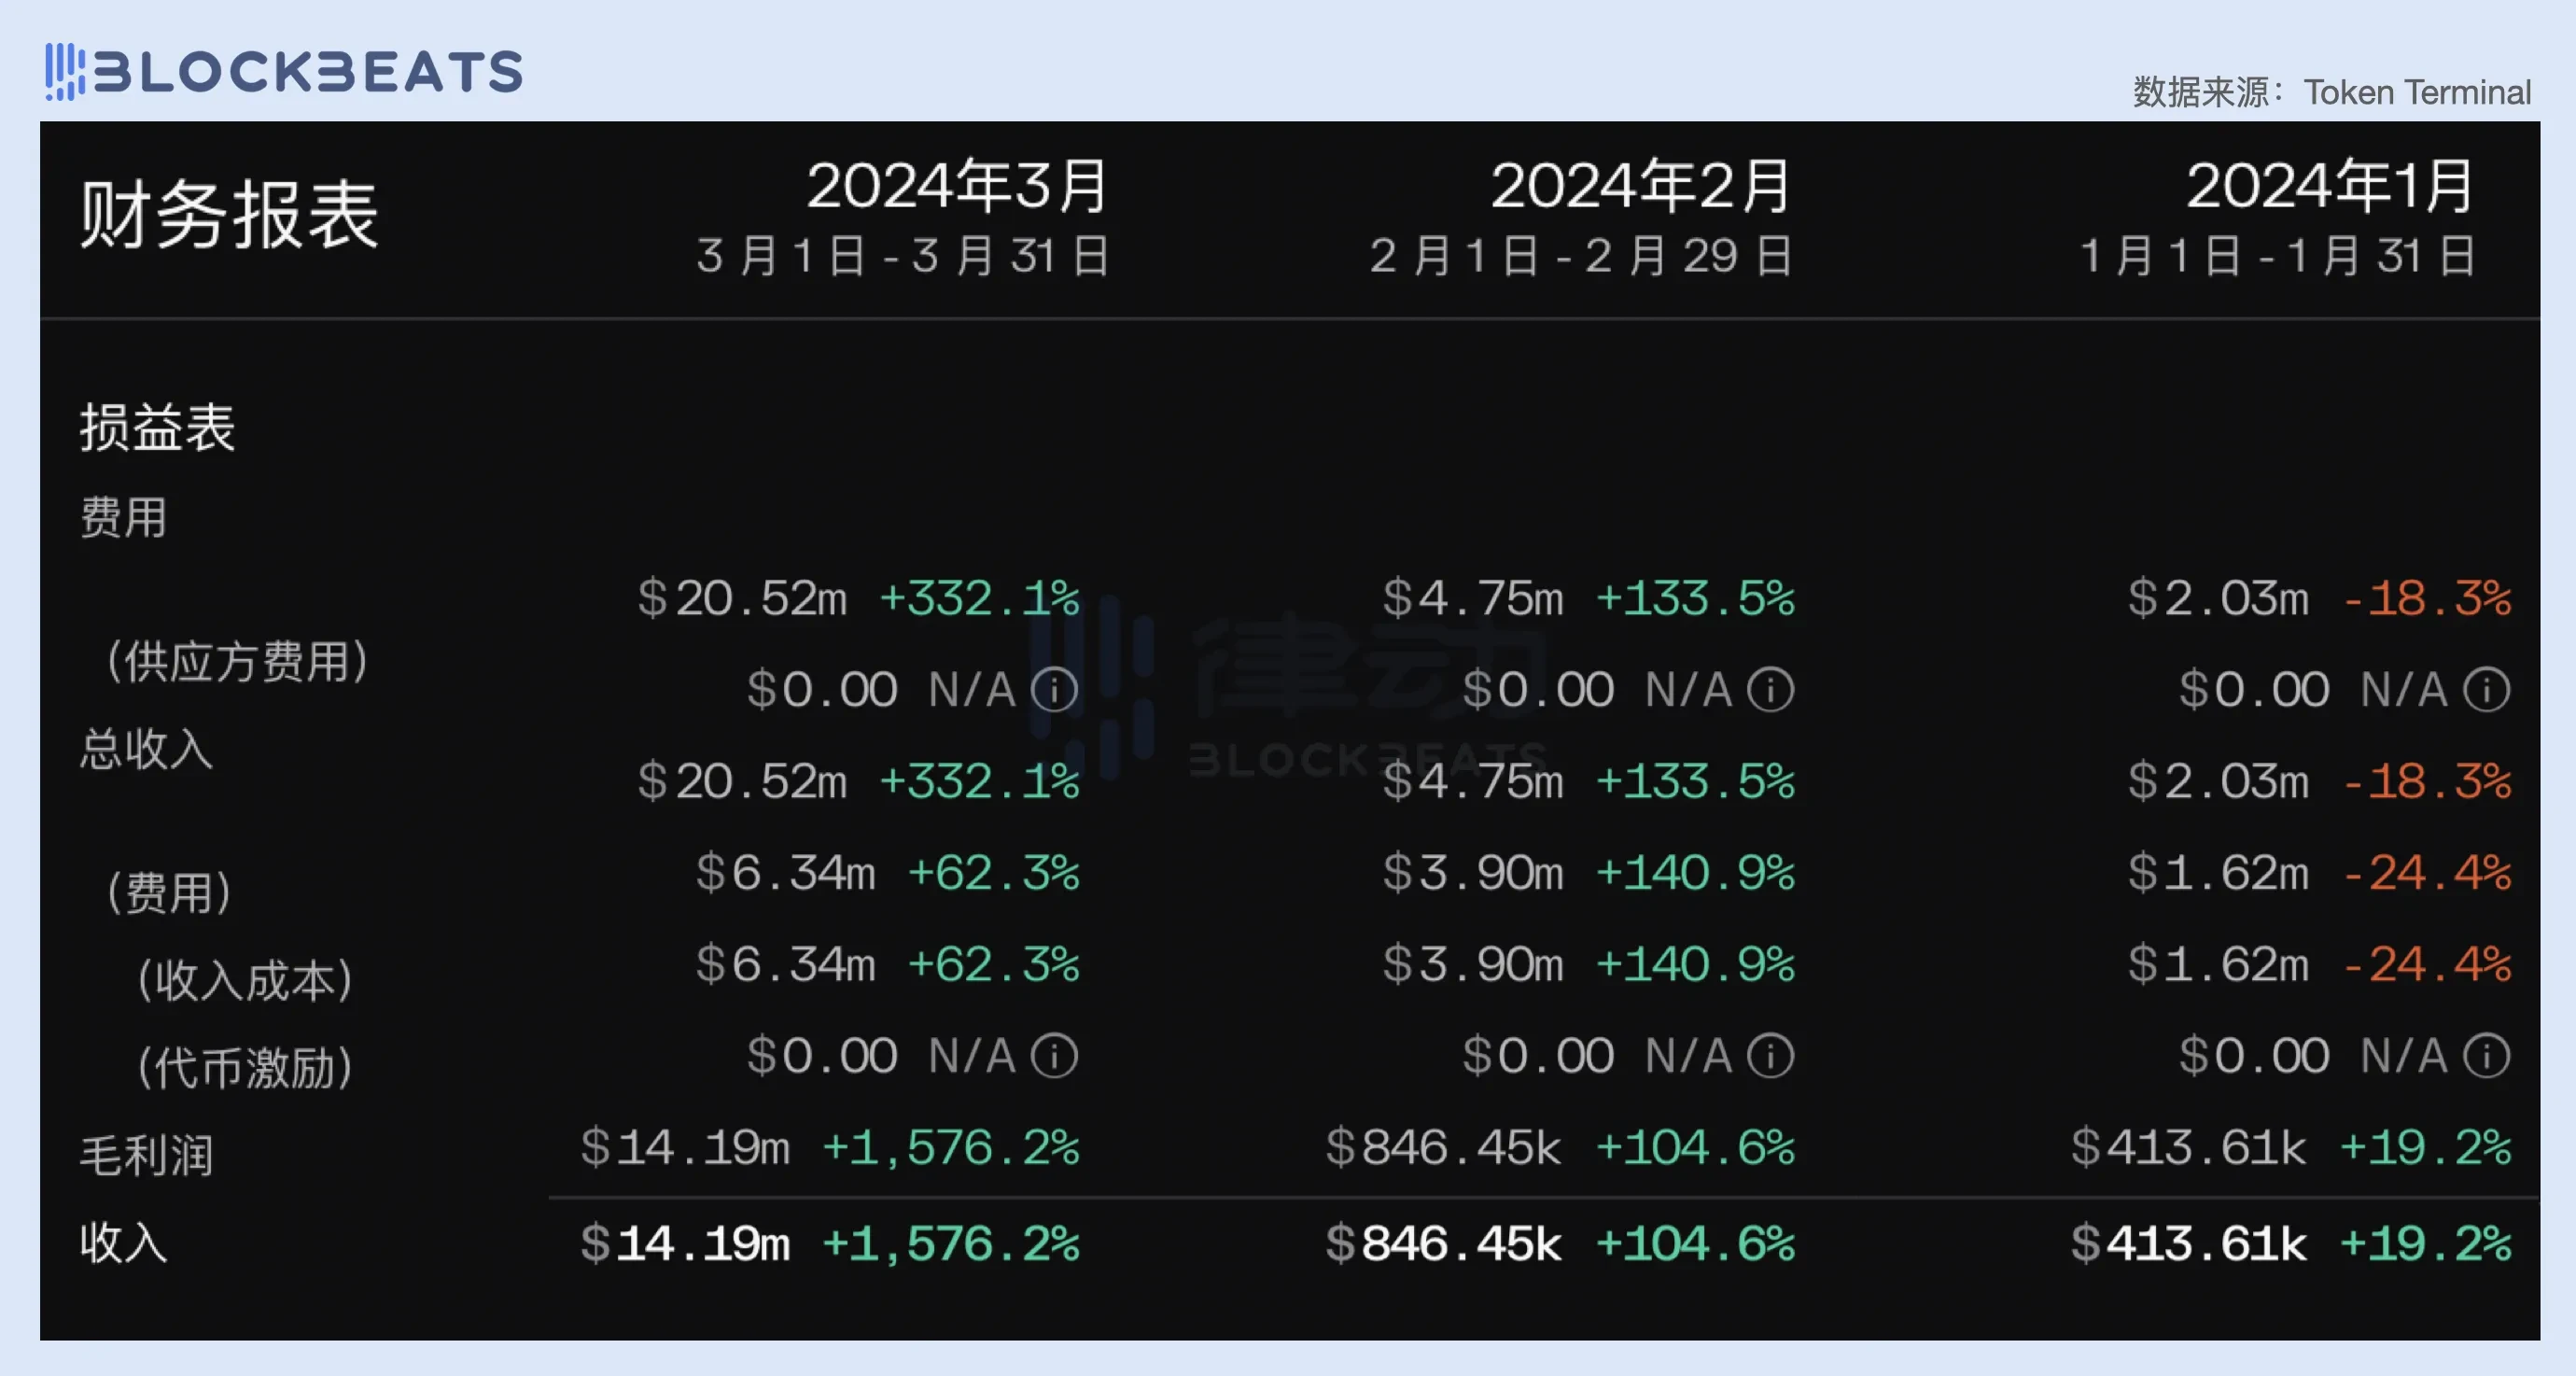
Looking into it, Arbitrum's average monthly revenue in the first quarter remained stable at around 2.3 million USD. In January, Arbitrum's network revenue was 7.44 million USD, with DA costs of 4.88 million USD, resulting in a gross profit of approximately 2.5 million USD. In March, revenue reached 10.46 million USD, with DA costs of 7.94 million USD, resulting in a similar gross profit of around 2.5 million USD.
It can be seen that before the EIP-4844 and Cancun upgrades, the revenue ceiling for L2 was fixed and very limited. Due to the positive linear relationship between fee revenue and on-chain costs, the gross profit margin of L2 has always been limited to a fixed range. For Arbitrum, this figure remained between 25% and 40% in the first quarter. After the Cancun upgrade, the DA costs for L2 using Blob were significantly reduced, greatly increasing the gross profit margin of L2. As seen from the chart, after the launch of EIP-4844, the gross profit margin of L2 remained stable at around 90%. However, this data does not take into account the operating costs of the sequencer.
However, the reduction in DA costs also led to a decrease in transaction fees, which, in the absence of incremental users, meant a sharp drop in network fee revenue. As seen from the chart, after the Cancun upgrade, despite the operating costs almost "zeroing out," the fee revenue of the Arbitrum network also significantly decreased. Looking at the data for April, Arbitrum's revenue shrank by nearly 80%, reaching only about 2 million USD. However, thanks to the extremely low DA costs, it still achieved a gross profit of 1.88 million USD, a decrease of only 25.3% from March.
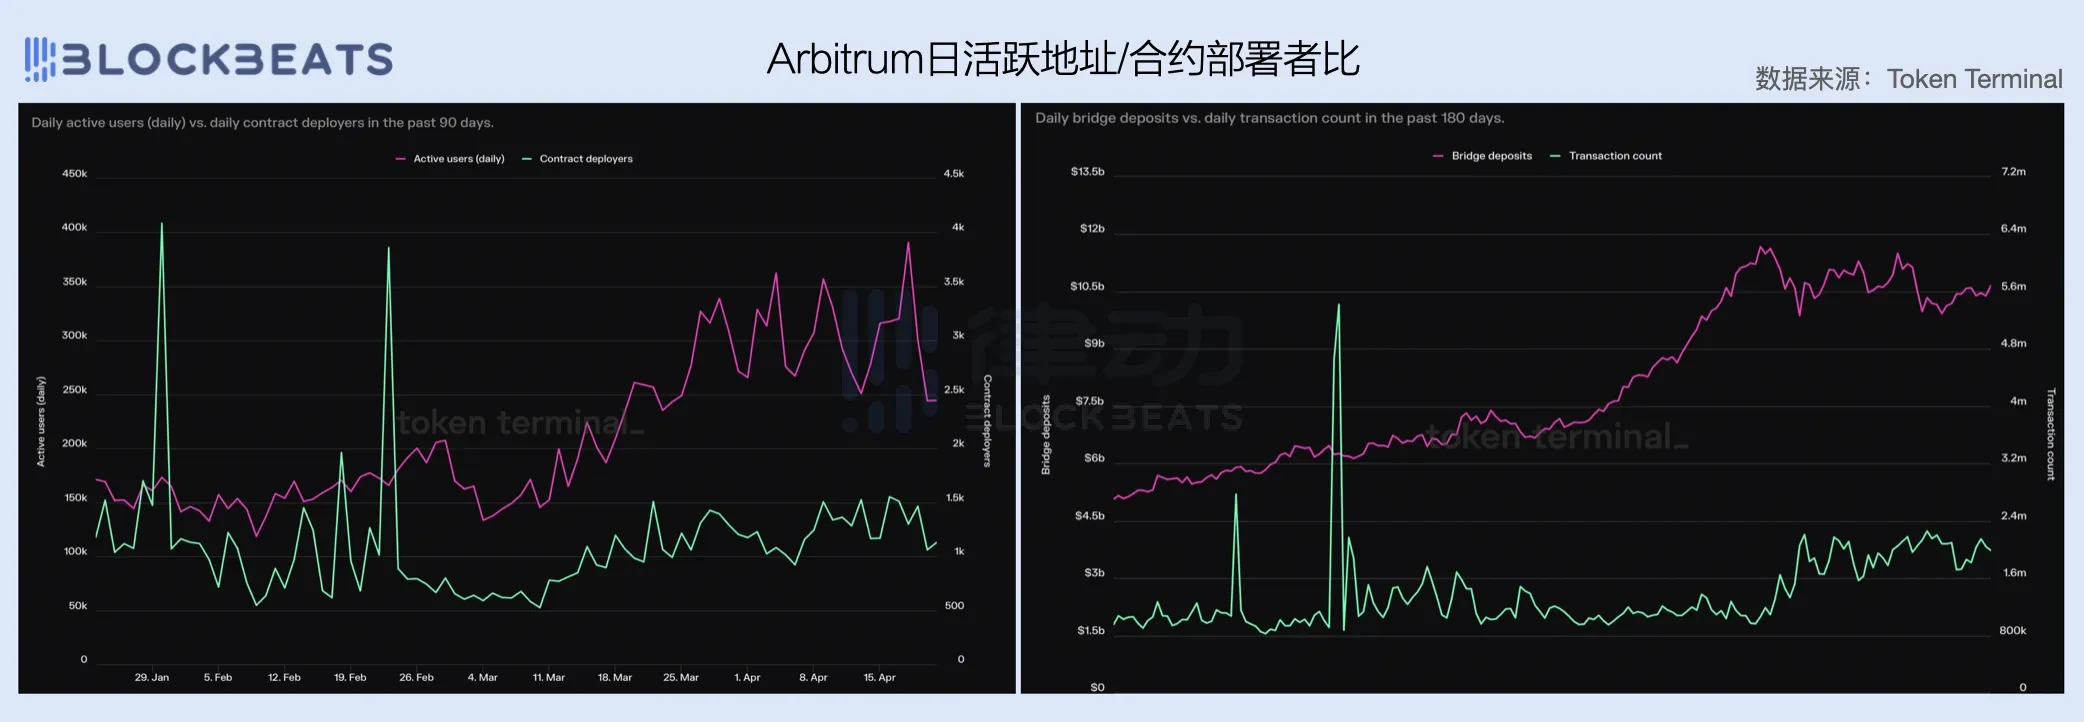
While the gross profit margin has been maximized, the inability to grow revenue and the bottleneck in user growth are also the biggest challenges faced by Arbitrum. The number of daily active addresses for Arbitrum slowed down after March, and the number of contract deployers did not change significantly in the first quarter, with cross-chain assets and transaction volume also ceasing to grow in March. From a user's perspective, the utility value of Arbitrum's tools seems to far exceed its application value, with a single application scenario in the ecosystem making it difficult to activate existing users and retain new users, leading many to see it as a "transit chain."
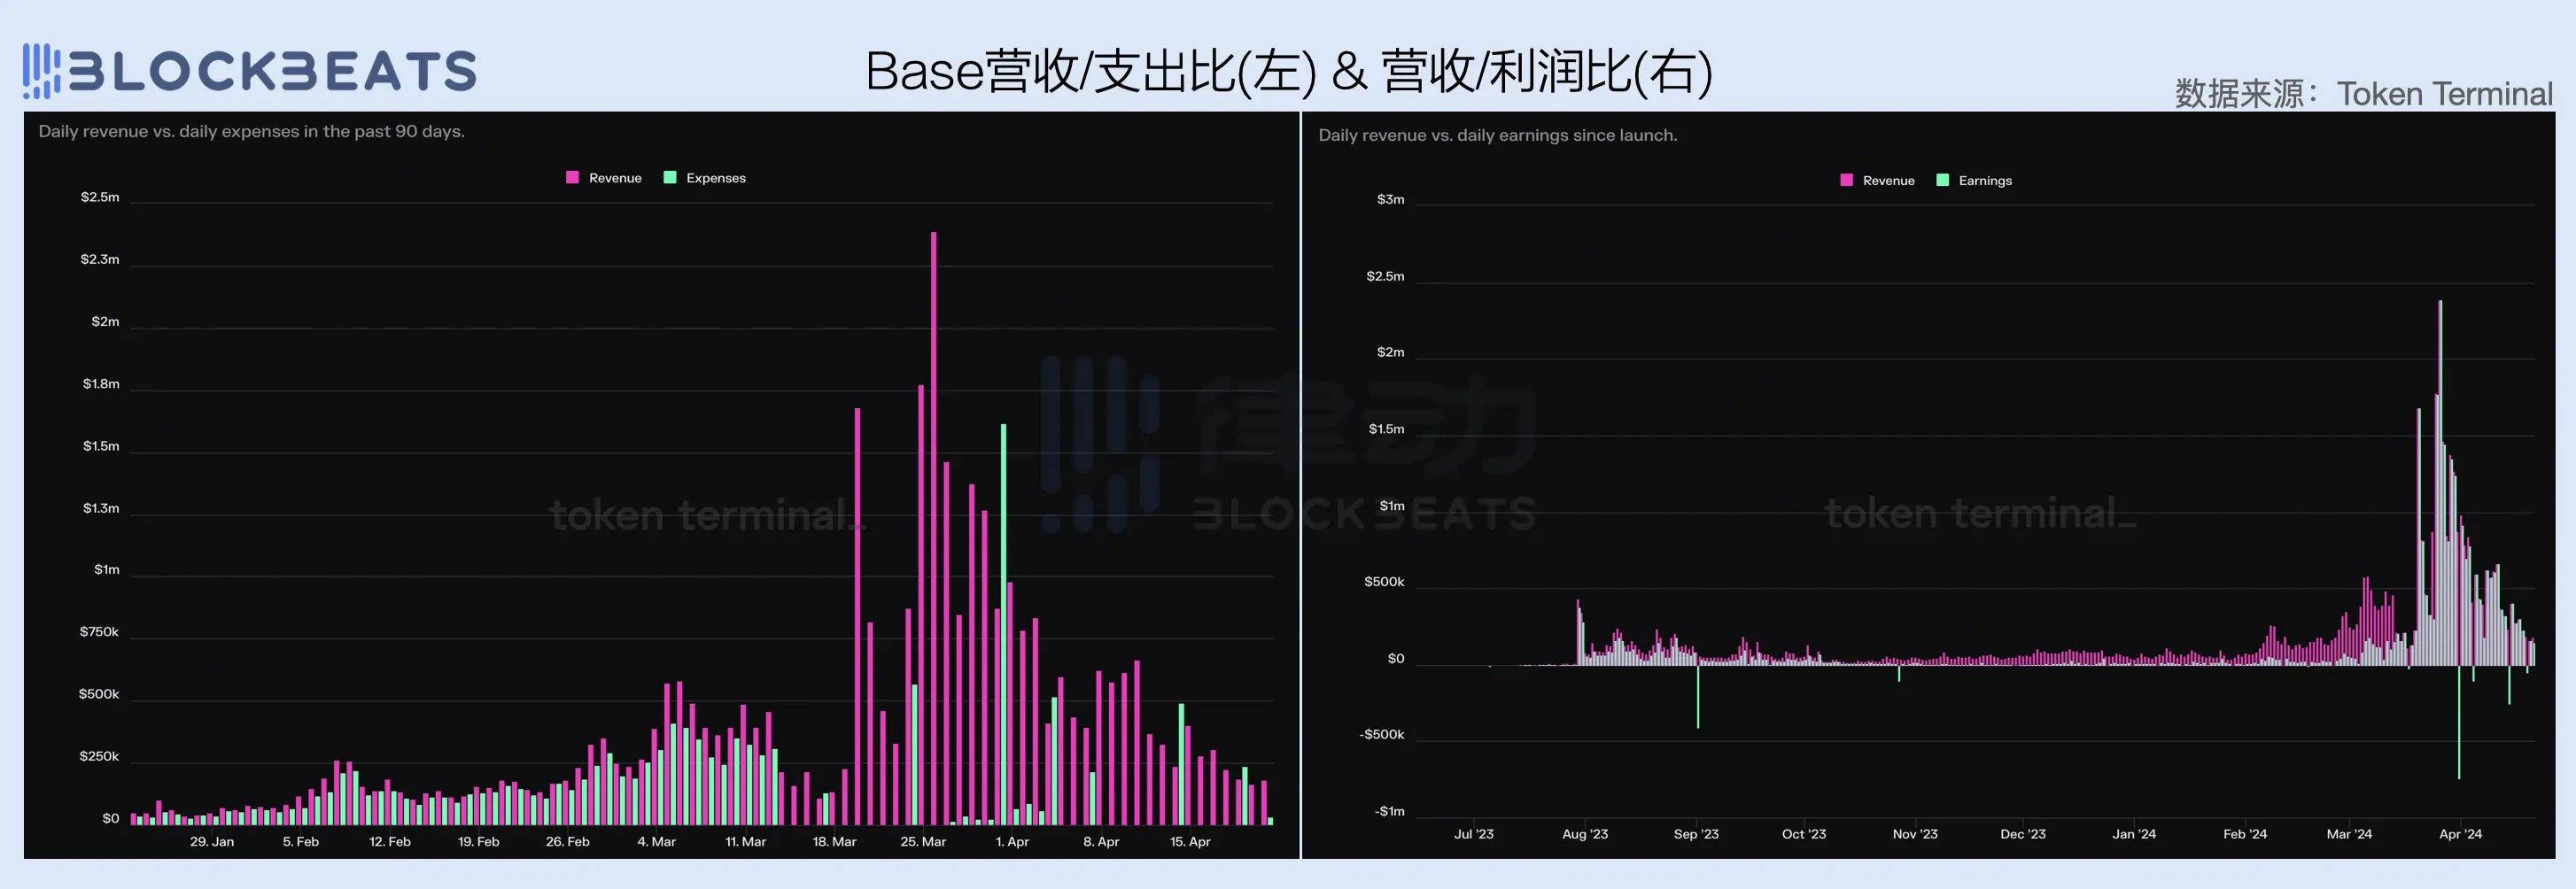
Explosive Growth for Base
The bottleneck in growth does not seem to be a problem for Base. In March, Base experienced explosive growth, with revenue increasing more than fourfold year-on-year. On one hand, DA costs plummeted, and on the other hand, the number of users surged. Excluding the 6.34 million USD in DA costs, Base's monthly gross profit was more than twice the gross profit of Arbitrum for the entire first quarter.
After the Cancun upgrade, Base also experienced a drastic drop in revenue, but quickly reversed this downward trend. Looking at the net profit data, Base's profit has been on a growth trend since the beginning of the year, and after EIP-4844, Base directly "made a killing."
The explosive growth in revenue is inseparable from the narrative boost of the "Base season." In the past quarter, Base was one of the few networks with high-speed growth in both daily active addresses and the number of contract deployers. However, it is worth noting that developers within its ecosystem still exhibit strong market speculation. In April, with the overall liquidity shrinking, as transaction volume and fee revenue continued to decline, the number of contract deployers on the Base network also quickly halved.
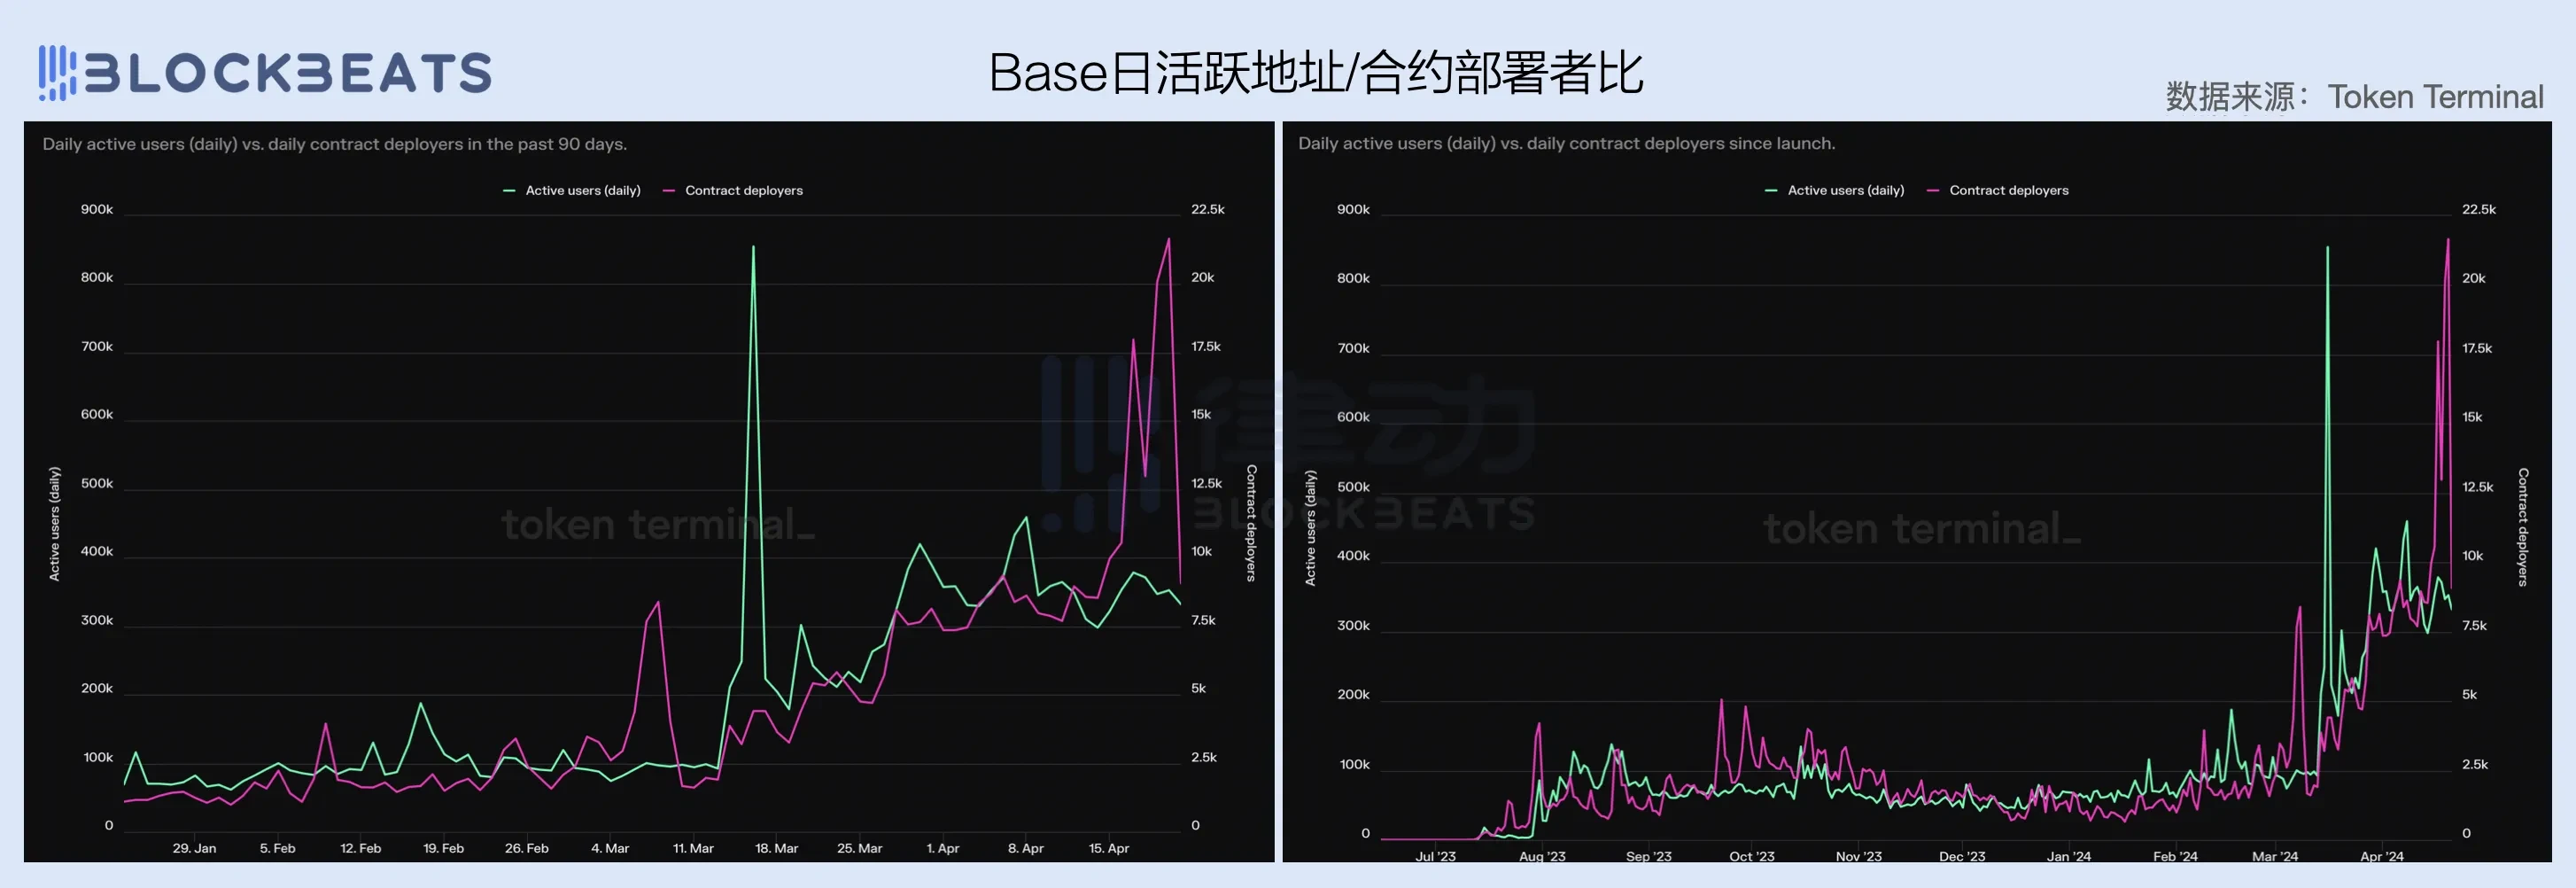
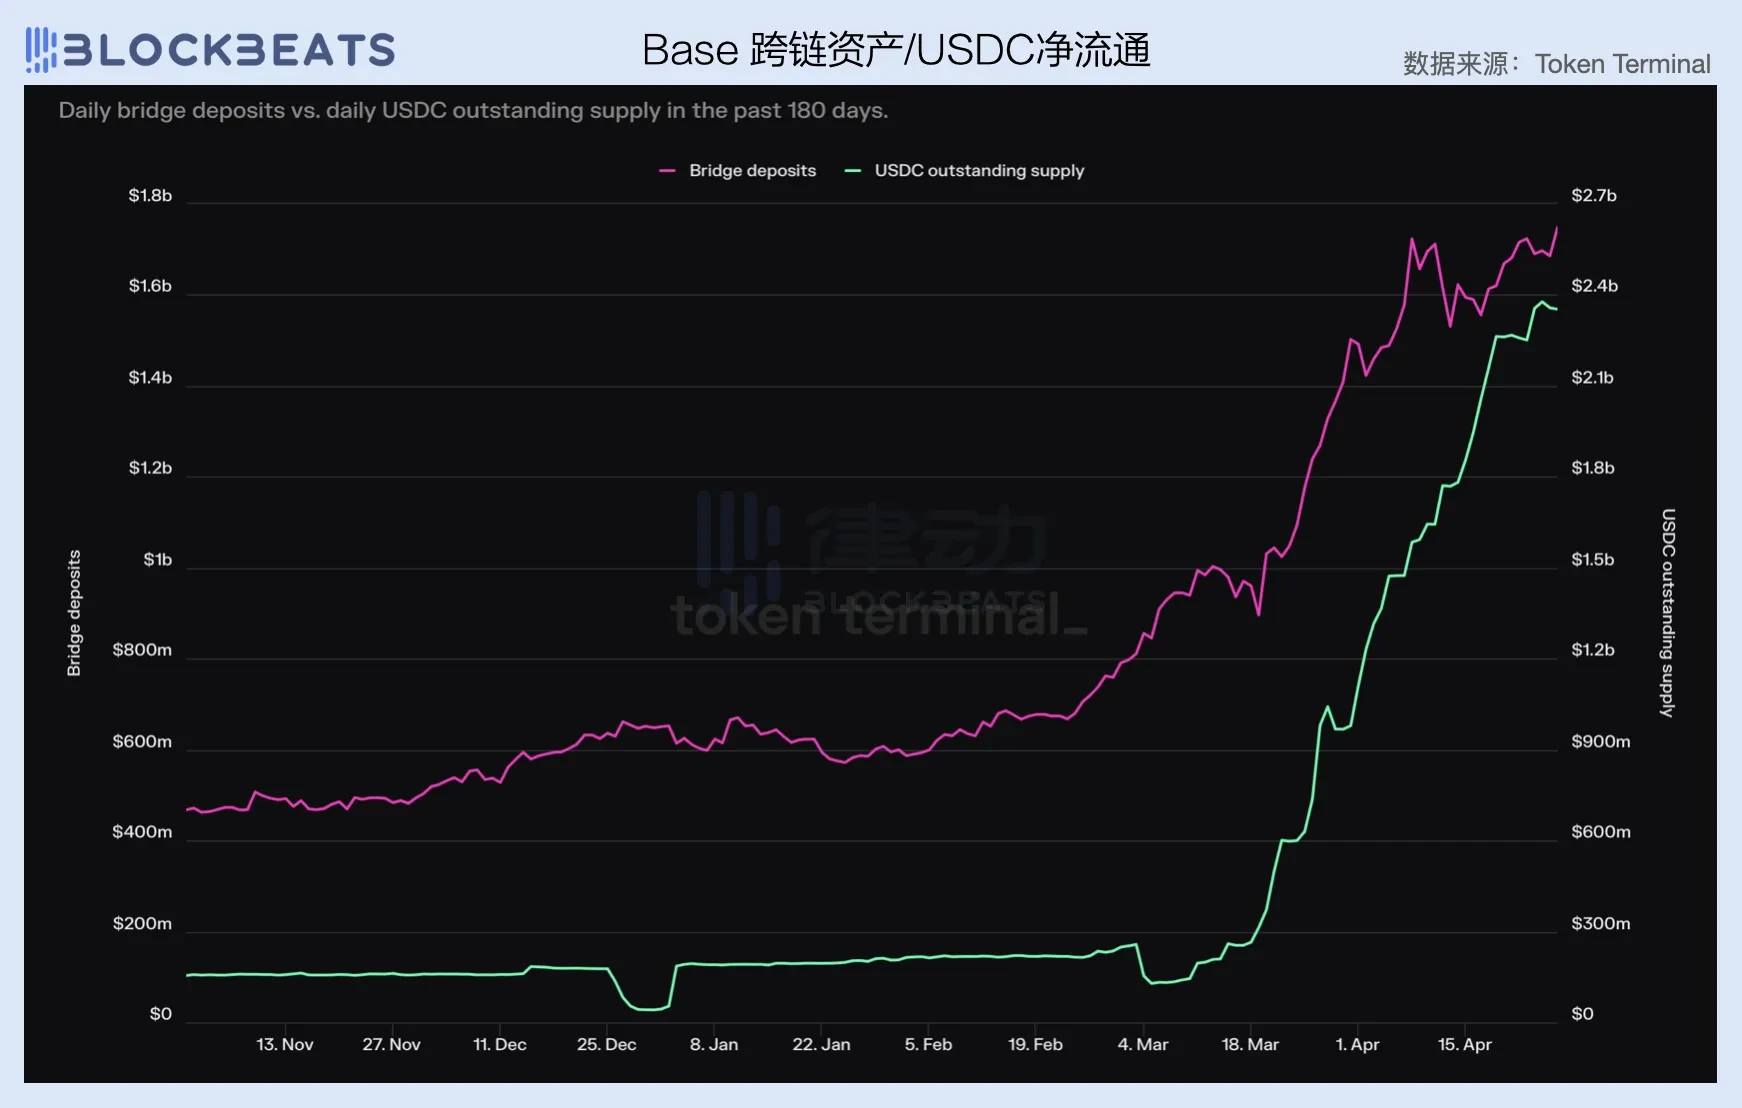
It is worth noting that despite a significant decline in overall popularity in April, some fundamental signals about the "Base season" continue to strengthen. Starting from March, the net circulation of USDC and the value of cross-chain assets on the Base network began to rise rapidly, and this momentum has not shown significant signs of slowing down even after entering April. With the improvement in market liquidity in the second half of the year, Base may become one of the most noteworthy ecosystems in the crypto industry.
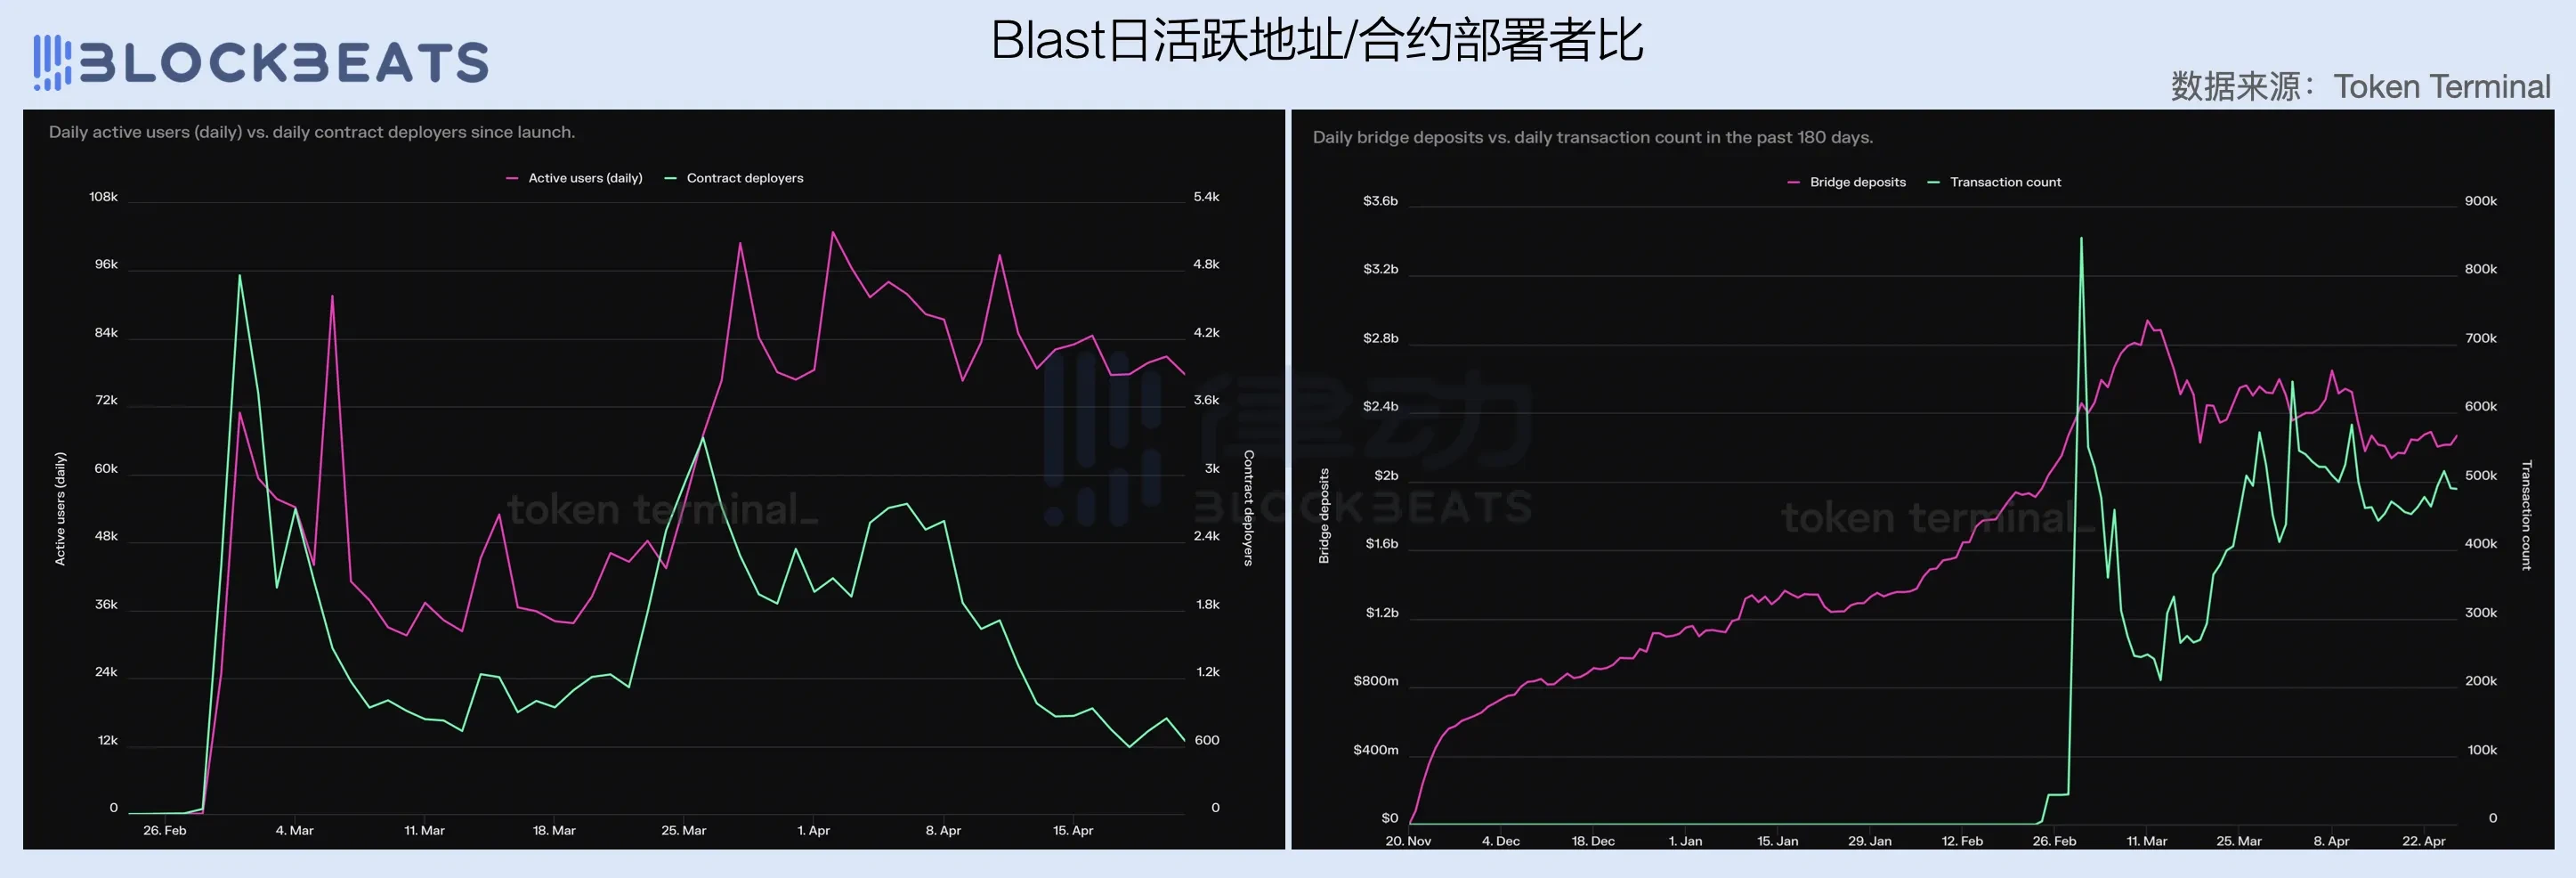
Lackluster Performance for Blast
Paradigm's endorsement, IronPillar's drainage, KOL's support, and the entry of project parties—representing the new force of L2, Blast has already made a big splash at the time of its launch. However, looking at the financial data from the past two months, Blast's performance has not been particularly ideal. After achieving great success in March along with the entire crypto market, Blast regressed in April, with revenue dropping by over 60% compared to March, and gross profit only reaching 700,000 USD.
An interesting point is that unlike other L2s, Blast did not significantly reduce operating costs after the Cancun upgrade, instead maintaining them at a relatively high level, preventing the network's gross profit margin from breaking through.
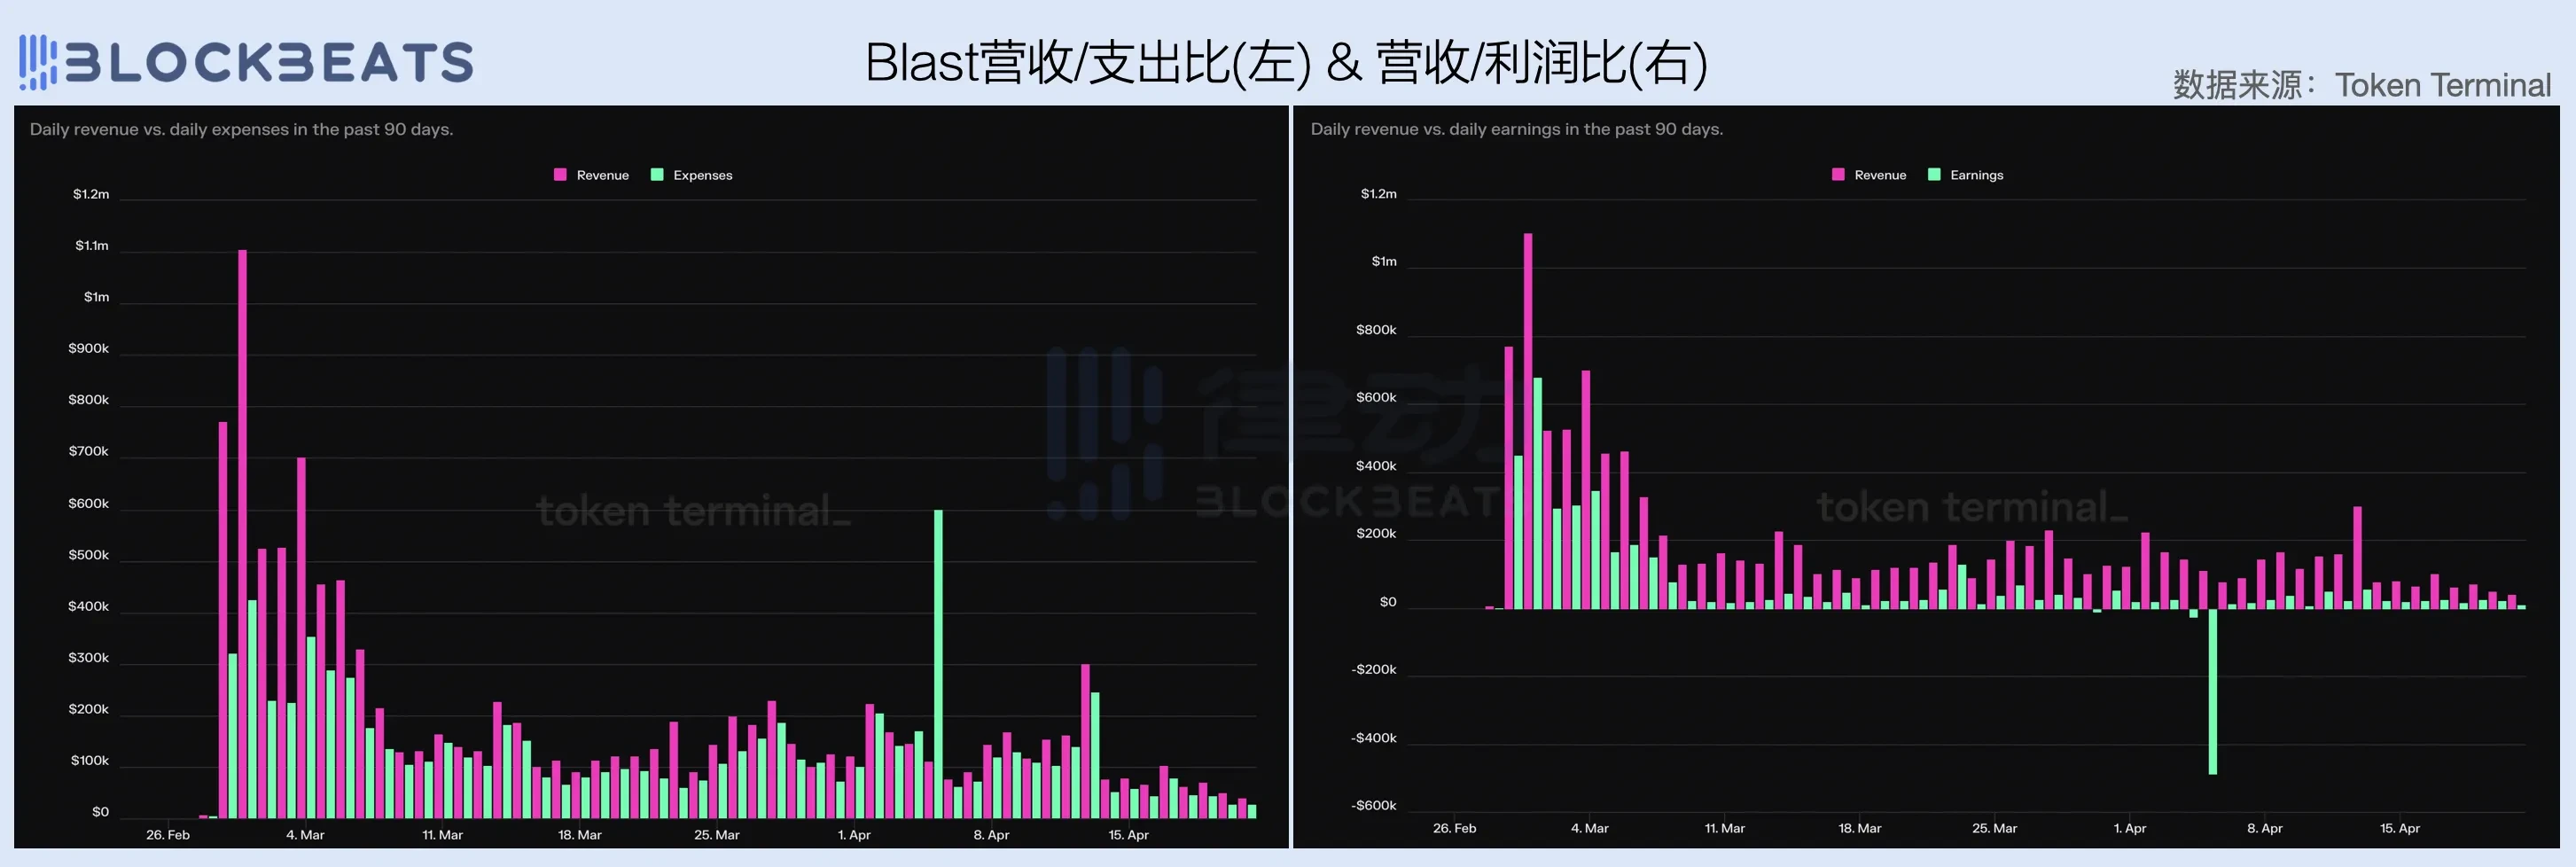
However, more concerning than the gross profit margin issue is Blast's struggle in ecosystem growth. The number of contract deployers for Blast sharply declined in the past month, while the number of daily active addresses and daily transaction volume both stagnated after a decrease in cross-chain fund inflows. Of course, analyzing Blast's April data in the context of the overall market weakness may be somewhat biased, but to be honest, Blast's performance in March was not particularly impressive either.
Similar to Avalanche's situation, Blast's predicament also serves as a wake-up call for upcoming general-purpose L2s. In the current stock market where the leading L2s have already divided the market, new general-purpose L2s are finding it difficult to achieve economies of scale and carve out a share of the market. Perhaps in this stock competition environment, differentiation and vertical fields, focusing on small but excellent markets, may be the way out.
免责声明:本文章仅代表作者个人观点,不代表本平台的立场和观点。本文章仅供信息分享,不构成对任何人的任何投资建议。用户与作者之间的任何争议,与本平台无关。如网页中刊载的文章或图片涉及侵权,请提供相关的权利证明和身份证明发送邮件到support@aicoin.com,本平台相关工作人员将会进行核查。


