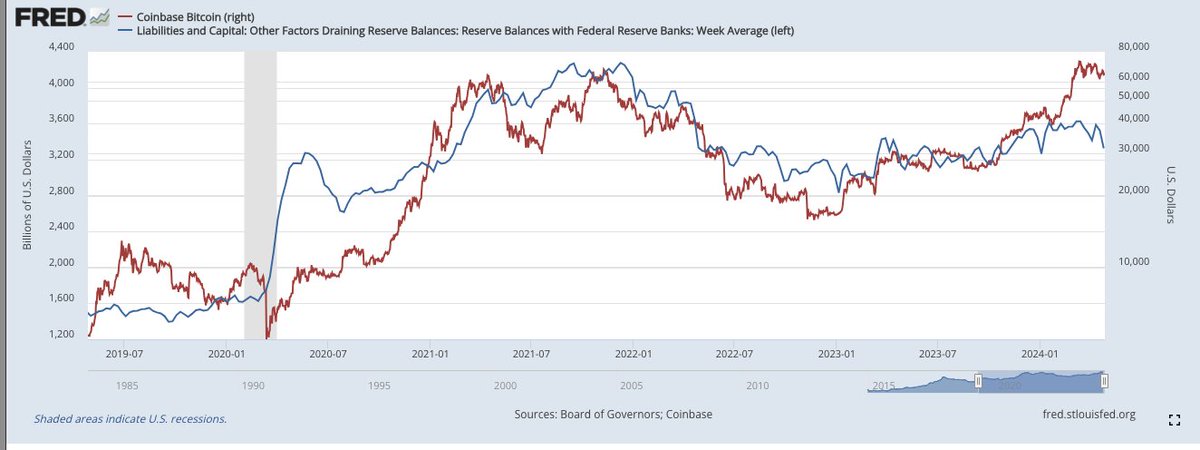
When you look at Figure 1, do you have any doubts about "liquidity driving coin prices"?
The divergence at the end is the additional liquidity brought by ETF.
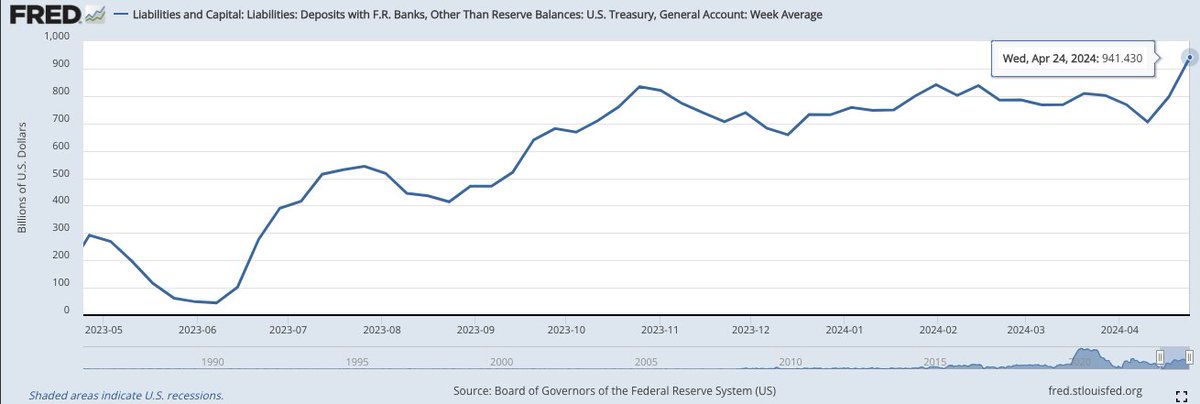
The current decrease in liquidity is caused by the upward trend of TGA (Figure 2), but now it's the end of the month, and this part of the upward trend has already bottomed out.
The core factors that will affect liquidity in the future are:
QT slowing down, the Fed has already sounded the alarm, but whether it will actually happen remains to be seen, at least not yet
RRP is currently at 465 billion, and has remained flat
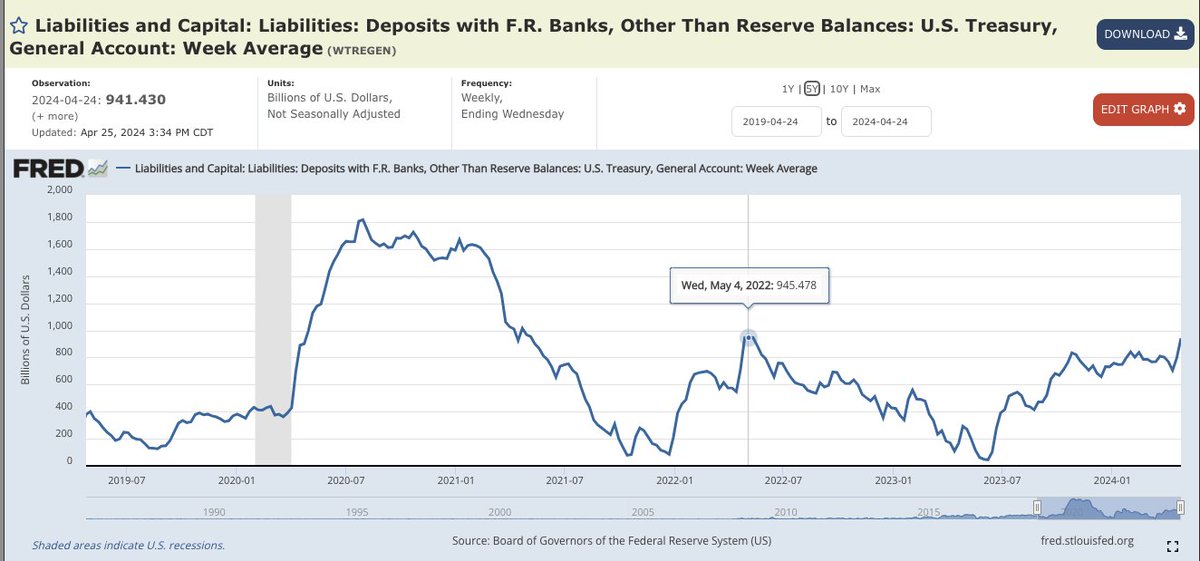
TGA has accumulated over 900 billion, almost the same as the end of April 2022, so it can be considered ample ammunition.
10-year Treasury bond yield is at 4.67%, based on past experience, when it reaches around 5%, the Fed and the Treasury may start to intervene
Another factor is inflation.
So, currently, the market is viewed neutrally. The main things to watch are 1/something breaking and 2/whether TGA is starting to spend.
免责声明:本文章仅代表作者个人观点,不代表本平台的立场和观点。本文章仅供信息分享,不构成对任何人的任何投资建议。用户与作者之间的任何争议,与本平台无关。如网页中刊载的文章或图片涉及侵权,请提供相关的权利证明和身份证明发送邮件到support@aicoin.com,本平台相关工作人员将会进行核查。


