
24/04/08BTC halving countdown 12 days, pressure below the converging triangle, reduce positions and wait for the opportunity to buy the dip!
24/04/10BTC converging triangle false breakout, increasing risks before halving, waiting for medium to long-term layout opportunities?
24/04/12BTC short-term needle insertion, unable to break through the pressure, significant decline during halving period inevitable?
24/04/13BTC multiple tops, significant distribution before halving, is it a buying opportunity or will it continue to decline, will a black swan event occur?

We have always believed that this wave of rise is a rebound, not a reversal. Some have said that if it cannot reclaim 68200, the downside risk is still unresolved. Yesterday, we reminded to fill the gap at 67000. A 4-hour bearish divergence + descending wedge appeared. We said that if it falls below 65700, it will need to pull back. If it cannot hold above the BOLL midline, it will fall to 63000-64500, and the lowest price dropped to 63606. Ethereum dropped to 3140.
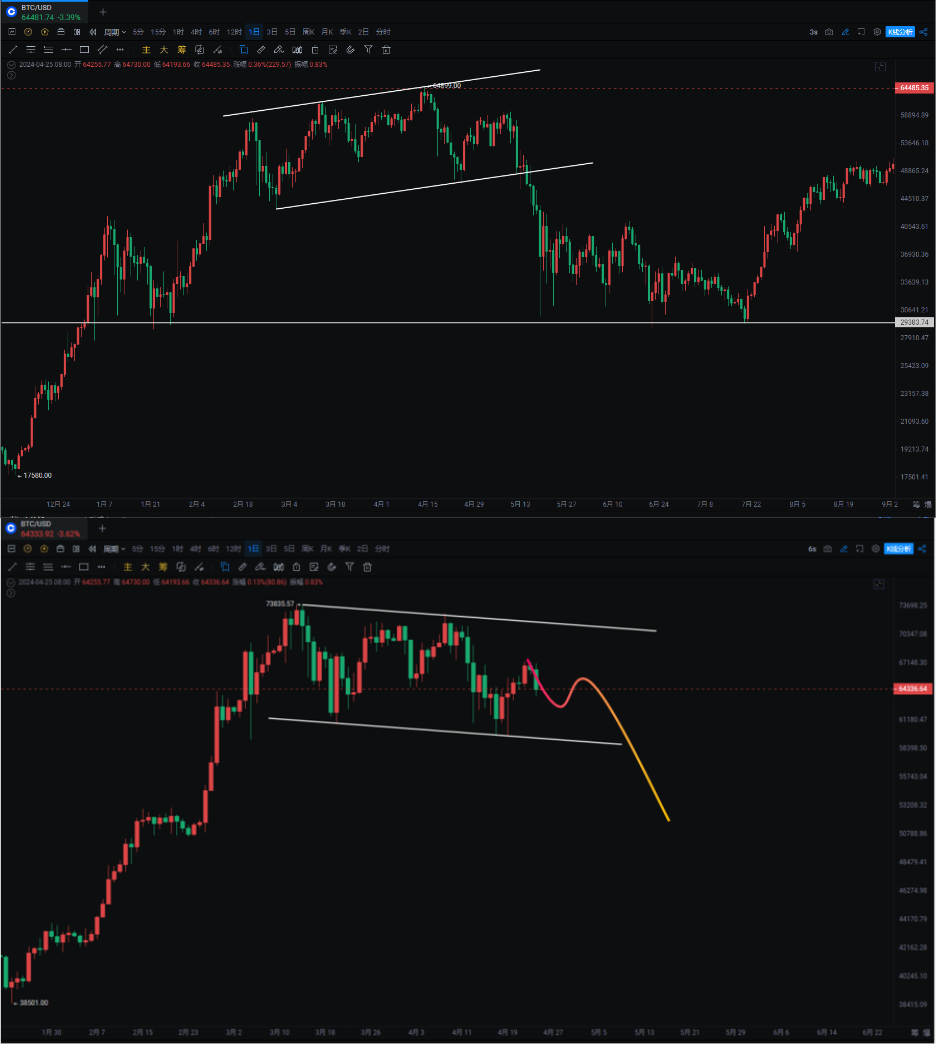
Bitcoin The daily chart shows a bearish signal of an evening star, with effective support at 63000 below. If it falls below 59600 here, it may not hold, and important support cannot be tested frequently, as testing it too often will make it difficult to hold. The weekly KDJ turns downward, OBV crosses below the yellow line, and the MACD histogram continues to shorten. If it crosses below the zero axis, it will be a longer-term adjustment at the weekly and monthly levels.
Daily chart The arc bottom + head and shoulders pattern failed, and the price is under pressure below the MA20 and MA60, indicating a potential pullback to 53000-56000. This is similar to the previous drop from 64899 in 2021, and there is a possibility of a sharp drop to 519, which experienced traders are familiar with. Reduce positions in spot if necessary, and the initial position before the drop below the previous low of 59600 should be exited to avoid uncontrollable risks. (If a sharp drop occurs due to a black swan or gray rhino event, there will definitely be a reason, otherwise retail investors will not accept it.)
4-hour and 6-hour charts Previously, we mentioned two arc bottoms + head and shoulders pattern, and the latest one was rejected and formed multiple M tops above, indicating a flag pattern used for upward or downward breakthroughs. Currently, the resistance above is significantly smaller than the support below. The 4-hour bearish divergence + descending wedge has also played a role.
Support: Resistance:
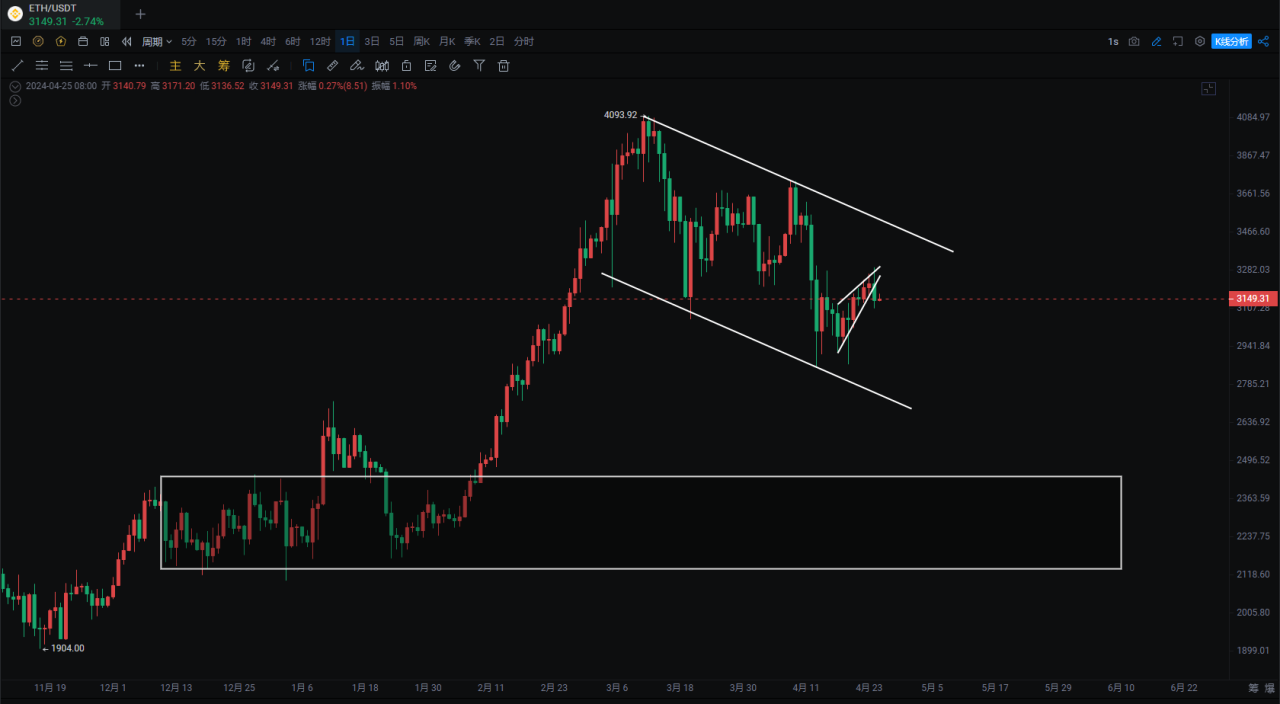
Ethereum The weekly MACD crossed below the zero axis, and the fast and slow lines intersected. The OBV indicator temporarily rebounded near the yellow line, but the strength is not strong. The daily chart is under pressure below the BOLL lower band, forming a complete downward flag. If Bitcoin really experiences a sharp drop, it is not ruled out that Ethereum will return to the starting point of this wave at 2$$$-2$$$.
Support: Resistance:
If you like my views, please like, comment, and share. Let's navigate the bull and bear markets together!!!
The article is time-sensitive and is for reference only, with real-time updates.
Focus on candlestick technical analysis, win-win global investment opportunities. Official account: 交易公子扶苏

免责声明:本文章仅代表作者个人观点,不代表本平台的立场和观点。本文章仅供信息分享,不构成对任何人的任何投资建议。用户与作者之间的任何争议,与本平台无关。如网页中刊载的文章或图片涉及侵权,请提供相关的权利证明和身份证明发送邮件到support@aicoin.com,本平台相关工作人员将会进行核查。


