
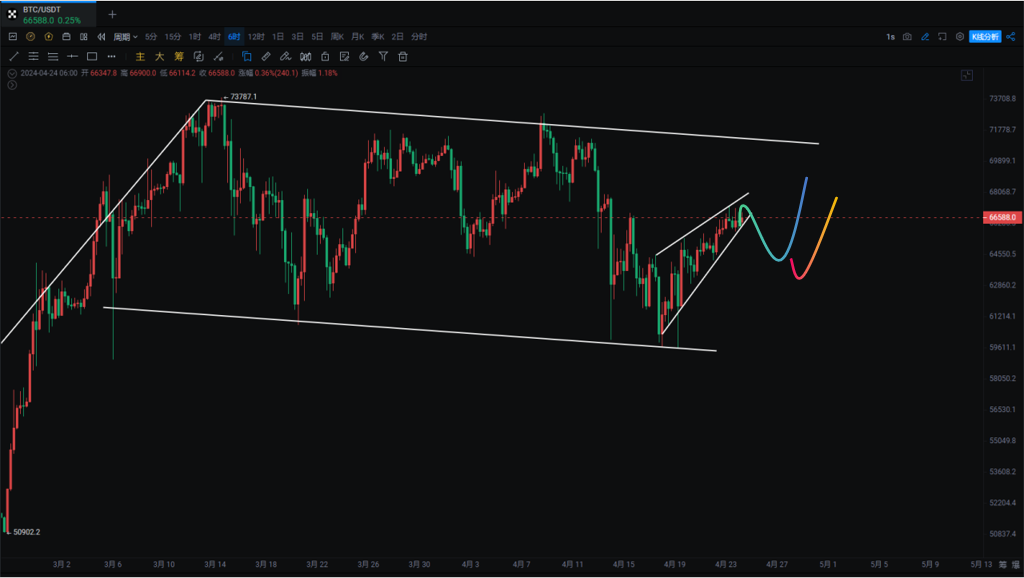
Bitcoin After rebounding from the triple bottom at 60600 on the 19th, it has currently reached 67248, with a rebound of nearly 70000 points and a 10% increase. Ethereum also reclaimed nearly 10% of its gains after the second bottom. Bitcoin filled the CME gap at 67000, and the price line oscillated near the BOLL midline. If it can stabilize at the midline, the probability of reaching 72000 will increase. If it cannot stabilize effectively, it will retest 63000-64500 and continue to rebound.
Bitcoin On the daily chart, a flag-shaped consolidation breakout increases the probability of reaching 80000-100000. In the short term, Bitcoin's rebound at 0.618 (67752) is blocked. If there is an opportunity to retest, it can continue to go long.
4-hour bearish divergence
Looking at the bearish wedge, the important support at 65700 must not be broken. If it is broken, a pullback is expected. For now, the rebound continues.
Support: Resistance:
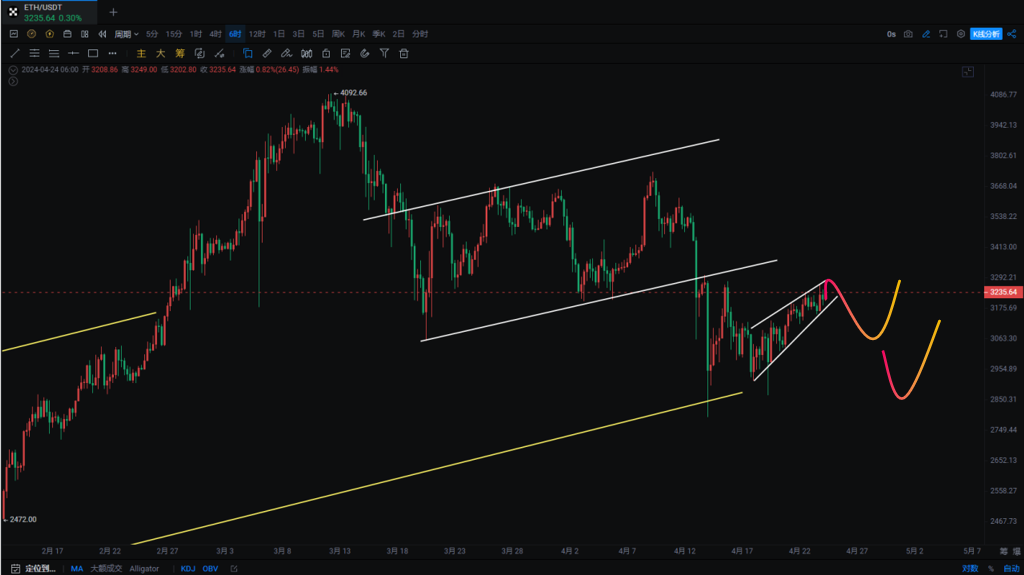
Ethereum Ethereum also formed a descending flag pattern, currently under pressure at the midline. On the daily chart, there is a divergence between the fast and slow lines, and the OBV indicator has crossed the yellow line. On the 4-hour chart, it has formed a similar bearish wedge to Bitcoin, with the rebound being resisted below the Fibonacci 0.5 (3297). If it can break through, the descending wedge will be resolved; if not, it will continue to pull back and look for a rebound.
Support: Resistance:
If you like my views, please like, comment, and share. Let's navigate the bull and bear markets together!!!
The article is time-sensitive and is for reference only, with real-time updates.
Focus on candlestick technical research, and win-win global investment opportunities. WeChat Official Account: 交易公子扶苏

免责声明:本文章仅代表作者个人观点,不代表本平台的立场和观点。本文章仅供信息分享,不构成对任何人的任何投资建议。用户与作者之间的任何争议,与本平台无关。如网页中刊载的文章或图片涉及侵权,请提供相关的权利证明和身份证明发送邮件到support@aicoin.com,本平台相关工作人员将会进行核查。


