According to previous research on the relationship between Bitcoin and the Nasdaq, the price trend of Bitcoin is highly correlated with the Nasdaq index, acting as an amplifier of Nasdaq volatility. Currently, the Nasdaq has dropped by 8.5% to the MA120 level, while Bitcoin has dropped from its high of 74,000 to a low, representing an 18% decrease. However, Bitcoin is showing signs of rebound before the Nasdaq, and based on the historical relationship between the Nasdaq and the MA120, the probability of a deep decline in the Nasdaq is relatively low. Correspondingly, in the case of Bitcoin, unless an extreme black swan event occurs in the market, or the Nasdaq continues to decline due to the impact of the first-quarter financial reports of US technology stocks this week, the likelihood of a major decline is relatively low. It may even follow the rebound of the Nasdaq before making a directional choice.
(20231130, Relationship between Bitcoin and the Nasdaq)
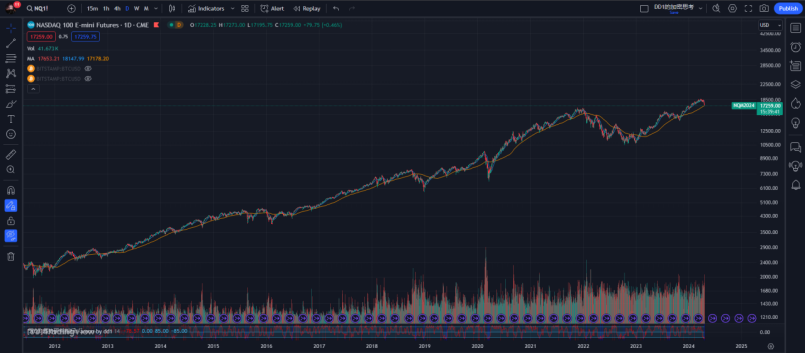
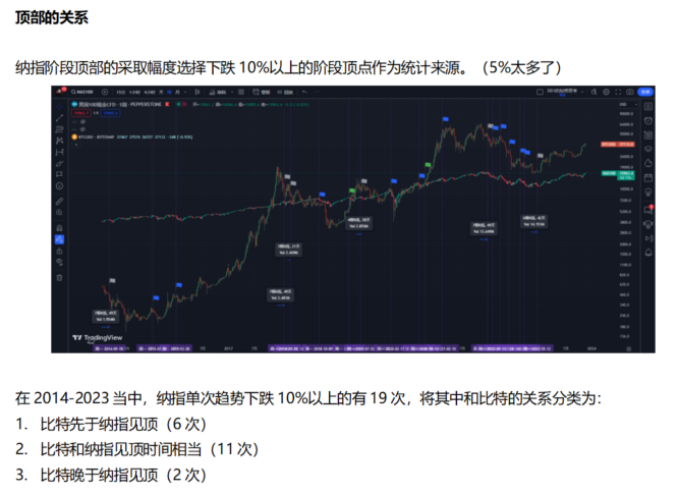
(20240422, Relationship between the Nasdaq trend and the MA120)
Last week, on the 17th, Powell continued his hawkish remarks, maintaining a "cautious" attitude towards future rate cuts. Subsequently, the New York Fed expressed the view on the 18th that it is expected to end the reduction of its balance sheet early next year or in the middle of the year. At the same time, the Fed's Beige Book showed that US consumer spending has hardly increased, and overall price increases remain moderate, indicating that US inflation is expected to remain slow in the future. This is in stark contrast to the previous PCE and CPI indicators. On one hand, the market is speculating on the slowdown of rate cuts, while on the other hand, it continues to speculate on the control of inflation. Whether the future involves continuing to raise interest rates or suddenly cutting them, the Fed has left enough room for maneuver.
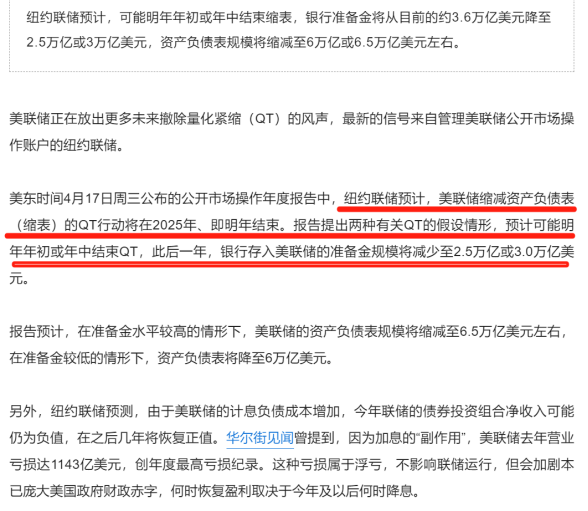
(20240418, New York Fed "previews" the withdrawal of the QT roadmap: the Fed may stop reducing its balance sheet next year)
It is impossible to continue raising interest rates, and cutting rates is already a foregone conclusion. The closer the expectation of rate cuts, the more susceptible it is to the influence of data and external factors. Currently, my view on the tightening of medium-term liquidity in the United States remains unchanged. In terms of domestic US conditions, the intuitive observation of future liquidity data is the decrease in bank deposit reserves and the change in the balance of the US Department of the Treasury due to tax payments (i.e., the change in mid-term liquidity due to the reduction of the balance sheet).
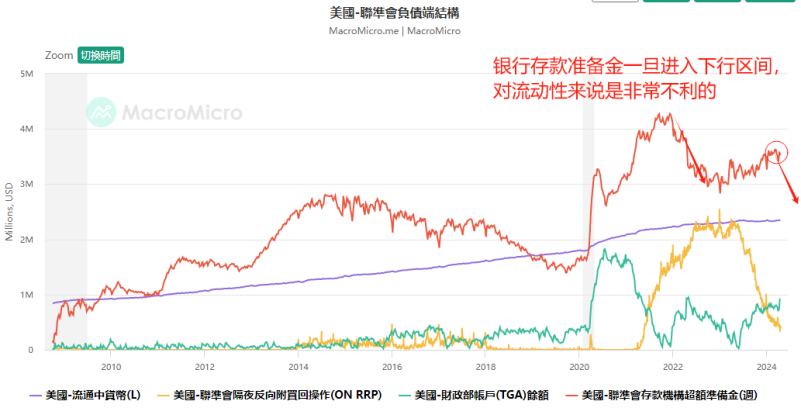
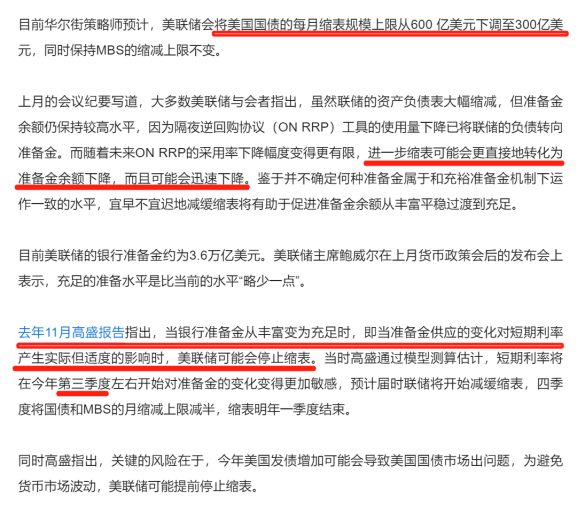
(20240422, Structure of the Fed's liabilities)
Currently, the scale of the balance sheet reduction is 950 billion per month. Starting in May, the Fed's reduction of the balance sheet will decrease by 300 billion per month, or approximately 650 billion per month, until early next year or the middle of the year. The Fed plans to reduce bank reserves from the current 35 trillion to a range of 25-30 trillion.
(20240409, Xiaohei's view on future liquidity)
Xiaohei's new article "heatwave" on April 9, 202404, mainly discusses three things.
Explanation of BTFP and recent liquidity. It mainly explains that after the termination of BTFP, the Fed has indirectly injected liquidity into the market by changing the collateral rules for the discount window. The Fed has relaxed bank capital requirements and will exempt UST (deposit capital used to purchase bonds) from SLR (supplementary leverage ratio) in the future to covertly print money. As long as the yield on government bonds does not exceed the nominal GDP growth rate (real interest rates are negative), most financial asset prices will continue to rise.
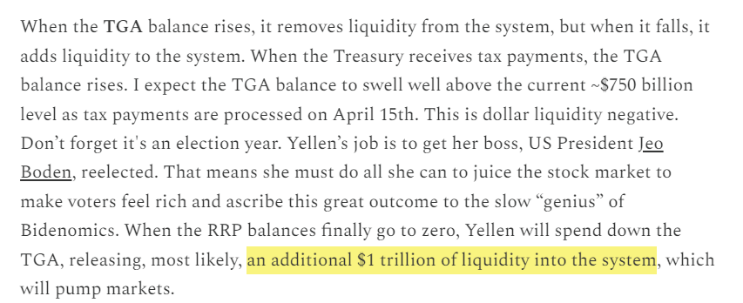
Another method of judging the source of liquidity comes from the amount of taxes paid during the 2023 tax year expiration period from April 15, 202404 to May 1, 202404, the speed of quantitative tightening (QT), and the balance of the TGA. Taxes have reduced liquidity to a certain extent, but this reduced liquidity will enter the TGA in the future, i.e., the balance of the Department of the Treasury's account, which is currently approximately 750 billion USD in size. At the same time, with the slowing pace of QT (reducing QT by 300 billion USD per month starting in May), these factors provide security for liquidity in the year. The period of instability for risk assets is from April 15, 202404 to May 1, 202404. After May 1, liquidity will gradually improve.
The Bitcoin halving (April 20, 202404) is often seen as bullish, but currently, the liquidity of the US dollar is tighter, leading to a stronger trap for long positions.
According to Xiaohei, considering the increase in tax payments to the Department of the Treasury from April 15, 202404 to May 1, the reduced liquidity due to the decrease in bank reserves will be supplemented by the TGA balance, which is the source of liquidity stimulated by Yellen for the economy. Before tax payment, the TGA balance was approximately 750 billion, and it will likely rise to over 1 trillion afterwards. This TGA balance and the decrease in overnight reverse repurchase agreement (ON RRP) will provide at least 1 trillion in liquidity for the market in the second half of the year.
Now, I will share my opinion. Unlike Xiaohei's view, from a medium to long-term perspective, looking at the trend of bank deposit reserves and historical stock price trends, when bank deposit reserves are in a downward trend, the performance of the cryptocurrency market tends to be not very good, and it may even be the beginning of a bear market, such as in 2014-2016, 2018-2019, and 2022-2023 (although the period of 2016-2017 was the opposite, I believe it had a stimulating effect on the demand side after a major crash). The role of bank deposit reserves is more important than the size of overnight reverse repurchase agreements and the balance of the Department of the Treasury. It is a direct source of liquidity for the demand side of lending, and the balance of the Department of the Treasury needs to release liquidity to the market. Not to mention whether it can completely offset the decrease in the amount of deposit reserves, considering the government's other mandatory expenditures, it is also questionable how much of the share that can flow into the market.
Therefore, considering the background of the medium to long-term decline in bank deposit reserves, and in conjunction with the Nasdaq's support near the MA120, I will consider the current rally in Bitcoin from 60,000 at the macro level as a rebound. The target of the rebound is uncertain, and it will be observed as it progresses. 67,000 is the strong-weak boundary line of the current oscillation range. If Bitcoin stabilizes above the MA21, there may be a new high. It is possible to make a decision in sync with the subsequent right-side trend of the Nasdaq.
The difference in the medium-term views between Xiaohei and me does not affect our short-term trial positions, but it affects the positions of long-term orders below and the timing of short-to-long transitions. It also affects the size of the current short-term holding positions and the risk control requirements (for example, the expected profit of the shanzhai position entered on the left side of 60,000 in Bitcoin may decrease in the short term, and the setting of the original stop loss after maintaining a certain profit, etc.).
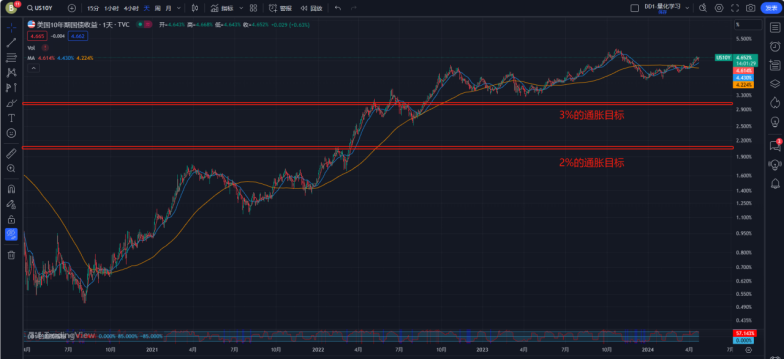
(20240422, US 10-year Treasury yield US10Y trend)
The US 10-year Treasury yield is a direct reflection of the current "real inflation" and can also serve as a side reference for current liquidity. Since the outbreak of the pandemic, when the US10Y exceeded 2%, starting from February 2022, and then the Fed officially raised interest rates in March, the market had already reacted before that, leading to inflation due to the release of liquidity. To solve inflation, it is necessary to raise interest rates and reduce the balance sheet. Currently, the US10Y is making a comeback, rising to around 4.6%, far from the hard target of 2% and not close to the soft target of 3%. Is it necessary to release liquidity on its own to bring down the government bond yield as it did from October to December last year? Unless there is a well-known reason, it seems unlikely in the short term.
The short-term decline in US10Y has a promoting effect on short-term liquidity, but the high probability of a sharp drop in US10Y is likely due to a black swan event. Currently, the trend of Bitcoin is seriously deviating from that of US10Y. Is it a trap for long positions or is it developing an independent trend? Considering the judgment of bank deposit reserves mentioned above, it still needs further observation in the short term (do not use leverage, and do not believe in strong continuity). If a similar trend to that of October to December last year is replicated after May, perhaps this trillion-dollar liquidity can bring about another market trend, but from a medium-term perspective, I believe this upward trend is likely to be a trap for long positions.
The impossible triangle of demand, inflation, and debt is the main contradiction affecting monetary policy at present. The three factors influence and restrain each other. Using financial advantages, the strategy is to outlast others before making a move.
免责声明:本文章仅代表作者个人观点,不代表本平台的立场和观点。本文章仅供信息分享,不构成对任何人的任何投资建议。用户与作者之间的任何争议,与本平台无关。如网页中刊载的文章或图片涉及侵权,请提供相关的权利证明和身份证明发送邮件到support@aicoin.com,本平台相关工作人员将会进行核查。


