每日分享
首先大饼最近跌到60000附近,山寨直接清除了2倍以上杠杆的合约,高位买入现货的新韭菜很多因为恐慌,割肉了不少,所以现阶段基本上回调已经差不多了,当下已经处于机会大于风险的阶段了。再往下跌的空间非常有限,这个时候再恐慌就真的没必要了。
但这并不意味着短线里大饼和以太不会往下再创个低点,所以现货找机会分批入,合约想要入对一个安全低风险的位置的话,仍然需要耐心等待和观察。
下一波上涨,个人预期的目标是最低8万,正常应该看10~12万美金。以太看4800~6000,莱特看250,sol看320~380
BTC
短线由于行情变化较快,文章只能对发布那一刻的行情变化做出预判,短线玩家注意行情最新的变化,仅仅作为参考即可。
1H:
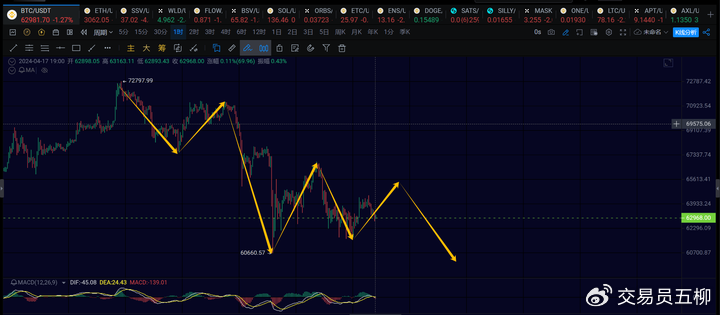
1h级别,当前有可能在61500~66000区间内盘整一个1h级别的中枢(盘整中枢的意思就是在某个区间内反复震荡构造出一个形态)。短线应该在走一笔1h级别的反弹,这笔反弹关注66700,只要不突破这个位置,后续就还有一笔1h级别的下跌再次破60660.
个人预计短期4h级别的下跌浅一点就是6万附近,深一点就再插针破下69500后快速收回6万结束下跌。
15M:
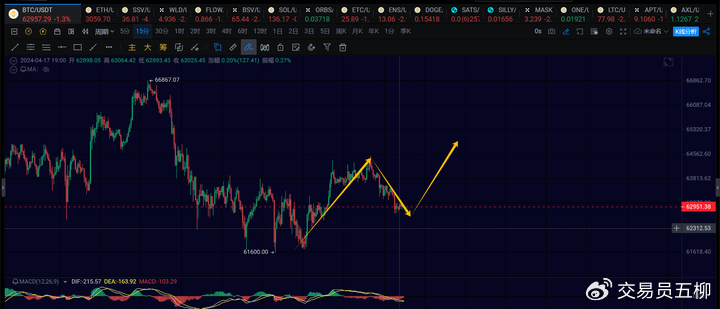
15分钟级别,这里正常还有一笔15分钟级别的反弹去65000附近。反弹以后大概还会再次下跌走一笔离开段的1h级别的下跌。但如果15分钟级别回调跌破了62300,则大概率1h反弹就没有走出来。
ETH
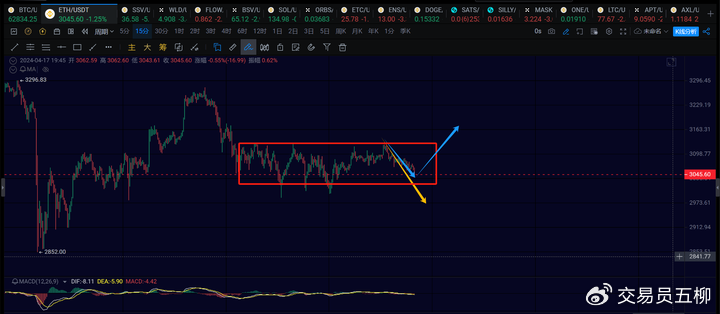
以太这里需要观察一下,因为这里盘整了15分钟级别的中枢,看是向上走出一笔15分钟级别的上,完成一笔1h级别的反弹,还是继续向下延伸1h级别的下跌。对于4h级别,以太大概率还需要再去一趟2850附近或者其下方。
趋势方向
周线级别:方向向上,目前是自15476开始的周线反弹的延续,何时结束关注后续日线情况
日线级别:方向向下,当前正在运行一笔日线回调,这笔已经走到中后期或者末期了
4小时级别:方向向下,大目前属于日线回调中的第三笔4h下跌,下方关注59000~60000
1小时级别:方向向下,短线有可能盘整一个1h中枢后再下跌打个低点
15分钟级别:方向向上,看能否再走出一笔15分钟级别的上
欢迎大家关注我的公众号一起讨论交流:

文章具有时效性,注意风险,以上仅个人建议,仅供参考!
免责声明:本文章仅代表作者个人观点,不代表本平台的立场和观点。本文章仅供信息分享,不构成对任何人的任何投资建议。用户与作者之间的任何争议,与本平台无关。如网页中刊载的文章或图片涉及侵权,请提供相关的权利证明和身份证明发送邮件到support@aicoin.com,本平台相关工作人员将会进行核查。


