Cryptocurrency News
April 14th Hot Topics:
1. A whale spent 70 million USDC to buy 23,790 ETH 4 hours ago.
2. The entire network has liquidated $949 million in the past 24 hours.
3. The Iranian delegation to the United Nations stated that military actions have ended, and cryptocurrencies have rebounded in response.
4. The White House: The United States will support Israel in dealing with the Iranian threat.
5. A whale was liquidated for 4,539.7 ETH collateral in the early morning on Aave to repay a 203 WBTC loan.
Trading Insights
In cryptocurrency investment, analyzing the market situation inevitably involves considering support and resistance levels. So, what should be noted when using support levels for analysis?
(1) In an upward trend, during the pullback process, a bearish candlestick appearing after a bullish one indicates weakness, especially when the trading volume shrinks near the support level, followed by a bullish candlestick quickly engulfing the bearish one, leading to a price increase. This is an effective support level.
(2) In an upward trend, during the pullback process, frequent appearance of bearish candlesticks indicates an increase in bearish momentum. Even if there is a slight rebound near the support level, the buying power is weak, and the price will eventually fall below the support level, signaling a trend reversal.
(3) A consolidation near the support level, followed by a period of consolidation and the appearance of a long bullish candlestick, indicates effective support.
(4) A consolidation near the support level, followed by a long bearish candlestick breaking through the support level, prompts investors to sell to minimize losses, leading to a continued price decline.
(5) A price trend breaking through the support level from top to bottom indicates a shift from an upward trend to a downward trend. Generally, in a major upward trend, the appearance of a medium-term downward trend, if the market falls below the support level of the medium-term downward trend, indicates the end of the major upward trend. In a medium-term upward trend, the appearance of a minor downward trend, if the market falls below the support level of the minor downward trend, indicates the end of the medium-term upward trend, and the price will continue to decline in line with the original downward trend.
(6) If the price touches or barely touches the support level from top to bottom but quickly reverses without significant trading volume, it indicates a potential rebound. When there is another downward adjustment, it is an opportunity to buy and profit from the rebound.
(7) If the price falls below the support level from top to bottom with significant trading volume, it indicates the formation of another downward trend. Selling should be considered as soon as there is a slight rebound to avoid greater losses.
(8) If the price touches the support level from top to bottom but without significant trading volume, it indicates no potential rebound, and selling early to exit the market is advisable.
In cryptocurrency investment, analyzing the market situation inevitably involves considering support and resistance levels. So, what should be noted when using support levels for analysis?
Search for the public account: "Big White Coin"
BTC
Analysis
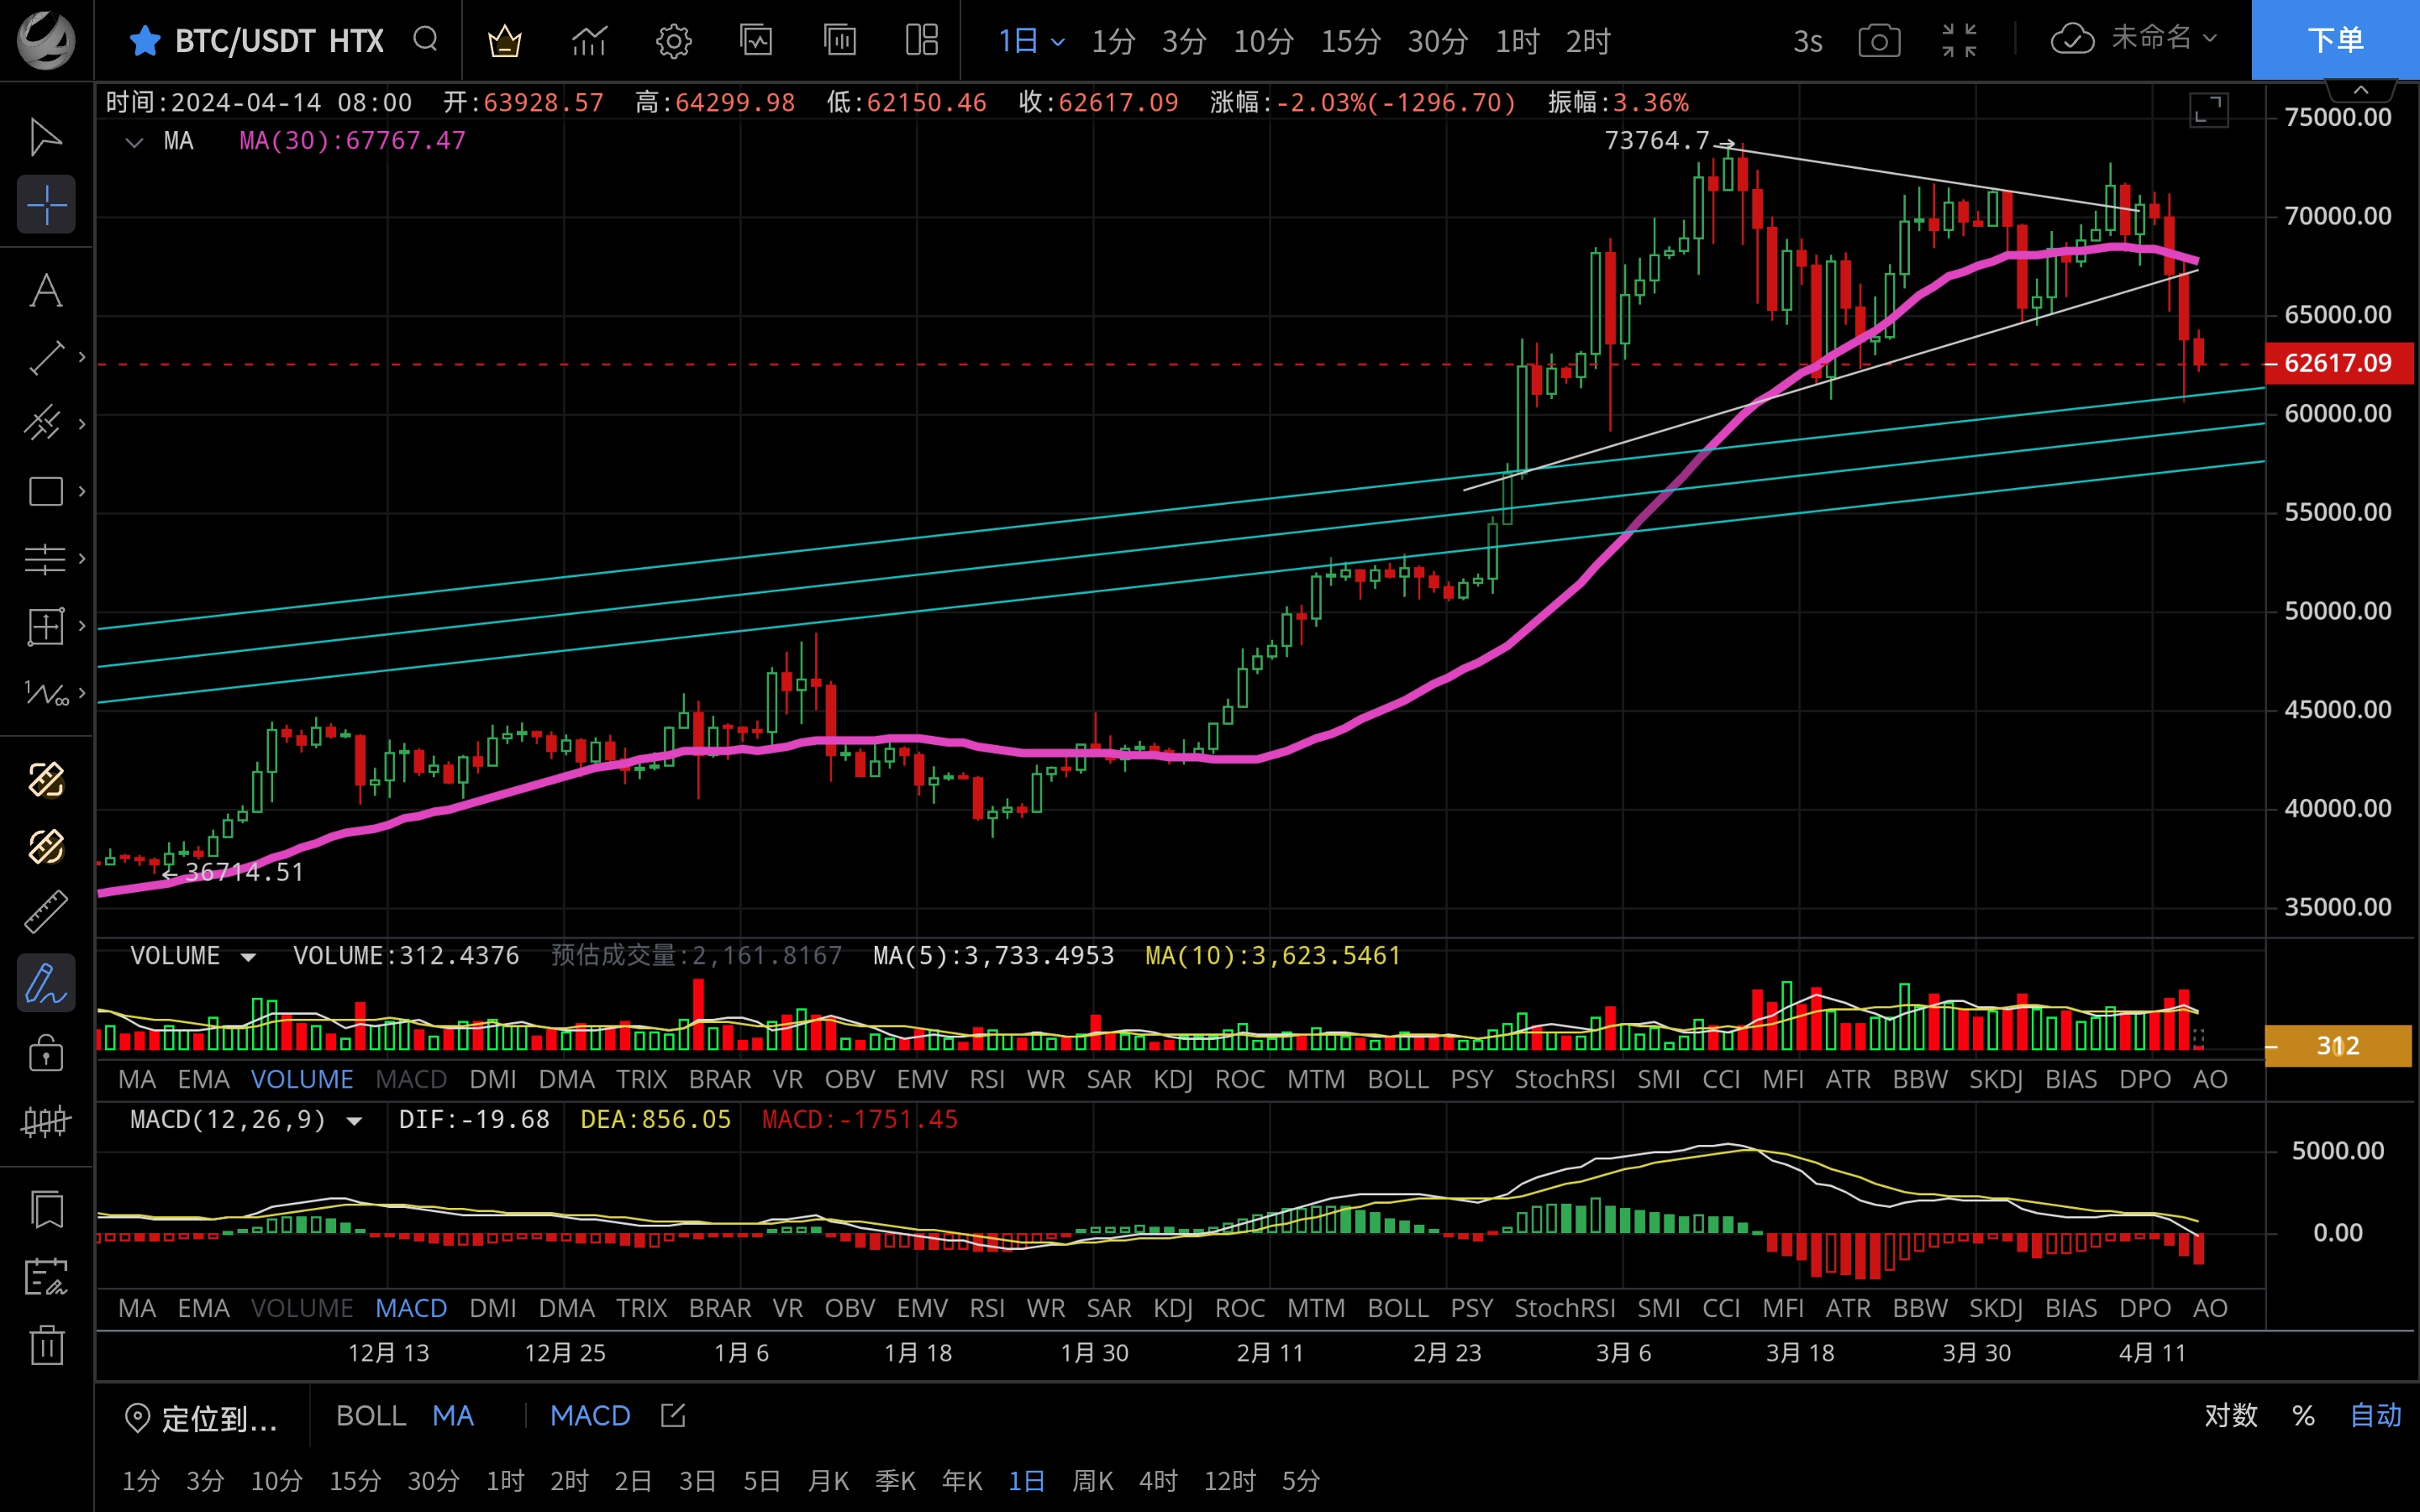
Bitcoin touched the pressure near 68,000 twice yesterday, and the early morning bearish force accelerated the decline, breaking through the new low near 60,600 and rebounding near the support, allowing long positions at low levels to profit by 4,000 points. Currently, the price is operating near 63,200. The four-hour trend has been declining for two consecutive days, washing out most of the chips in the market. It has temporarily stopped falling, but the short-term trend is still bearish. A rapid rise after dropping below 60,000 cannot be ruled out. Looking at the daily trend, if the closing price can be above the MA60, a double bottom structure will be formed. Conversely, if the entity is relatively long, there is a possibility of another decline to test the MA90 support. Do not fully buy in near 60,000 to prevent further decline. Be prepared to add positions and wait for the bright future. The resistance above is 64,000-65,000, and the support below is 61,000-60,000.
ETH
Analysis
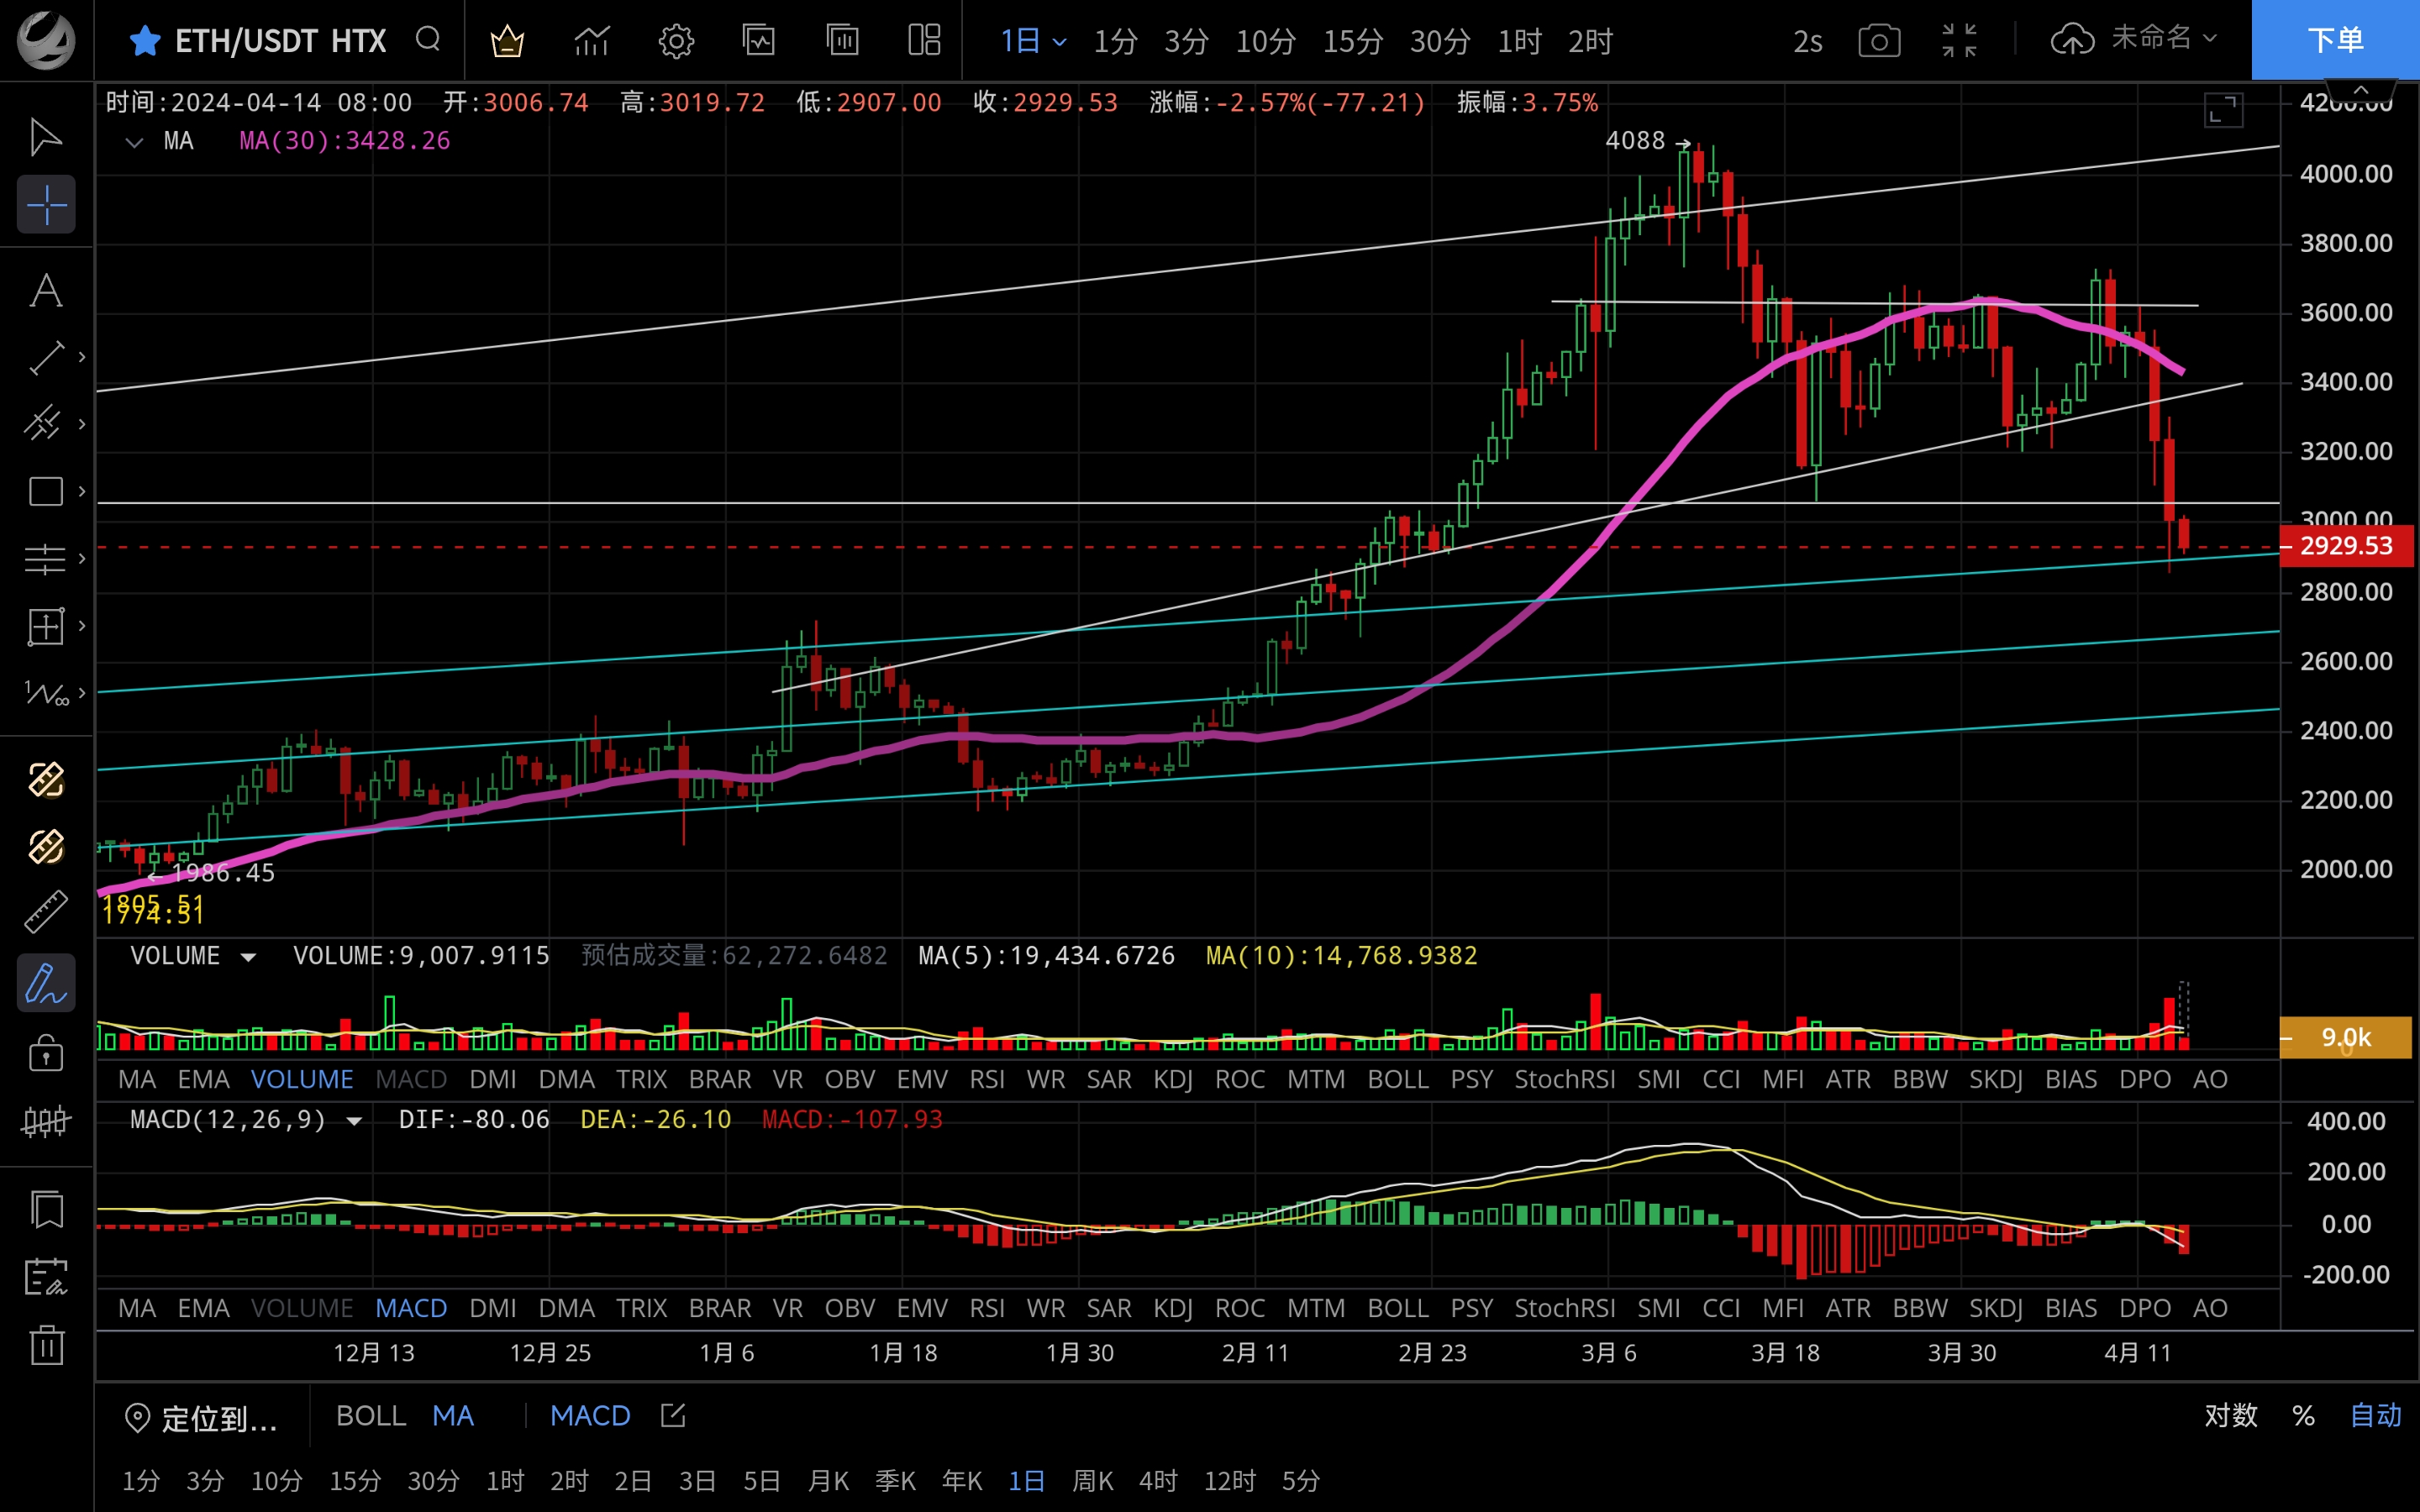
Ethereum had little fluctuation yesterday. After oscillating upward, it was resisted near 3,300, and it started to decline in the early morning, breaking through the 3,000 mark and dropping to the support around 2,852 before rebounding. Currently, the price is operating near 2,935. The four-hour candlesticks have been consistently bearish, and the rebound is relatively weak. The MACD is bearish, and there are no signs of a temporary halt to the decline. Pay attention to the previous low. If it falls below the next support at 2,800, the probability of a decline is small. On the daily level, it has continuously declined to the MA120 support, and it is not expected to fall in the short term. As long as the daily closing price is above 3,000, it is not considered an effective break. It is expected to rise again after the adjustment and regain lost ground. Personally, I am optimistic about Ethereum's future. It is recommended to buy in batches for every 100 US dollars of decline. The resistance above is 3,000-3,100, and the support below is 2,850-2,800.
Disclaimer: The above content is for reference only and does not constitute specific operational advice, nor does it bear legal responsibility. The market situation changes rapidly, and the article has a certain lag. If there is anything you don't understand, feel free to consult.
免责声明:本文章仅代表作者个人观点,不代表本平台的立场和观点。本文章仅供信息分享,不构成对任何人的任何投资建议。用户与作者之间的任何争议,与本平台无关。如网页中刊载的文章或图片涉及侵权,请提供相关的权利证明和身份证明发送邮件到support@aicoin.com,本平台相关工作人员将会进行核查。


