Click to watch the video: https://www.bilibili.com/video/BV19m411q7XX/?vd_source=04332ad6ecefd22ffa3d1b9032b40fb3
Currently, whether from the perspective of Bitcoin or Dogecoin's form, there are also quite a few triangular forms. I now believe that Bitcoin has once again become an ascending triangle form. Will it break through in the short term? Or if Bitcoin continues to rise, Dogecoin also has a converging triangle form. If it breaks through, where will the next target be?

Let's first take a look at the daily level of Dogecoin. Currently, Dogecoin also has a converging triangle form on the daily level. So, whether it's Dogecoin or Bitcoin's market trend in the past few days, it's still mainly focused on the ultra-short term, including yesterday when Dogecoin fell to around 0.18.
I believe many fans and friends do not want it to continue to fall because many friends have long positions in Dogecoin, and their positions are relatively heavy. So here, I also give everyone a suggestion: if you must trade in altcoins, then the position you take must be controlled within 30%. The remaining positions should still be mainly focused on ultra-short term trading of Bitcoin or Ethereum.
Now let's take a look at the converging triangle of Dogecoin. Currently, there is a very important uptrend line here, which is the position of 0.18 that cannot be broken. In the past two days, Dogecoin reached the position of 0.19, but due to the influence of Bitcoin, it fell to around 0.18 yesterday. I previously thought that the support of the previous box was relatively strong and did not expect it to fall.
It has now risen, and I believe the main force of Dogecoin is also watching whether the main force of Bitcoin is going to break through or fall at this position. So we should pay attention to this position as much as possible. If Bitcoin can break through, then I believe the main force of Dogecoin will also produce another bullish candlestick at this position and stabilize the current box, or break through the current converging triangle. Only then will there be hope of breaking the historical high this month.
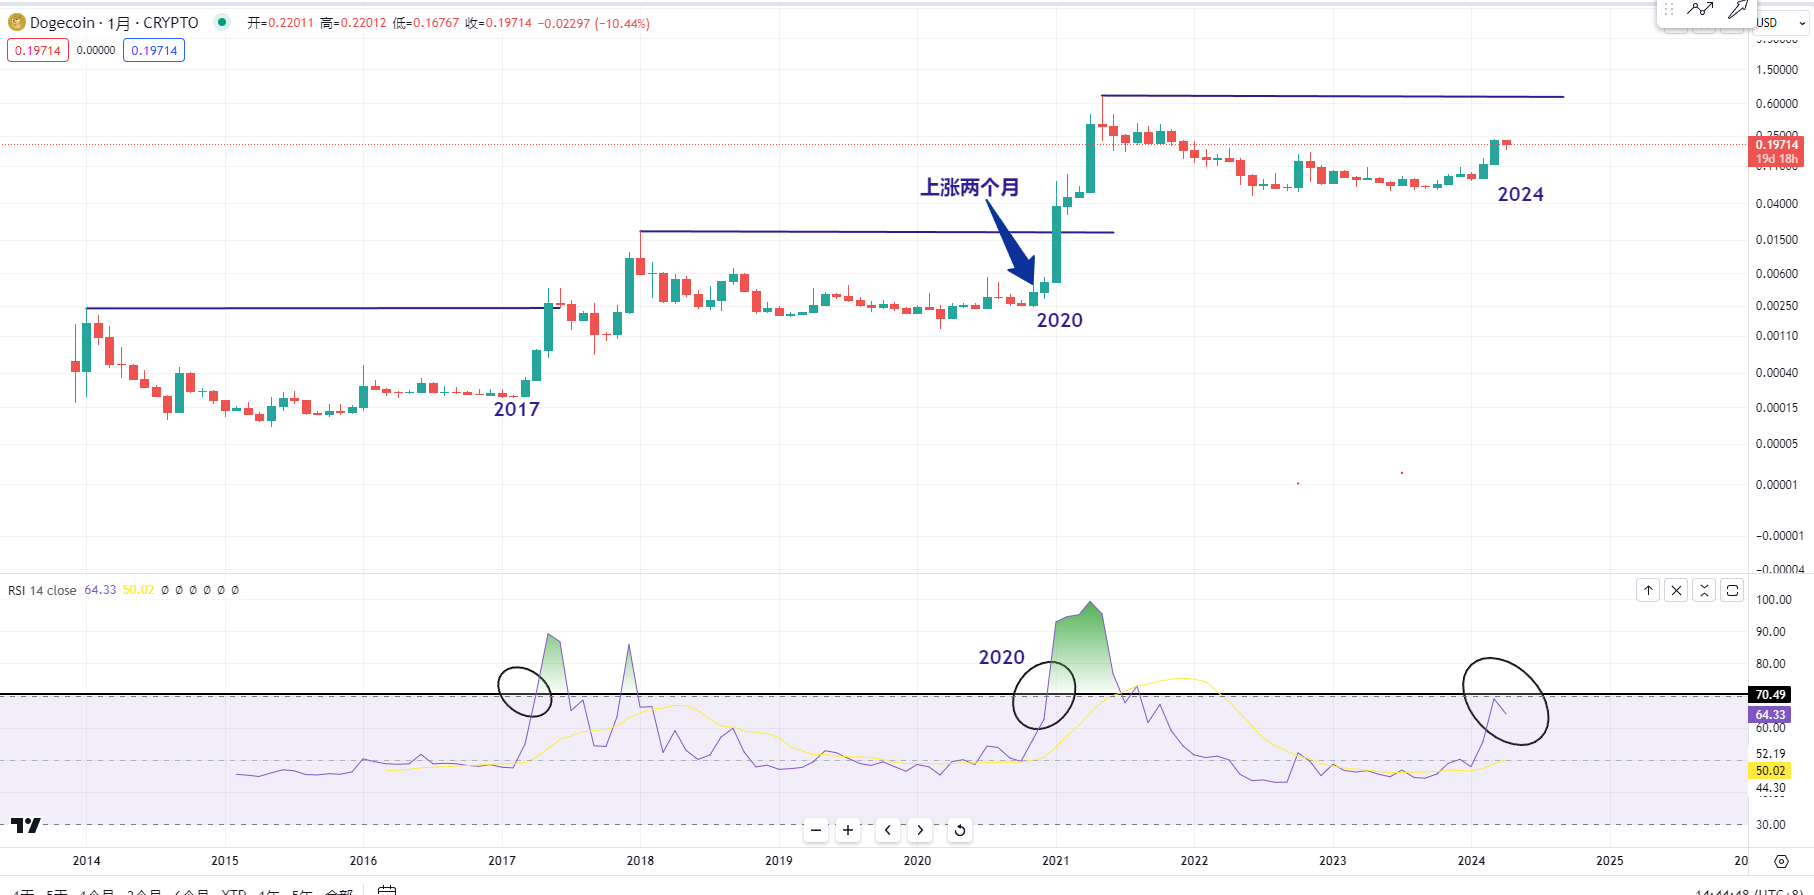
And we can also take a look at the monthly chart of Dogecoin. According to historical experience, we can see that in 2020, after two consecutive months of trend breakthrough, the RSI indicator at the bottom came to around 70 to 80. Currently, the RSI indicator is also very similar to the RSI indicator in 2020.
As long as Bitcoin breaks through at this position and Dogecoin also breaks through the converging triangle on the daily chart, then it is very likely that Dogecoin this month will break the historical high. Because at this position from 2020 to 2021, it rose for two consecutive months, and in the following month, we can see that for a long time in the monthly chart, Dogecoin did not see a one-day rise of 100% in the bull market.
So since Dogecoin has risen for two months in the monthly chart this year and is very similar to historical experience, including at this position in 2017, it also rose for two consecutive months, and the RSI indicator on the monthly chart only needs to come to around 70 and break through 70.
We can observe that the next month's candlestick directly broke the historical high. In 2021, after rising for two months, it also broke the historical high. So this time in 2024, I also look forward to the appearance of a historical high.
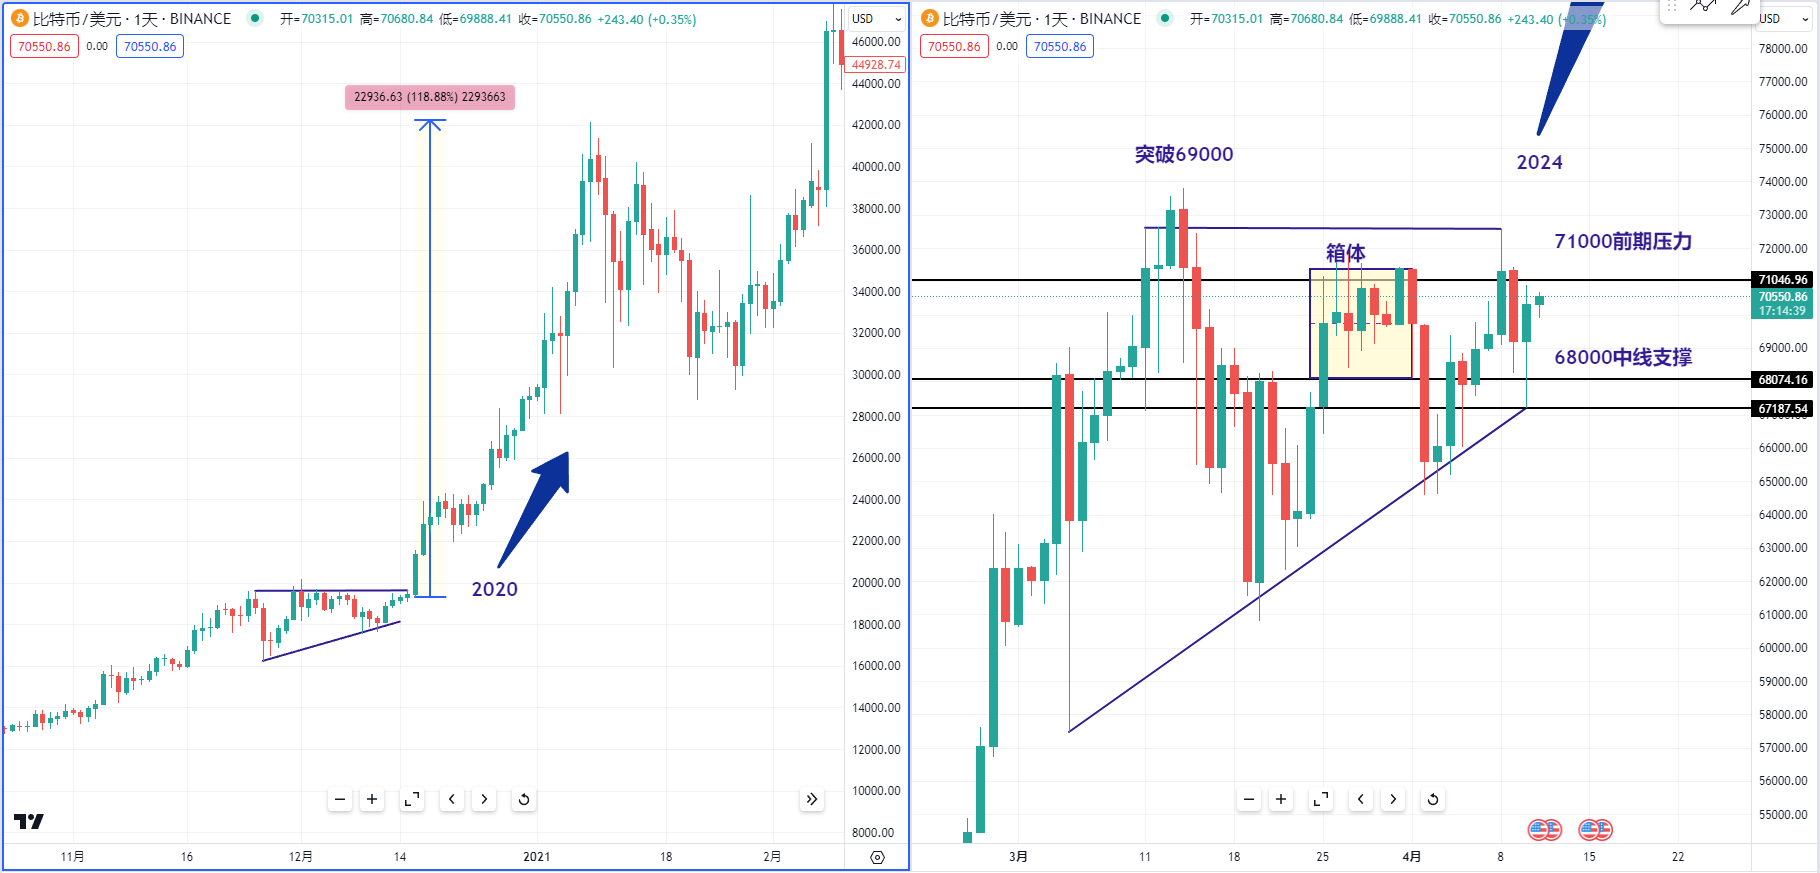
Now let's take a look at the daily level of Bitcoin. Yesterday, the low point of the upward trend and decline of Bitcoin finally held around 67000. The key now is to observe whether the current position is an ascending triangle form, which is very similar to the ascending triangle at the position in 2020 on the left chart.
Because we can observe that at this position in 2020, the price at that time also broke through the previous historical high in 2017 and then consolidated an ascending triangle at this position, ultimately starting a rally at this position. Now we can observe the current position. The last time Bitcoin broke through 69000 at this position, which is the historical high of 2021.
Now we can observe that if the ascending triangle form at this position is established, when it broke through this ascending triangle at this position in 2020, we can observe that it took about a month for it to directly rise by 100%. So if Bitcoin breaks through at this position now, is there a possibility of rising another 100% from 70,000?
However, we can see that the current position is still very crucial. If it is to break through at this position, we should try to observe whether it closes, especially the short-term 71000, which is the resistance zone I mentioned in the video a few days ago. It must effectively stand at this position at the close if it breaks through. If it does break through, we should try to observe whether there is volume.
If 71000 does not break through, we need to consider the intention of the main force. In case of a decline, we need to pay attention to a medium-term support level, which is around 68000. If the closing price at this position is weak, the closing price must not be below 68000, because we can observe that at this position, there is a turning point in the box, which is the position of the low point of the box's consolidation, roughly around 68000, which is a very important support.
Then let's go back to the daily chart of Dogecoin. Now I believe that as long as Bitcoin can continue to break through, I believe the main force of Dogecoin will definitely also be watching Bitcoin. Of course, if Bitcoin breaks through, Dogecoin will break through 0.2 in the short term, and the upper resistance level will be at 0.22. I still believe that as long as the overall market continues to rise, Dogecoin still has the hope of breaking the historical high this month.
This article is exclusively planned and published by Master Chen (WeChat public account: Coin God Master Chen). If you need to learn more about real-time investment strategies, how to get out of a predicament, spot contract trading techniques, operation skills, and candlestick knowledge, you can add Master Chen for learning and communication, as well as free copy trading. I hope to help you find what you want in the currency circle. Focusing on BTC, ETH, and altcoin spot contract trading for many years, there is no 100% method, only 100% following the trend; daily updates on macro analysis articles across the network, technical indicator analysis of mainstream coins and altcoins, and spot medium to long-term price prediction videos.

Friendly reminder: Only the column public account (as shown in the picture above) is written by Master Chen. The end of the article and other advertisements in the comment area are not related to the author. Please be cautious in distinguishing between true and false. Thank you for reading.
免责声明:本文章仅代表作者个人观点,不代表本平台的立场和观点。本文章仅供信息分享,不构成对任何人的任何投资建议。用户与作者之间的任何争议,与本平台无关。如网页中刊载的文章或图片涉及侵权,请提供相关的权利证明和身份证明发送邮件到support@aicoin.com,本平台相关工作人员将会进行核查。


