Coin World Report: Cryptocurrency experts suggest that the correlation between Bitcoin (BTC) and the stock market S&P 500 index has weakened to a negative value in the recent period. This finding is particularly important for investors as it emphasizes the potential of Bitcoin as a diversification choice for investment portfolios. Although this correlation may recover in the future, the current trend indicates that Bitcoin can operate independently from traditional asset categories.
Market Analysis:
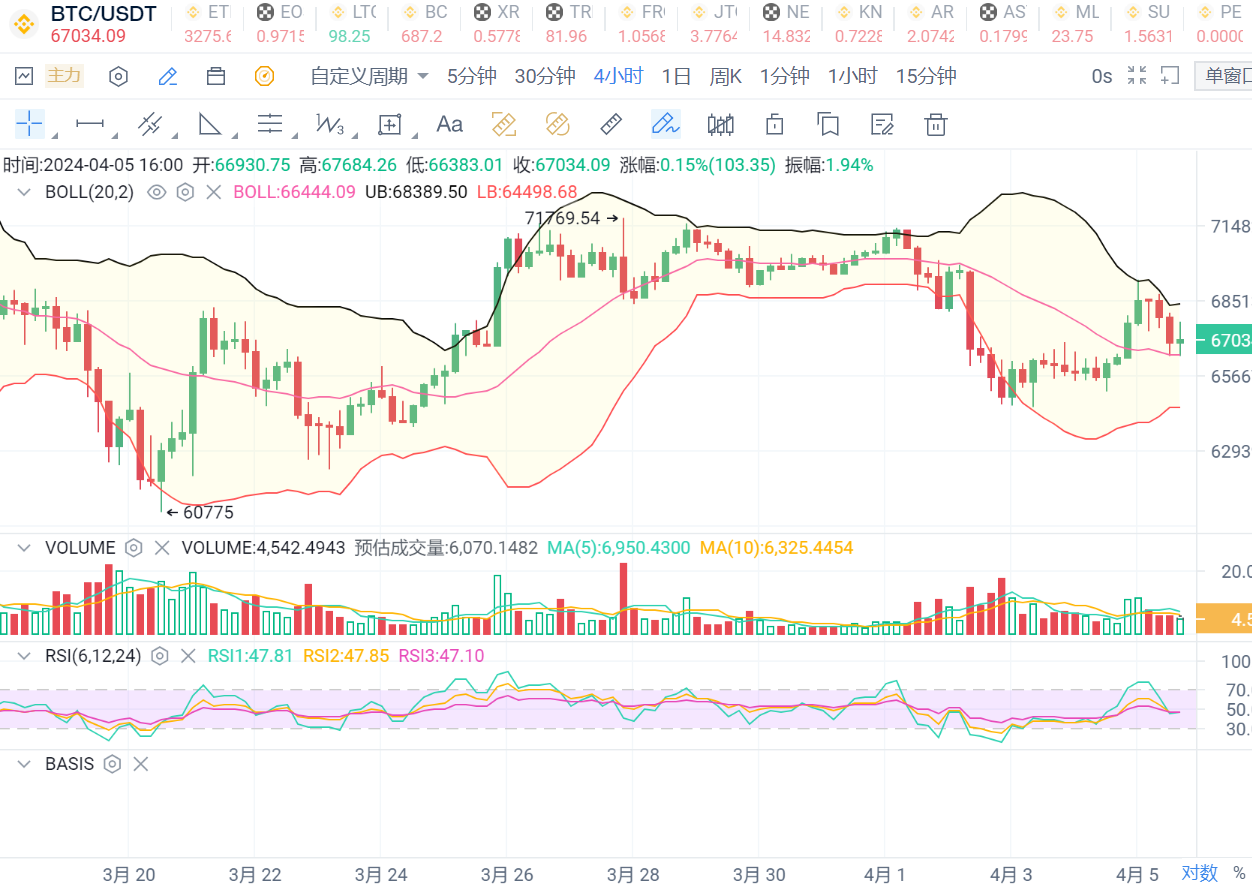
BTC: On the 4-hour chart, the price has risen above the Bollinger Band's midline, returning to a strong trend zone.
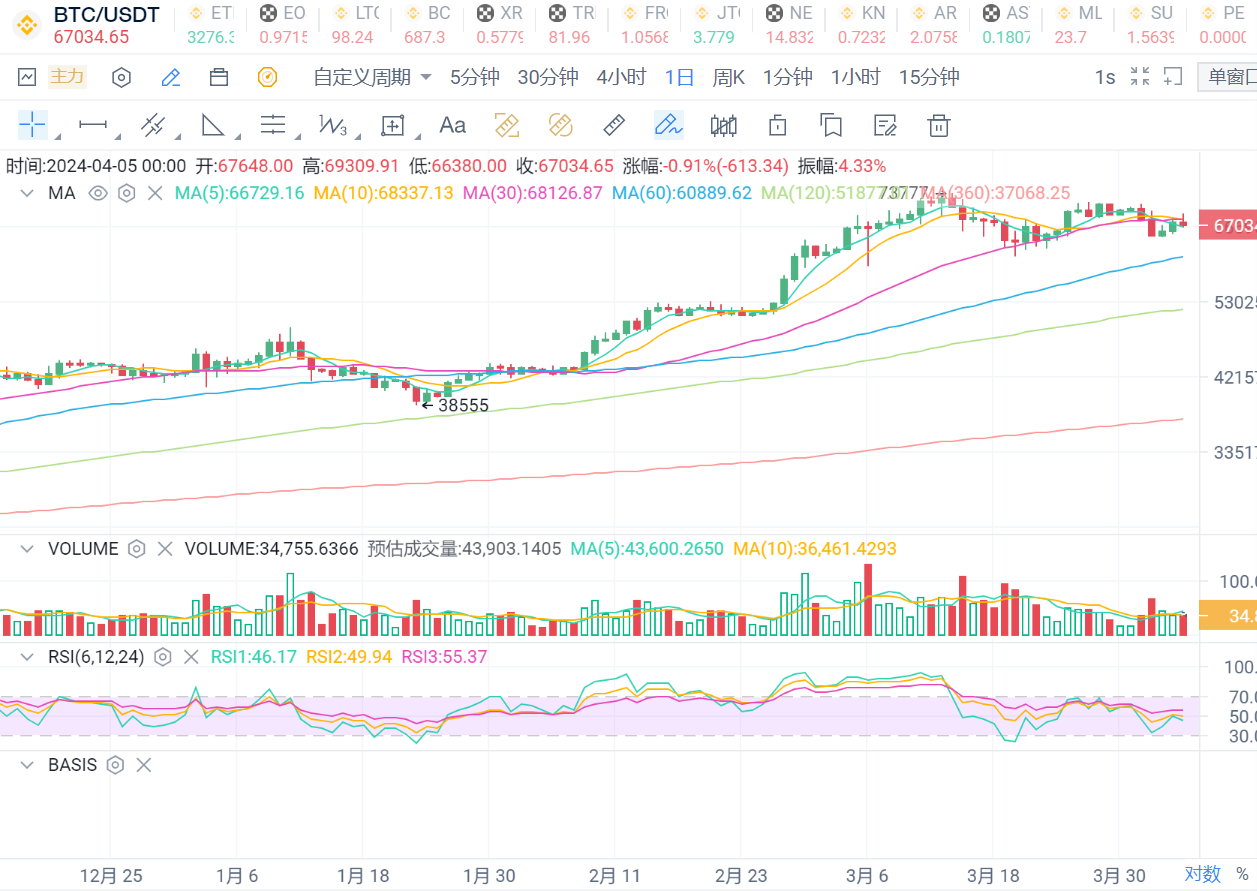
On the daily chart, the price continues to fluctuate near the moving average.
In summary, the support level is at 66800, and the resistance level is at 67200.
ETH: On the 4-hour chart, the price remains below the Bollinger Band's midline, indicating a weak trend, with support at 3240 and resistance at 3300.

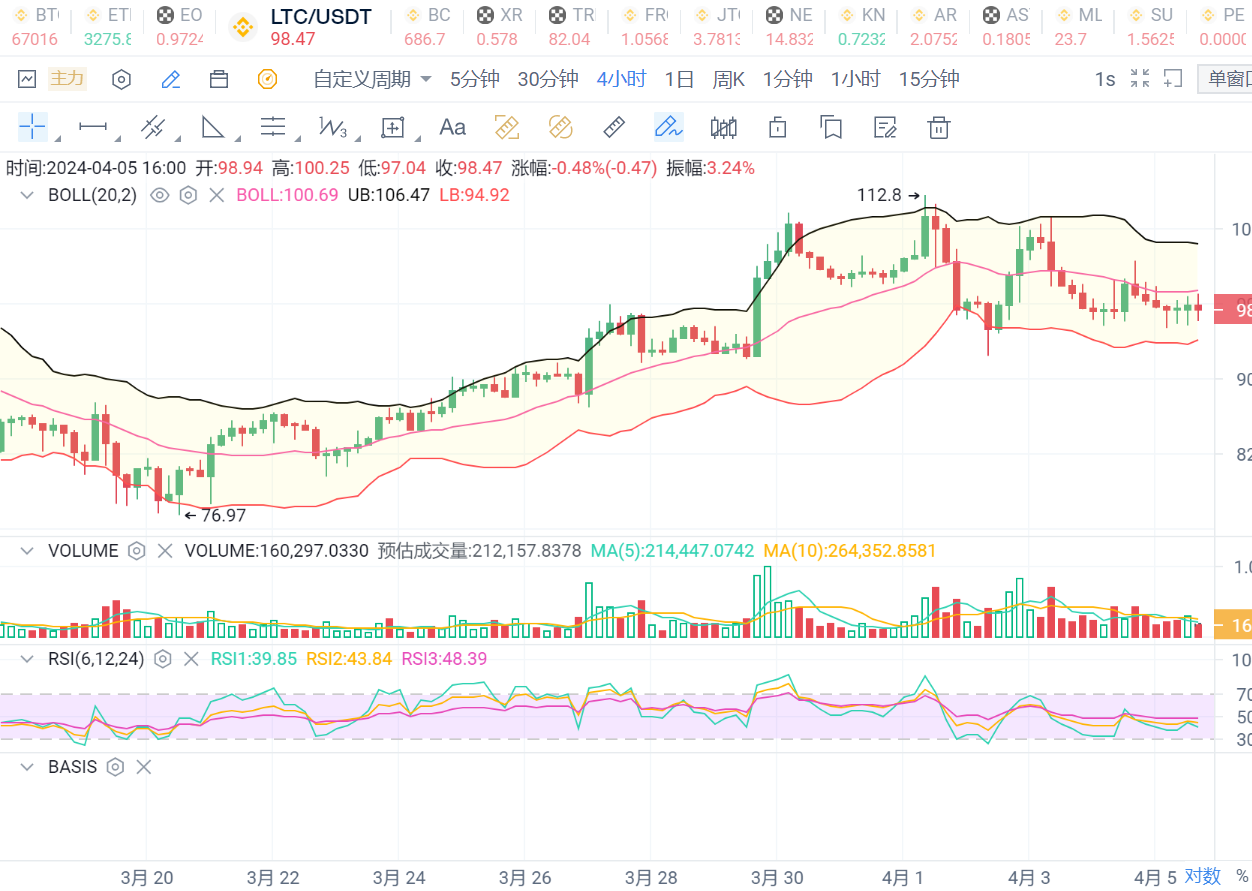
LTC: The price continues to fluctuate below the Bollinger Band's midline, showing a weak trend, with support at 96 and resistance at 100.
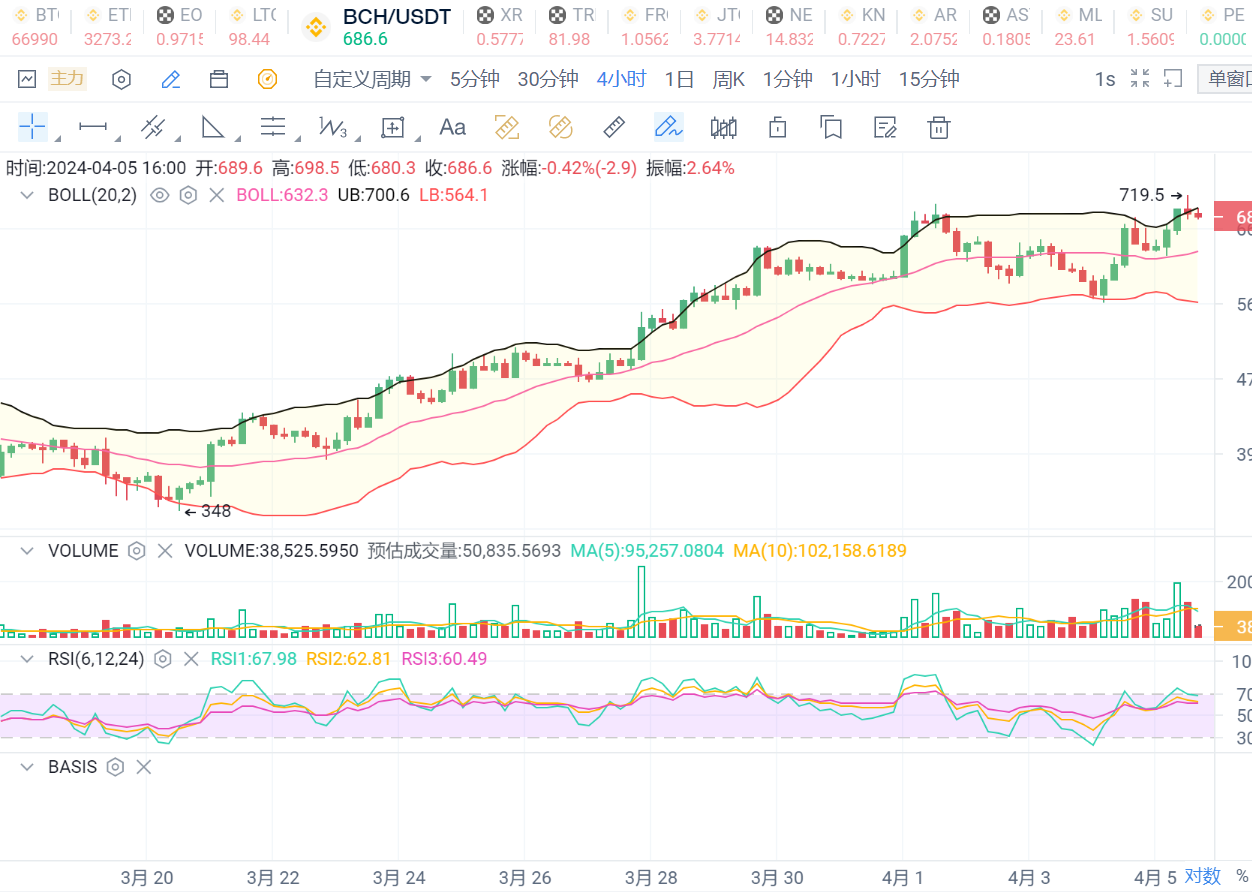
BCH: The price continues to hover near the upper Bollinger Band, indicating a strong trend, with support at 670 and resistance at 700.

免责声明:本文章仅代表作者个人观点,不代表本平台的立场和观点。本文章仅供信息分享,不构成对任何人的任何投资建议。用户与作者之间的任何争议,与本平台无关。如网页中刊载的文章或图片涉及侵权,请提供相关的权利证明和身份证明发送邮件到support@aicoin.com,本平台相关工作人员将会进行核查。


