Daily Sharing
Bitcoin is still oscillating within a range today, and it has oscillated about 9 times so far. There is a chance that it will break out of the upward trend this weekend. From the current market situation, it is still in a high-level oscillation stage. The oscillation here is most likely within the range of the daily line's top, which does not necessarily mean that the daily line's rise has peaked, but rather it is similar to the construction of a phased top area. It is not easy to fall too much during this stage, and it may even frequently establish new highs.
It is still not recommended to be overly bearish at the moment, especially for altcoins. If the oscillation and washing of altcoins are almost over, there is a high possibility of another rise, similar to the current situation. It is best to wait for the completion of the daily line's rise structure before being bearish.
BTC Medium and Long Term
Weekly Chart:
At the weekly level, the ongoing rise from 15476 has completely reversed. If in 2022 and 2023, we thought that the weekly rise might not surpass 69000 and would need to go through another weekly-level decline, it has now once again reached a new all-time high. There is no reason to be bearish on the market unless the weekly rise is about to end.
However, based on the current market structure, the end of the weekly rise still seems quite distant. For the weekly rise to end, Bitcoin needs to go through at least one more daily-level decline and rise. However, the current daily-level decline is still not visible, so the long-term outlook is bullish.
Daily Chart:
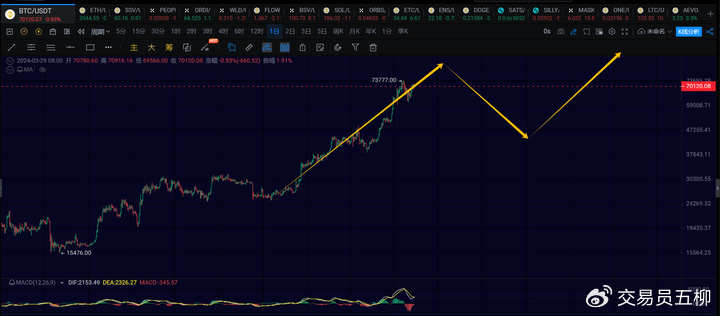
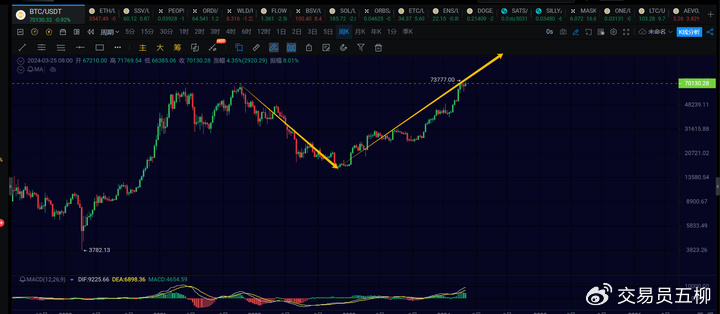
At the daily level, it is still in the process of the rise from 24900, which has not ended yet. The expected position is around 76000 or 80000. When it is expected to end, the daily MACD may show a divergence once or twice. Currently, the divergence has not formed, so patience is required.
After this rise at the daily level is completed, there will be a subsequent decline at the daily level, which will correct the indicators since the rise from 24900 and clear the floating profit chips from the 30000 mark. After the correction at the daily level, it will continue to rise in a new daily-level rise, indicated by the third yellow arrow on the chart. At that time, there is a chance to reach around 100,000 or even higher.
4H Chart:
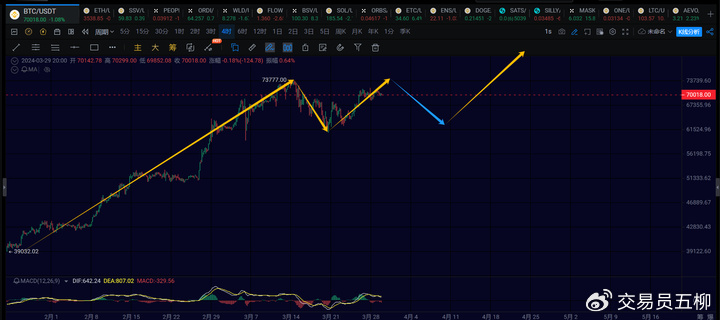
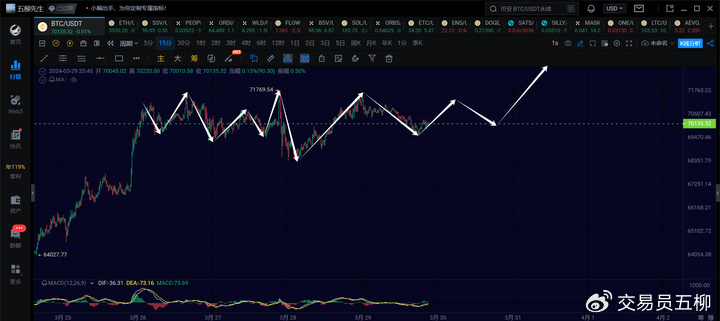
Last Friday, it was mentioned that there were probably two possible structures at the 4-hour level. The first is to oscillate around the 61000-79000 range repeatedly, forming a 4-hour-level center, and then make another surge to end the daily-level rise. The second is for Bitcoin to directly undergo a daily-level pullback after a rebound at the 4-hour level. Currently, the first possibility is more likely, with Bitcoin overall oscillating around the 61000-79000 range to form a 4-hour-level center, and then make another surge before starting a daily-level decline.
Based on the current structure, the rise from 60775 at the 4-hour level may not have ended yet, with a chance to continue to 73777. After this surge, there is a high probability of a 4-hour-level pullback, indicated by the blue arrow on the chart. As long as it does not fall below 58000, there is a high probability of another rise, indicated by the yellow arrow, towards 80000.
BTC Short Term
Due to the rapid changes in the market, this article can only make predictions based on the market situation at the time of publication. Short-term players should pay attention to the latest market changes and use this information as a reference only.
1H Chart:
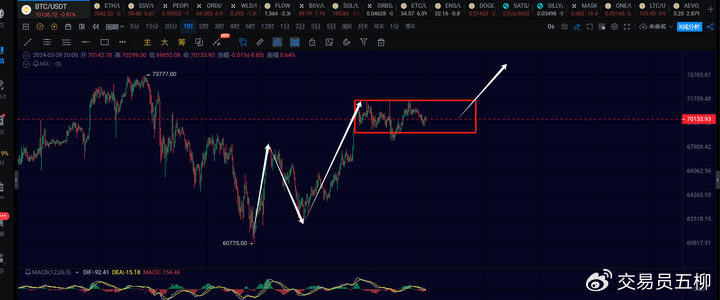
At the 1-hour level, Bitcoin is currently oscillating within the red box area on the chart. After upgrading to a 1-hour-level center, it is very likely that it will need to make another surge at the 1-hour level to end the 4-hour-level rebound.
The 1-hour-level center has already oscillated about 9 times, so it is possible to start a 1-hour-level rebound directly, or it may oscillate about 11 times before making another surge.
As long as the price remains above 68000 in the short term, Bitcoin is likely to continue testing the previous high of 73777. If it falls below 68000, it may indicate a 4-hour-level pullback.
15M Chart:
At the 15-minute level, it has already oscillated about 9 times, and it is about to start a new 1-hour-level rise. If it becomes more complex, it may oscillate about 11 times, and then make another surge. As long as it stays above 68000, it is better to remain bullish.
It is currently likely to be in the process of a 15-minute-level rebound, and the focus is on whether it can break through 71555.
ETH
Weekly Chart:
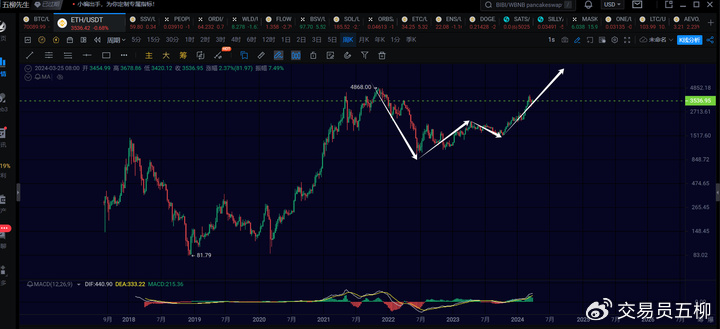
At the weekly level, Ethereum has been consolidating in the 1500-2030 range, forming a weekly-level center. Currently, this weekly-level rise has only completed the first daily-level rise internally, and there will be a subsequent daily-level pullback and rise. Therefore, breaking the historical high of 4868 at the weekly level is almost a certainty.
From the structure of Ethereum at the weekly level, altcoins have a close relationship with Ethereum, so the overall cryptocurrency market has only just begun. The opportunity to make a fortune this year is still ahead.
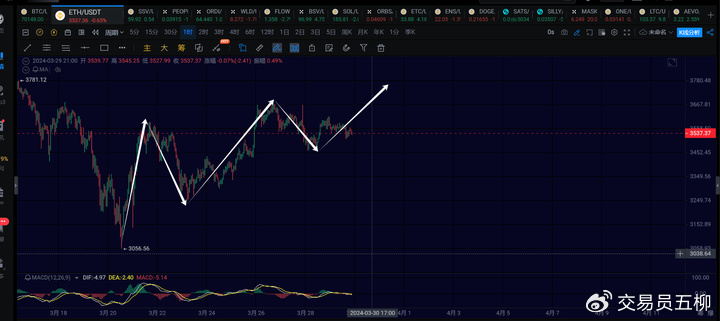
At the 1-hour level, it is currently being observed whether it can successfully make a rebound to around 3700. Short-term support is around 3500, and the upper resistance is at 3610.
Mask:
Recently, the member group has repeatedly suggested buying mask in the 4-5 range. It has now once again broken through the upper resistance position, with the next target around 13.
Trend Direction
Weekly Level: Upward, currently continuing the rebound from 15476, and the end time will depend on the subsequent daily line situation.
Daily Level: Upward, the target for the daily rise is adjusted to around 76000 or 80000.
4-hour Level: Upward, currently running a 4-hour-level rise, with a chance to make a new high.
1-hour Level: Consolidating, if it can break through 71555 in the short term, there is a chance to continue to surge towards 73777.
15-minute Level: Upward, focus on the current strength of the 15-minute-level rise.
Feel free to follow my public account for discussions and exchanges:

The article is time-sensitive, so be aware of the risks. The above is only personal advice and is for reference only!
免责声明:本文章仅代表作者个人观点,不代表本平台的立场和观点。本文章仅供信息分享,不构成对任何人的任何投资建议。用户与作者之间的任何争议,与本平台无关。如网页中刊载的文章或图片涉及侵权,请提供相关的权利证明和身份证明发送邮件到support@aicoin.com,本平台相关工作人员将会进行核查。


