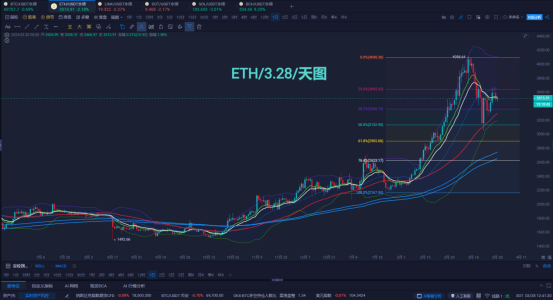
3/28/天下社区:ETH遇阻回落还是吸筹蓄力?
课程主题:多币种某周期机会在维加斯隧道!
直播间分享各类主流技术指标运用方法,以及当日技术形态解析;


【ETH/天图】
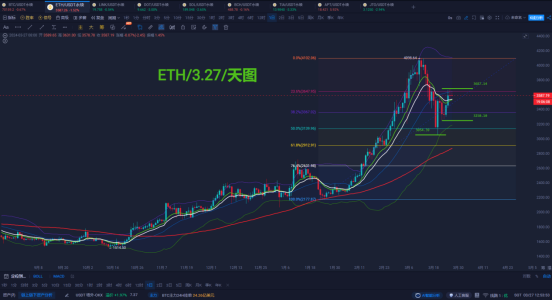
ETH/天图技术走势分析:以太坊周三行情表现价格受阻布林通道中轨以及3700
压制作用出现回落走势近三天的日线形成一组看空黄昏星组合形态;价格波动区
间开始有缩小迹象至于该组看空的黄昏之星组合能否带来更深的回落行情还需要
继续观察日内走势的多空表现;由3050止跌反弹以来或许昨日低点3450价格区有
机会成为第三个抬高的低点;看多后势的观点持续保持不变;有效突破3700将上
行至3800-3950一带
【ETH/4H图】
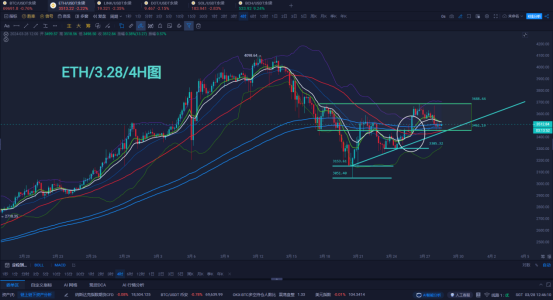
ETH/4H技术走势分析:4小时价格走势3688遇阻回落短期跌破3500最低探至
3460-3450;价格正好测试到三均线金叉状态中的50MA与维加斯隧道有止跌
表现;3050上来的趋势线支撑作用也依然保持有效;欧盘时段价格维持在3450
之上看多至3700-3800-3850;如若4小时周期有效跌破多重支撑下行测试第一
目标将是3300;
今日观点跟踪:日线收看空组合形态;但有低点抬高表现4小时级别的多头趋
势线.维加斯隧道.三均线.依然指向多头;昨晚间的空头回落随意跌破3500但
不属于坚决有效;欧盘时段价格企稳于3500上方那么当前的整理区有很大的
机会成为下一波多头的起涨点;如果有因当时跌破3500离场多头或者减仓部
份的可以继续开新的多单进场当前报价在3520;止损趋势线之下3380多头第
一目标3700第二目标3800-3850;
市场行情变化过大,禁言群会及时更新提醒!
更多细节欢迎进入直播间讨论学习交流!

推荐思路【回调支撑有效做多】
支撑3520-3500/阻力3680-3800
腾讯会议ID:565-877-8060
每日七场直播开启时间:14点-21点30分不间断

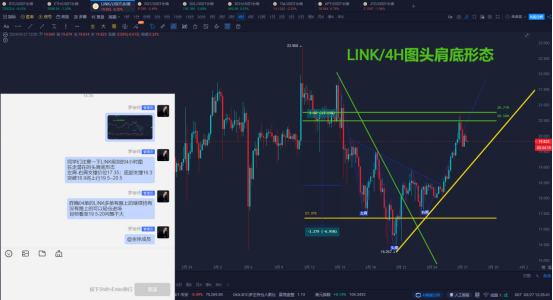
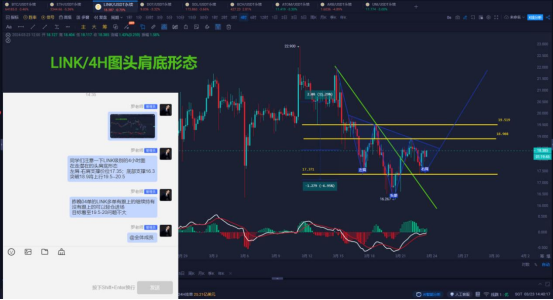
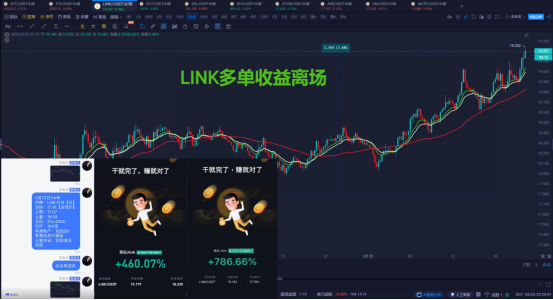
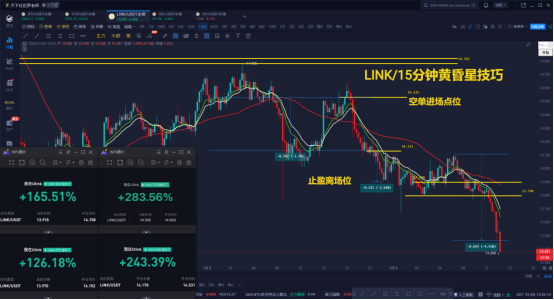
LINK/4H策略跟踪完结提示:3月22日-23日预期4小时头肩底形态以及第一.
二多头目标19.5-20以及完美到达最高价格触及20.765;有认真对待并且跟踪
执行的伙伴该策略收益应在600%-1000%;LINK的下一次多空机会我们将持
续跟踪!
【猎金舍】精英班你可以获取什么???
1.第一时间获取获取午间视频//2.第一时间获取市场日内观点
3.第一时间获取短中长策略////4.全程跟踪指导策略始终
5.有机会参与专属午夜场战斗//6.有机会参加价值百万级课程
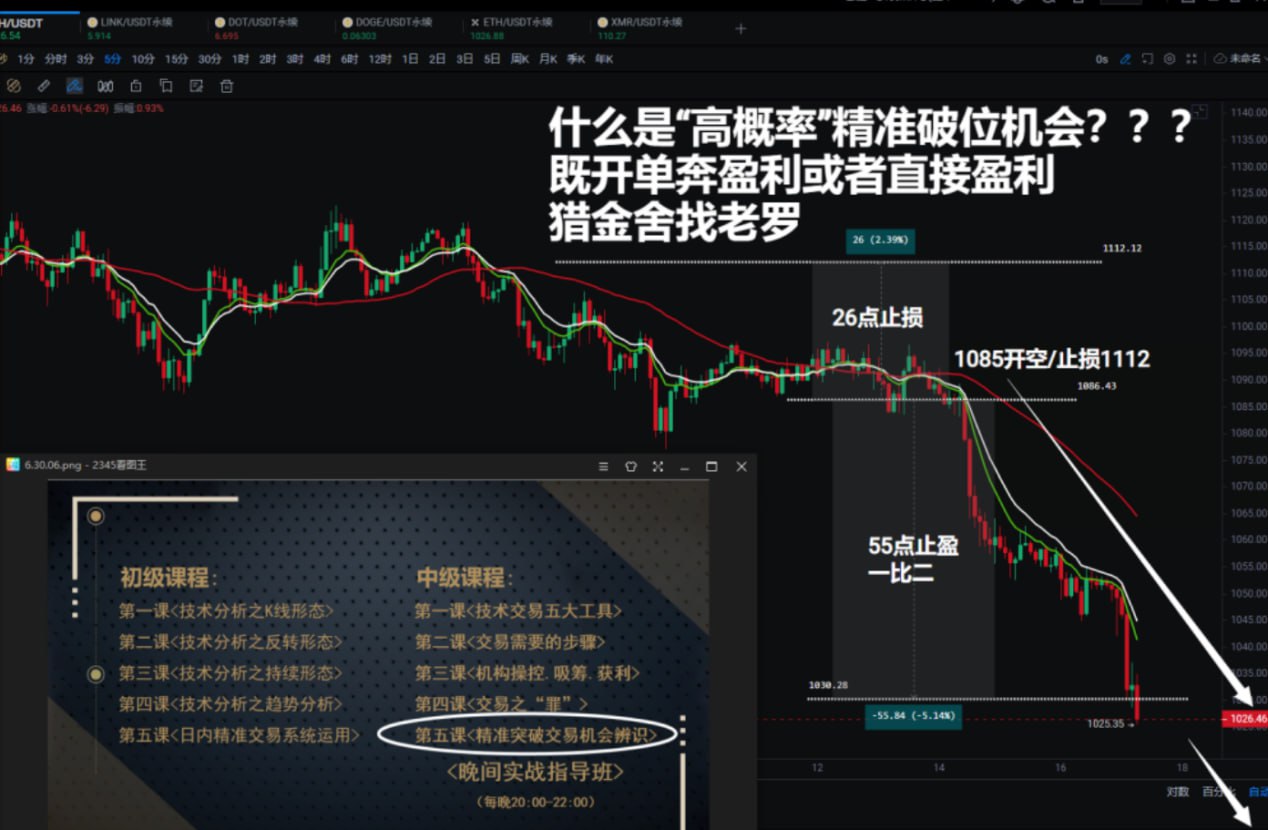
【高效.精准.破位交易机会捕捉】

2022年整年度策略指导记录
2022年2月-12月///10胜1负
02月份完整/收益率2500%///03月份完整/收益率2500%
04月份完整/收益率2626%///05月份完整/收益率3698%
06月份完整/收益率3081%///07月份完整/收益率7033%
08月份完整/收益率4694%///09月份完整/收益率5046%
10月份完整/收益率1438%///11月份完整/收益率2362%
12月份完整/收益率-474%///
2022年2-12月完整总计34504%
单笔保证金100U计*34504%=34504U
每笔策略//有依有据有迹.可追溯至起始时间至年月日/时.分秒图文留存/有兴趣的扫码进群考证 !!


免责声明:本文章仅代表作者个人观点,不代表本平台的立场和观点。本文章仅供信息分享,不构成对任何人的任何投资建议。用户与作者之间的任何争议,与本平台无关。如网页中刊载的文章或图片涉及侵权,请提供相关的权利证明和身份证明发送邮件到support@aicoin.com,本平台相关工作人员将会进行核查。


