
The London Stock Exchange will start accepting applications for the listing of Bitcoin and Ethereum Exchange Traded Notes (ETNs) from April 8, 2024, subject to the approval of the prospectus by the Financial Conduct Authority (FCA) in the UK. The planned first trading date for the London Stock Exchange is May 28, 2024. In response to this news, the market quickly surged to 71150. Many bearish individuals have started calling it a bull market again, and many friends are asking whether the bull market is over and whether we will see 80,000 to 100,000 in the second half of the year.
My answer: The bull market has not turned bearish, but the risk continues to increase. This is an institutional bull market, not a retail bull market. It is becoming increasingly difficult for retail investors to make money.
Reason one: Although Bitcoin has experienced three halvings in 2012, 2016, and 2020, with the latter two being related to Bitcoin ETFs, the Chicago Mercantile Exchange (CME) in the United States launched Bitcoin futures in 2017. In October 2021, the SEC approved the listing of a futures ETF, which was the first Bitcoin futures ETF in the United States. On January 11, 2024, 11 Bitcoin spot ETFs were approved for the first time, pushing Bitcoin to a new high. The entry of the regular army should not be underestimated.
Reason two: The technical aspect is about to close on the monthly chart, with the monthly chart showing support at the upper BOLL track. The candlesticks are currently still above the high points of 2020 and 2021, which is not a sign of weakness. The price line is also temporarily above 69,000, and the Fibonacci retracement line has broken through 100%. The next two high points are at 1.382 (89,255) and 1.618 (101,769), which are long-term targets.
Regarding the pullback: After the previous surge to 73,777, the subsequent pullback did not break below 0.786, indicating a weak pullback. Therefore, we consider this area as the first bottom fishing zone at 59,000 to 60,000, and the second bottom fishing zone at 50,000 to 52,000 (one of the plans is to enter at the extreme points before and after the halving). Previously, we thought that Bitcoin would oscillate in a triangle pattern before breaking through or forming a round arc pattern to reach a new high. Currently, it seems that this possibility may occur on the daily chart first, and then we will observe the time and space.
It is also important to note that early holders of positions in Bitcoin have taken profits after the rebound to 70,000, which may also be a way to avoid the risk of volatility before and after the halving.
Bitcoin:
The daily chart has returned to the upper BOLL track, with the BOLL narrowing and moving flat. The OBV indicator has rebounded and touched the yellow line, and it must stabilize to prove that continuous funds are flowing in, with a volume contraction rise back to 68,600.
On the 4-hour chart, we have used all the patterns that should be used. The downtrend channel has been broken, and both the head and shoulders bottom pattern and the round bottom pattern are bullish patterns. In fact, it is enough to just look for a breakthrough of the 4-hour downtrend line, there is no need to make it so complicated. Currently, it has reached the previous high M head neckline pressure zone, and we need to see if it can break through to see a new high. If it cannot break through, it will continue the triangle oscillation at the daily chart level after the halving (note the large volatility before and after the halving, pay attention to the risk).
Support:
Resistance: 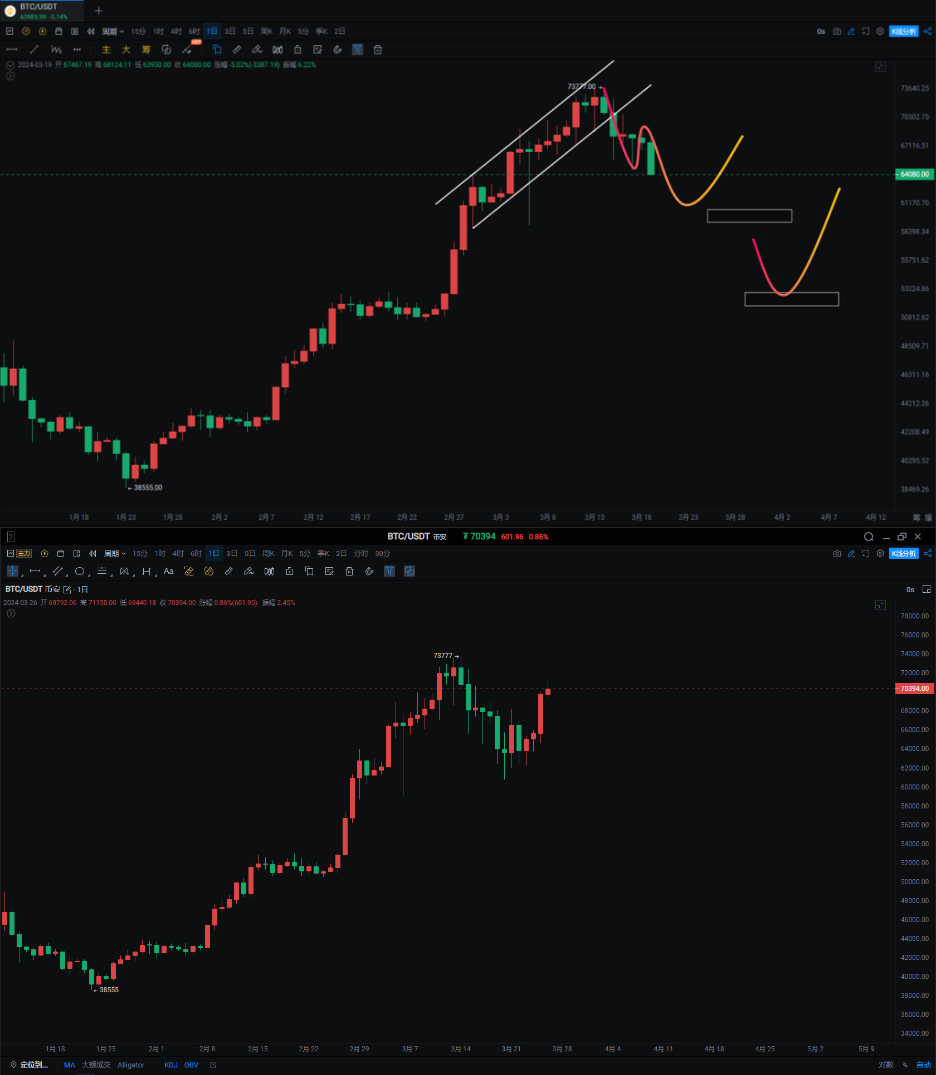
Ethereum:
Ethereum's rebound is weaker than Bitcoin's for the time being, being pressured by the middle BOLL track. Bitcoin has already regained the V-shaped high point of March 6, but Ethereum has not yet. On the 4-hour chart, breaking through the W neckline and continuing to look for resistance above 3700 to 3900.

The ETH/BTC exchange rate has returned to the bottom of the daily box, and we are expecting Ethereum to lead the altcoins in a rebound.
If you like my views, please like, comment, and share. Let's go through the bull and bear markets together!!!
The article is time-sensitive and is for reference only, with real-time updates.
Focus on candlestick technical research, win-win global investment opportunities. WeChat public account: 交易公子扶苏
免责声明:本文章仅代表作者个人观点,不代表本平台的立场和观点。本文章仅供信息分享,不构成对任何人的任何投资建议。用户与作者之间的任何争议,与本平台无关。如网页中刊载的文章或图片涉及侵权,请提供相关的权利证明和身份证明发送邮件到support@aicoin.com,本平台相关工作人员将会进行核查。


