Click to watch the video: Master Chen's 3.25 Video: Will KD Index 80 Continue to Go Long? Where is the Key Level of the Market? Will DOGE Reach 0.2?
Recently, the Bitcoin market has been rising for a few days and then falling back, or falling for a few days and then rising again. Today, let's discuss why the recent short-term market has been fluctuating like this, and what we need to pay attention to on the weekly chart, including how to judge some of the short-term pressures and supports of Bitcoin.
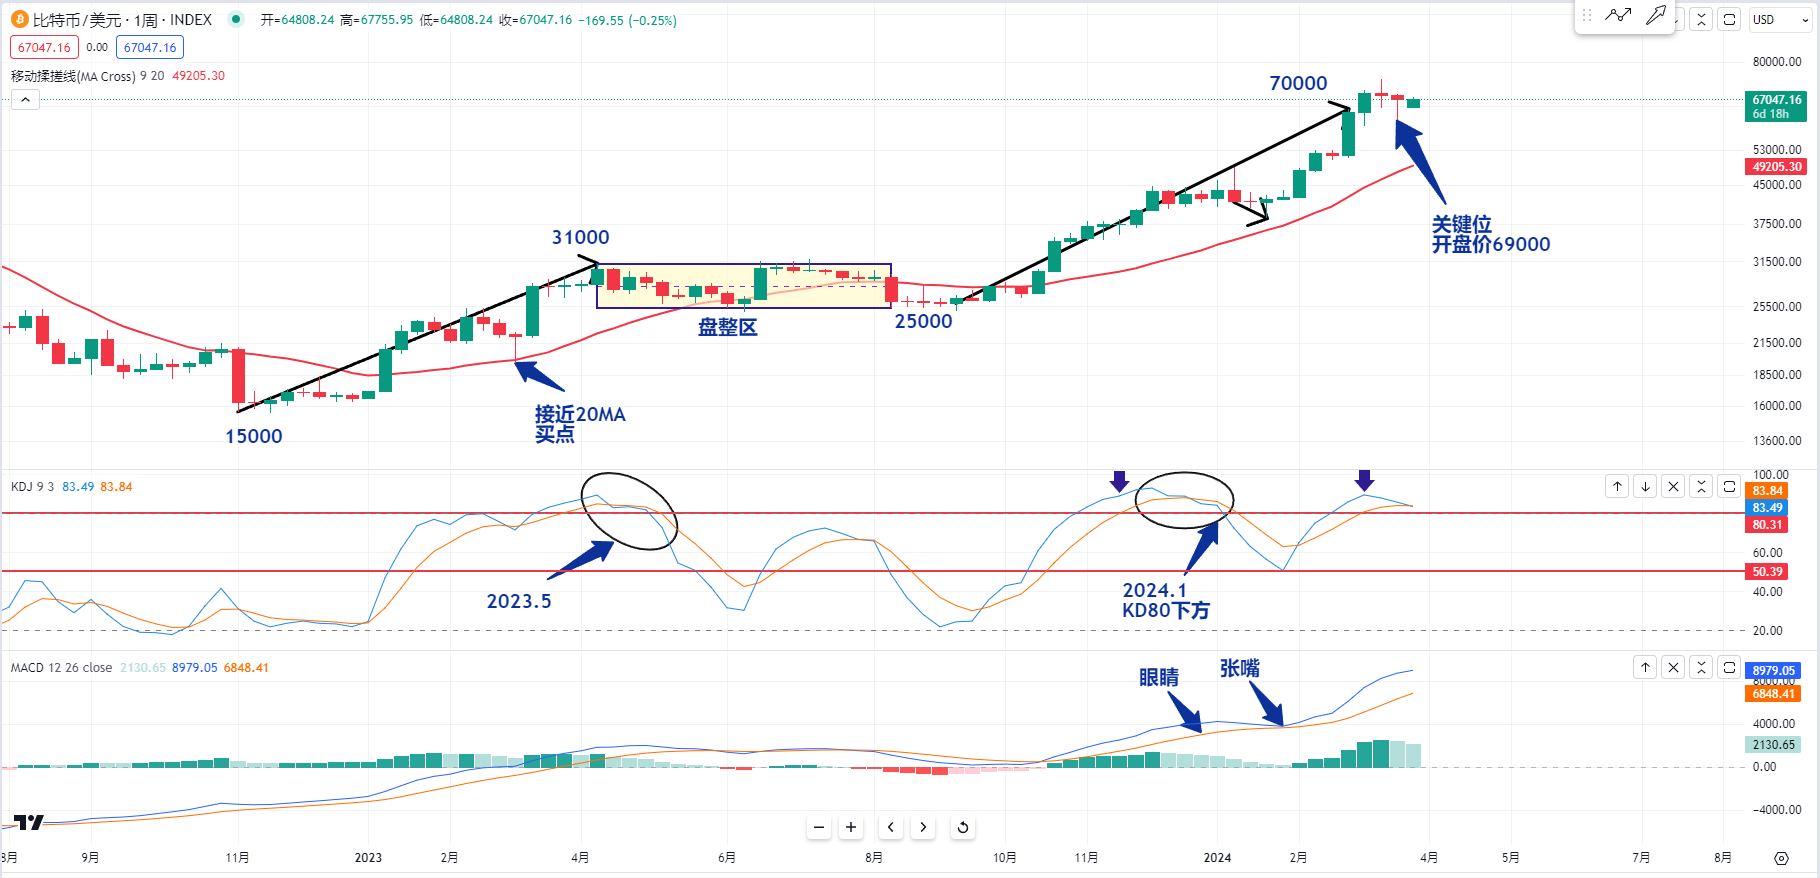
First, let's take a look at the weekly chart. We can observe that Bitcoin has risen from a low point of 25,000 to around 70,000, and from a low point of 15,000 to around 31,000. At the current position, I think it may consolidate in the range similar to last year's position. If you want to operate in the medium term, you should try to observe and go long at the low point of the pullback, as it may rise.
You should not chase the short-term high points, as there may be lower points of decline. Will the current position still be in a consolidation range? We can observe the KD index. Currently, it is in a strong dulling area above 80, but we need to pay attention to it in the next two weeks.
Because Bitcoin has not had a significant rise in the past two weeks, if the current position is in a consolidation structure, we need to pay attention to the KD index on the weekly chart not dropping below 80. If it drops below 80, we need to be cautious, just like in January 2024 when the KD index dropped below 80 at that time.
We need to pay attention to whether there are lower points of decline or if the price is close to the 20MA on the weekly chart, as it may be the next buying point. This time, the high point of the KD index should be lower than the previous high point. However, according to past experience, if the KD index is in a strong dulling area above 80, we can ignore this divergence.
So, what we need to pay attention to is that the KD index should not drop below 80, because the last time in January, the KD index dropped below 80 at this position, and being close to the 20MA position is also a very important buying point. Or we can observe that around May 2023, Bitcoin also consolidated in this position, and later the KD index dropped below 80, which may lead to a medium-term adjustment.
Or we can also observe that being close to the 20MA position in 2024, when the KD index broke below 80, we need to pay attention to this position if it is close to 50, which is close to the position of the long-short balance area, to see if there is a medium-term buying point.
Or we can observe that in January 2024, when the KD index broke below 80, being around 50 may be a relatively important buying point. Then, let's observe the consolidation candlesticks of Bitcoin in the past two weeks. The lower shadow is also very long, indicating that there may be a significant divergence between long and short positions at this position.
Or we can observe the technical aspects, including the MACD index below. If it is in a position of a wave, and it starts to form a duck's mouth, which is the position where the duck's head's eyes and mouth open, according to past experience, the limit of this column is around 10. We need to be careful, especially when it is close to the middle, around 5 to 6 columns.
If 5 to 6 columns start to appear at the high point, we need to be careful whether the current position of the column will start to decline. So, if it rises, a crucial point is the opening price of this candlestick, which is around 69,000. We need to pay attention to whether the weekly level will continue to rise.
Because the KD has not dropped below 80 at the moment, but it is not ruled out that if it continues to be in a strong dulling area, the closing price of this candlestick must be above 69,000. The same goes for the daily level.
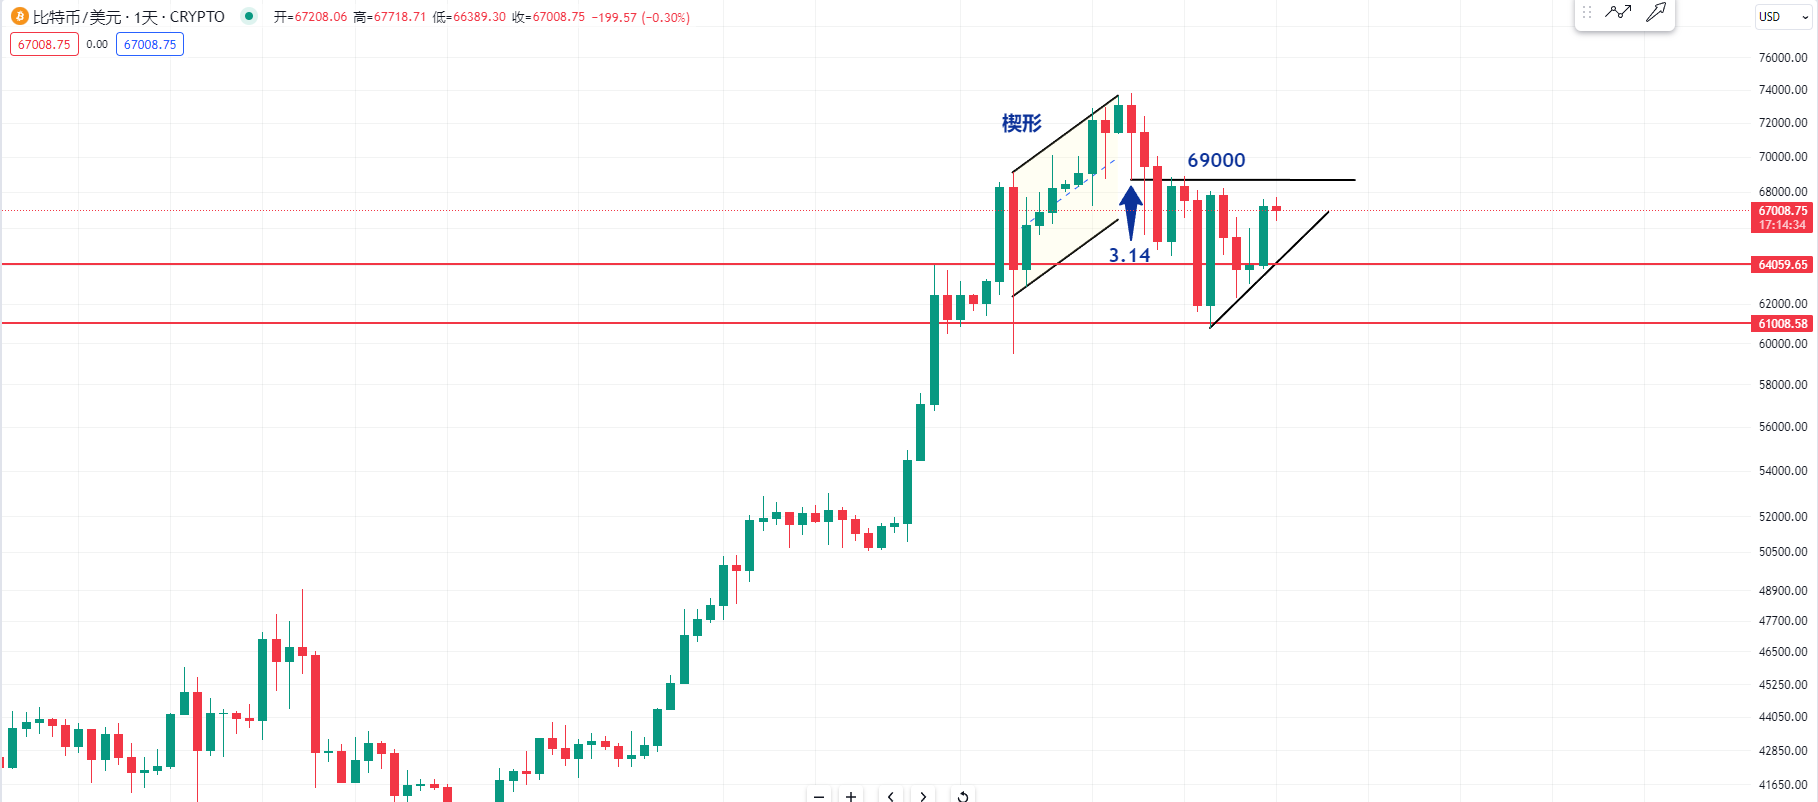
Let's take a look at the Bitcoin daily level. Why is 69,000 a crucial position? The black trend line above is also a resistance at 69,000, which is the low point of the lower shadow of the candlestick in March. And I have also mentioned before that this position forms a wedge shape. The position where the trend breaks is also around 69,000.
If the market continues to maintain its strength, the price must break through 69,000 as soon as possible. The recent low points of the decline have also formed a short-term support. For short-term support, everyone can also pay attention to around 64,000, and for the overall medium-term support, it is around 61,000. The medium-term level is consolidating in the range of 69,000 to 61,000.
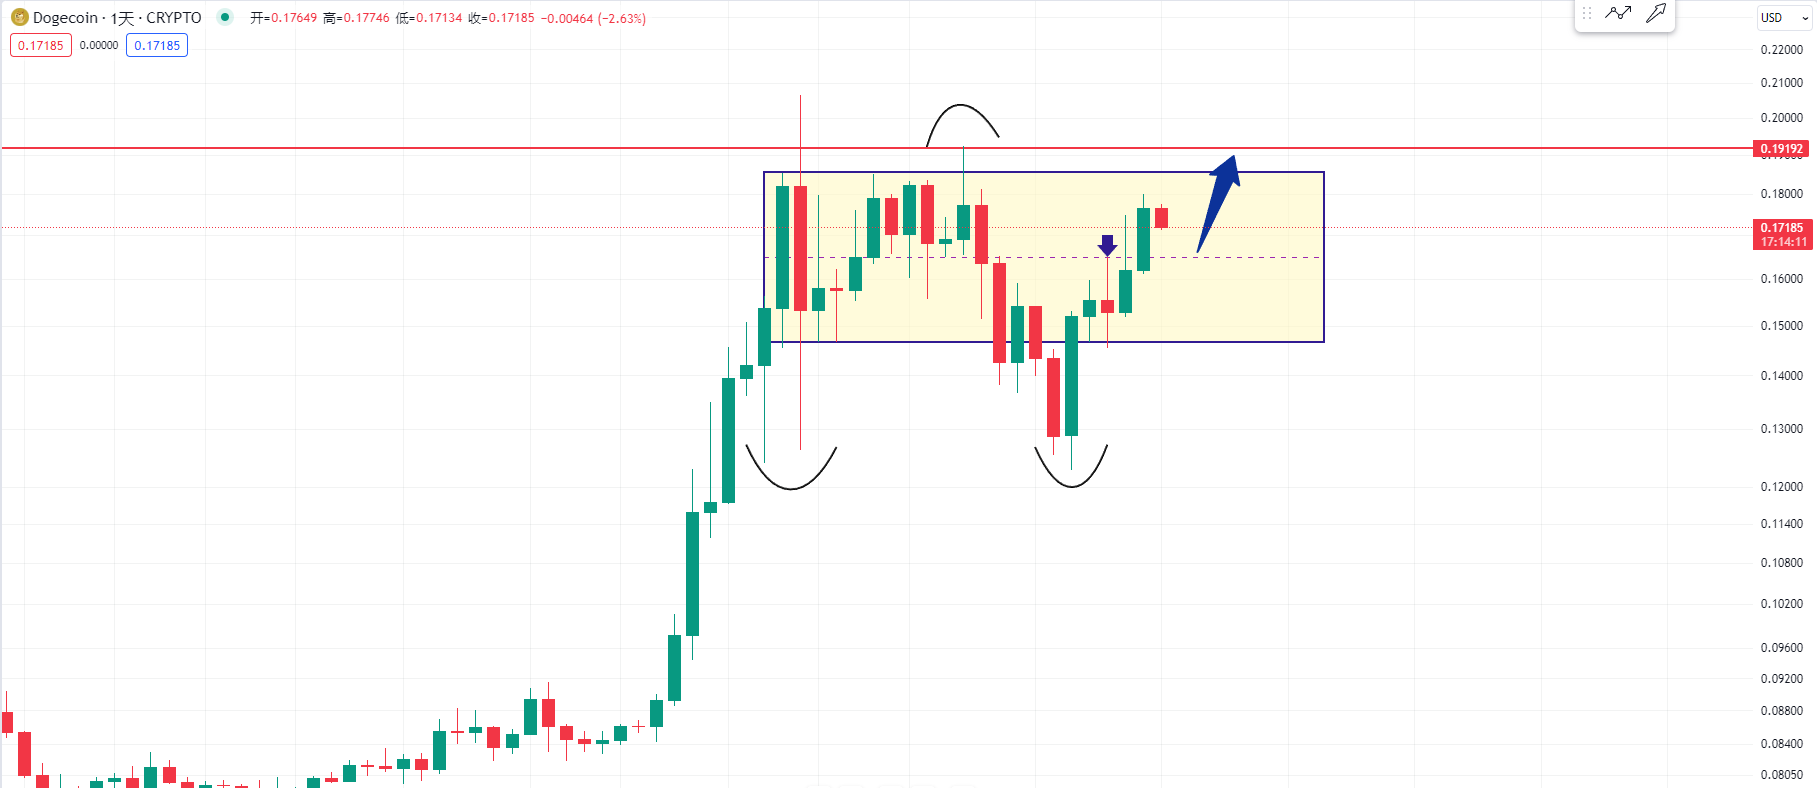
Finally, let's take a look at the daily chart of Dogecoin. Yesterday's candlestick has already broken through half of the pressure of this range. We should try to observe whether it will continue to stay in the upper half of the range at this position. Currently, it has returned to this strong area. Personally, I believe that Dogecoin has a good chance to continue challenging the position of 0.2 in the later period.
For more strategies, you can add real trading accounts.
Candlesticks are king, trends are emperor. I am Master Chen, focusing on BTC and ETH spot contracts for many years. There is no 100% method, only 100% following the trend. I update macro analysis articles and technical analysis review videos daily across the entire network! Image Friendly reminder: Only the public account of the column (as shown in the picture above) is written by Master Chen. The advertisements at the end of the article and in the comments are not related to the author. Please discern carefully. Thank you for reading.
免责声明:本文章仅代表作者个人观点,不代表本平台的立场和观点。本文章仅供信息分享,不构成对任何人的任何投资建议。用户与作者之间的任何争议,与本平台无关。如网页中刊载的文章或图片涉及侵权,请提供相关的权利证明和身份证明发送邮件到support@aicoin.com,本平台相关工作人员将会进行核查。


