Click to watch the video: Master Chen's 3.22 Video: Is the Season of Altcoins Coming? Will DOGE and the Market Continue to Fall?
So in the past few days, Bitcoin has been falling while Dogecoin has not. Does this prove that the rise of altcoins is coming, or will Bitcoin continue to fall? In today's video, we will discuss the knowledge within the charts of Dogecoin and Bitcoin.
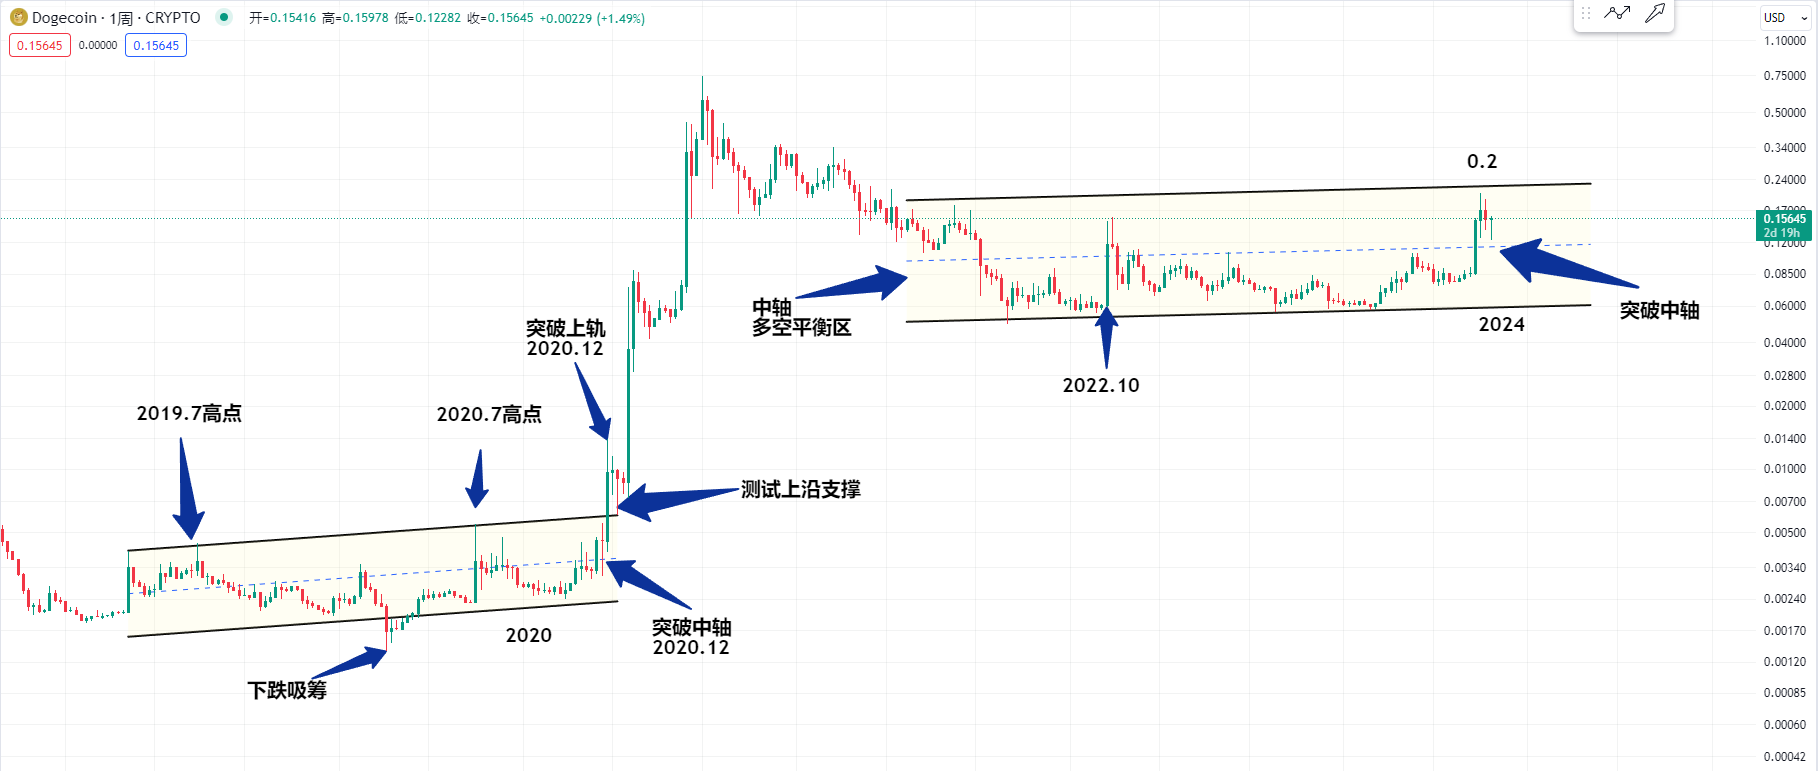
First, let's take a look at the weekly chart of Dogecoin. It is evident that the current weekly channel of Dogecoin is similar to the bottom channel in 2020. We can also observe a high point near 0.2 in October 2022.
It is possible that this time Dogecoin will rise to a high point near 0.2. The positions of these two high points, along with the high points in July 2019 and July 2020, and the positions of the lower points in the channels connecting the high points in 2020 and 2019, are clearly observable.
From 2022 to 2023, there is also a channel's midpoint, which is a balanced area for long and short positions. Several high points have consistently encountered resistance at the midpoint of the channel. The positions of the channel's midpoint and the lower points are clearly observable, including the fact that major players have been continuously falling to absorb chips at the midpoint of the channel. Occasionally, it may fall below the lower boundary of the channel or create a pit at this position. The same applies to 2022 and 2023, where people have been continuously falling to buy chips at the lower boundary of the channel. Occasionally, it may fall below this lower boundary, but ultimately the price will rise. After the rise, there will still be fluctuations, and currently, it has broken through the pressure of this midpoint, turning it into support.
We can see that after breaking through the midpoint of the channel in 2020, it became a support area. We can observe the candlestick that broke through the midpoint in 2020. I have mentioned before that during a bull market or the season of altcoins, we should be cautious because the decline during a sharp rise can be very intense. It may rise by 100% and then fall by 80% to 100%, just like the candlestick in December 2020, where the lower shadow of the candlestick broke through the entire previous rising candlestick.
Or when Dogecoin broke through the rising channel at this position, we should pay attention to the upper boundary position, which is around December 2020. You should remember this time. The season of altcoins started around December 2020, or we should pay attention to this. After the rise, the lower shadow of the subsequent candlestick basically eroded 80% of the previous rising candlestick, while also testing the support at the upper boundary of the channel. Therefore, some fans asked me yesterday when the season of altcoins would come. I feel that the current position is very similar to December 2020, so we should also consider the current retracement. To know when the season of altcoins will come, we need to pay attention to when Dogecoin will break through 0.2 again.

Next, let's take a look at the weekly chart of Bitcoin. I remember sharing this chart 7 months ago, and I have been advocating for buying at the bottom and going long. As long as you execute according to my strategy, holding for the long term without setting a profit target, only setting a stop-loss at the cost price for the profits made from doing the right thing. We can observe that during the downtrend in 2022, every time the trend broke through, there was a rebound, and a large drop of 20% could possibly be the low point. If you made the right moves at these positions, historically, the upward potential from the bottom would at least increase by more than 10 times.
We can also see that in 2019, at the bottom, going long from any position at the bottom, it increased by nearly 20 times to over 60,000. We can also observe that in 2019, as long as the trend line broke through, it was followed by a major bull market. As long as there is a decline, you can find opportunities to continue going long, or you can go long at the low points of black swan events, because the profit potential is very large.
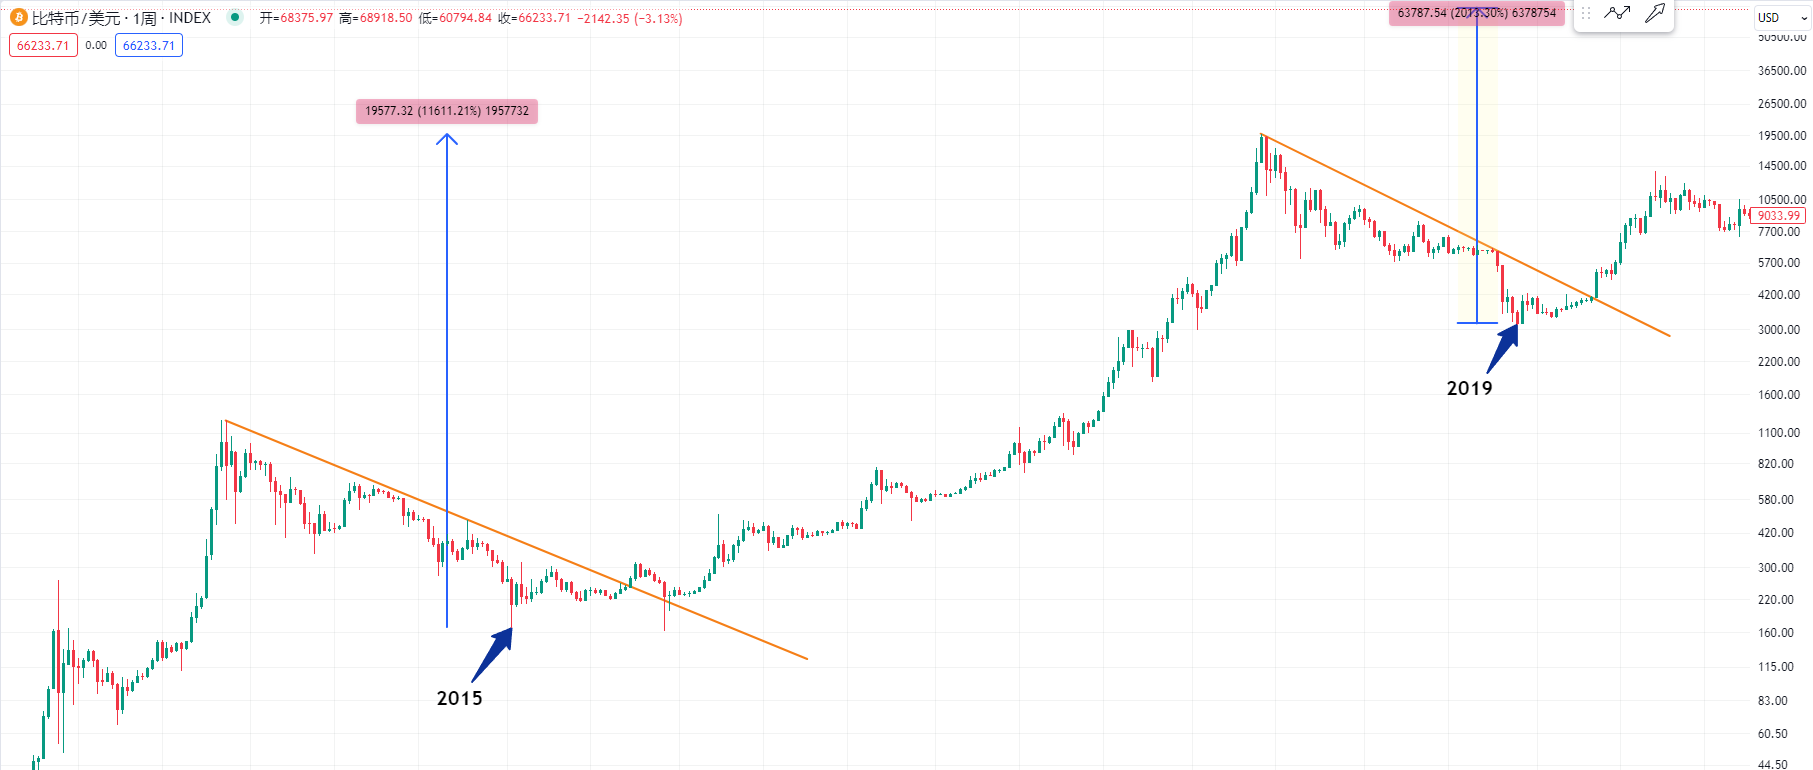
We can also observe that in 2015, as long as the downtrend line broke through after more than a year, the potential for increase was 100 times. So, my fans, you can follow my method. You can enter the spot and medium to long-term long positions at the low points of major declines, without setting a profit target. Wait until higher prices appear before considering setting a profit target. Currently, from 15,000 to nearly 70,000, it has increased by at most less than 4 times. In the short term, I am a little worried that Bitcoin will fall.
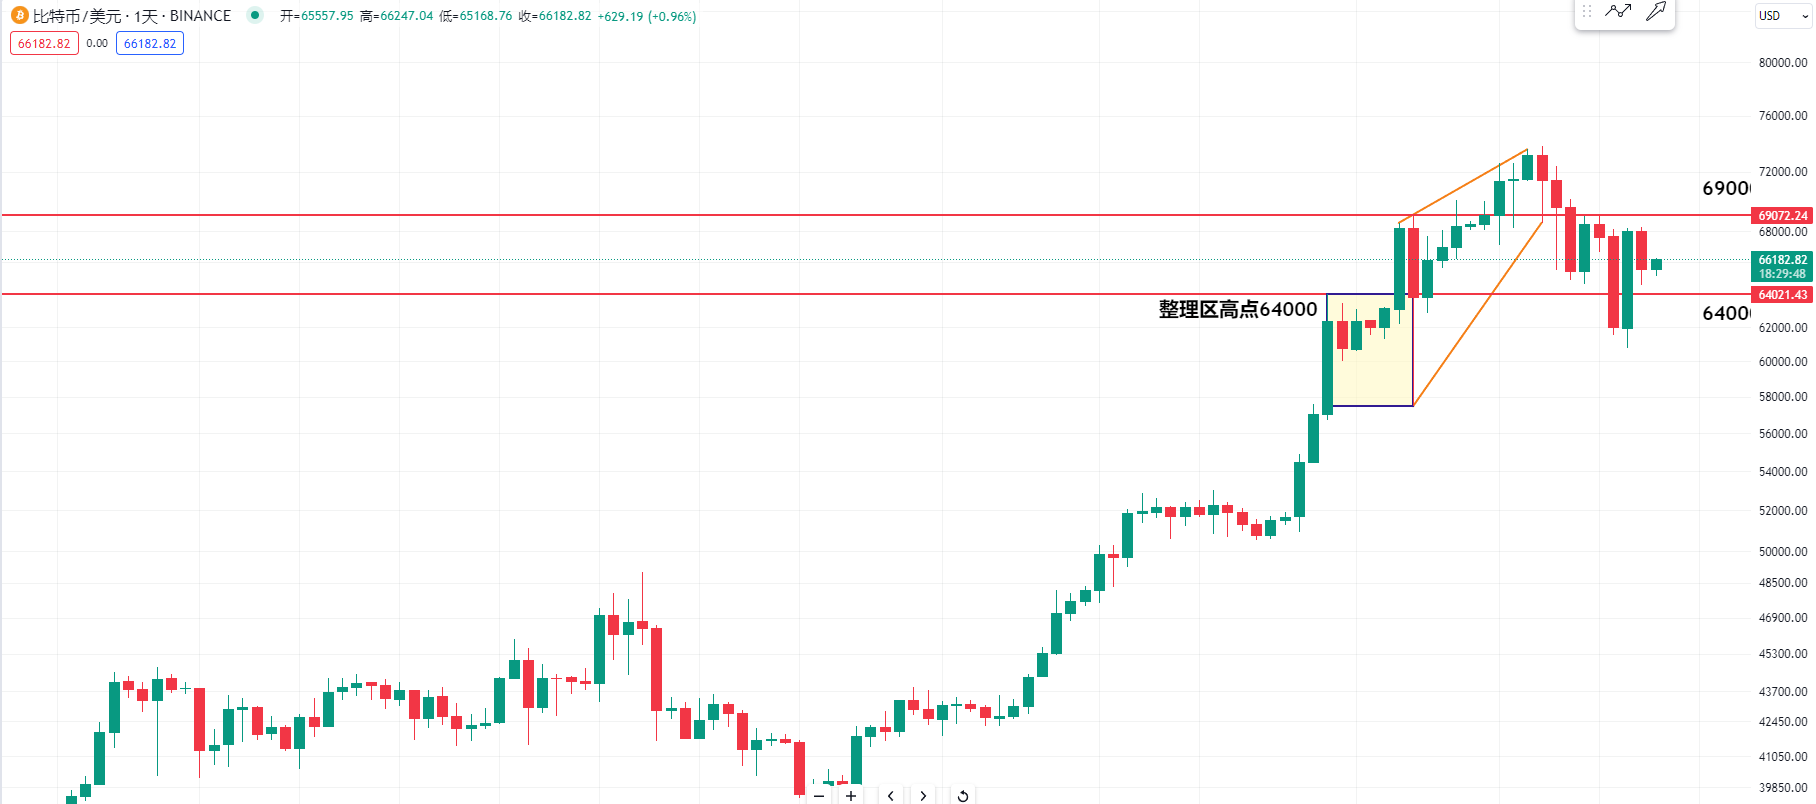
Now let's take a look at the daily chart of Bitcoin. I mentioned in the video yesterday that it may still consolidate at this position because 69,000 is a short-term resistance level, but it is not a long-term resistance level. We should try to maintain the strength of yesterday's downtrend candlestick, or not let it fall to 64,000. In the short term, the support at 64,000 should not be broken. It is also a high point in the previous consolidation area.
For more strategies, you can join the live trading.
Candlesticks are king, trends are emperor. I am Master Chen, focusing on BTC and ETH spot and contract trading for many years. There is no 100% method, only 100% following the trend. Daily macro analysis articles and technical analysis review videos are updated on the entire network. Friendly reminder: Only the public account of the column (shown in the image above) is written by Master Chen. The advertisements at the end of the article and in the comments section are not related to the author. Please be cautious in distinguishing between true and false. Thank you for reading.
免责声明:本文章仅代表作者个人观点,不代表本平台的立场和观点。本文章仅供信息分享,不构成对任何人的任何投资建议。用户与作者之间的任何争议,与本平台无关。如网页中刊载的文章或图片涉及侵权,请提供相关的权利证明和身份证明发送邮件到support@aicoin.com,本平台相关工作人员将会进行核查。