
First of all, we are not bearish, just reminding of the stage risks, overall still bullish. In the early stage of 23, we saw 35,000, and then saw 48,000, and reminded to bottom out and enter at 48,000 in January 24. Then, from 2/12, we reminded to continue holding or adding positions. Also reminded of the annual Spring Festival market. We did not short, just locked in profits in stages and waited for bigger opportunities. There are definitely analysis errors in the middle, with an overall accuracy rate of about 60-70%. For Ethereum, we were the earliest to see 3,000 reached and continued to see 3,500-4,000. As of the time of writing, the highest was 3,993, reaching 4,000, a difference of 7 points. When others are greedy, I am fearful, and when others are fearful, I am greedy.
This wave of Spring Festival market has continued to make it very difficult for short sellers and bears. Recently, I have seen many perpetual profit bloggers claiming that they have been reminding all the way to see a rise to 69,000 or even more, but in my analysis and research, I really haven't seen a few. Everyone is feeling their way across the river, taking it step by step. If you are not trapped or regularly investing, it is difficult to hold all the way, those who understand, understand.
Of course, do not completely believe and rely on any individual, including me. No one is a god. Make your own trading plan and stick to it. Make profits within your own cognitive range. Reject FOMO. The crazier the market, the calmer we should be.
Bitcoin
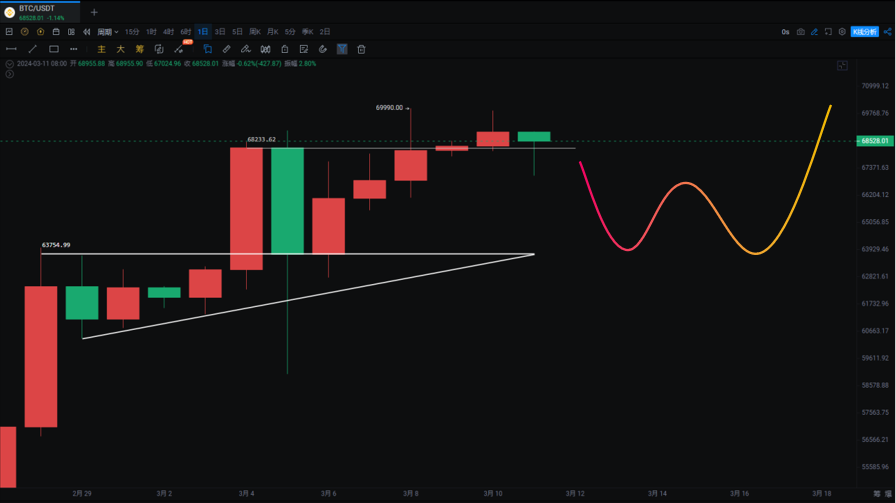
The weekly closing line has not shown a clear turning point for the time being, and the daily line has been trading sideways between 66,000 and 70,000 for a week. The key support at 68,233 is also the top of the pin bar on 3/05. If it falls below, we will see a fill of the CME gap at 63,400-64,000. There is a divergence in volume and price on the daily line, and a rising channel has been formed in the 4-hour chart, with another pin bar in the morning. Pay attention to the situation within the channel.
In theory, whether it's 69,000 or 70,000, the pressure has already gone up, it's just psychological pressure. Directly rushing to 80,000-100,000 is a normal trend, but this rapid rise of nearly 30,000 points in this wave of Spring Festival market has caught the vast majority of people off guard. The dog market has reached near historical highs to test the selling pressure. Prudent operation, pullback to 63,400-64,000 (may not happen in the short term), add positions in batches, or wait for a breakthrough of the high point of 70,000 before following up.
Many people will miss the opportunity to bottom fish in a bull market. One is that most people dare not catch a falling knife, and the other is that they always hope for a lower position.
Support:
Resistance:
Ethereum
The London upgrade is approaching, and Ethereum has shown signs of weak upward momentum, with the magnitude of the rise getting smaller and smaller. What needs attention is that the positive news may turn into negative news. The weekly rebound is blocked below the Fibonacci 0.786 (4015), and the daily line frequently tests 3,200-3,400. You can add positions in batches.
The 4-hour chart shows a box oscillation between 3,700 and 4,000, with a bearish divergence in the MACD, and a similar divergence in volume and price for both Bitcoin and Ethereum.
Support:
Resistance:
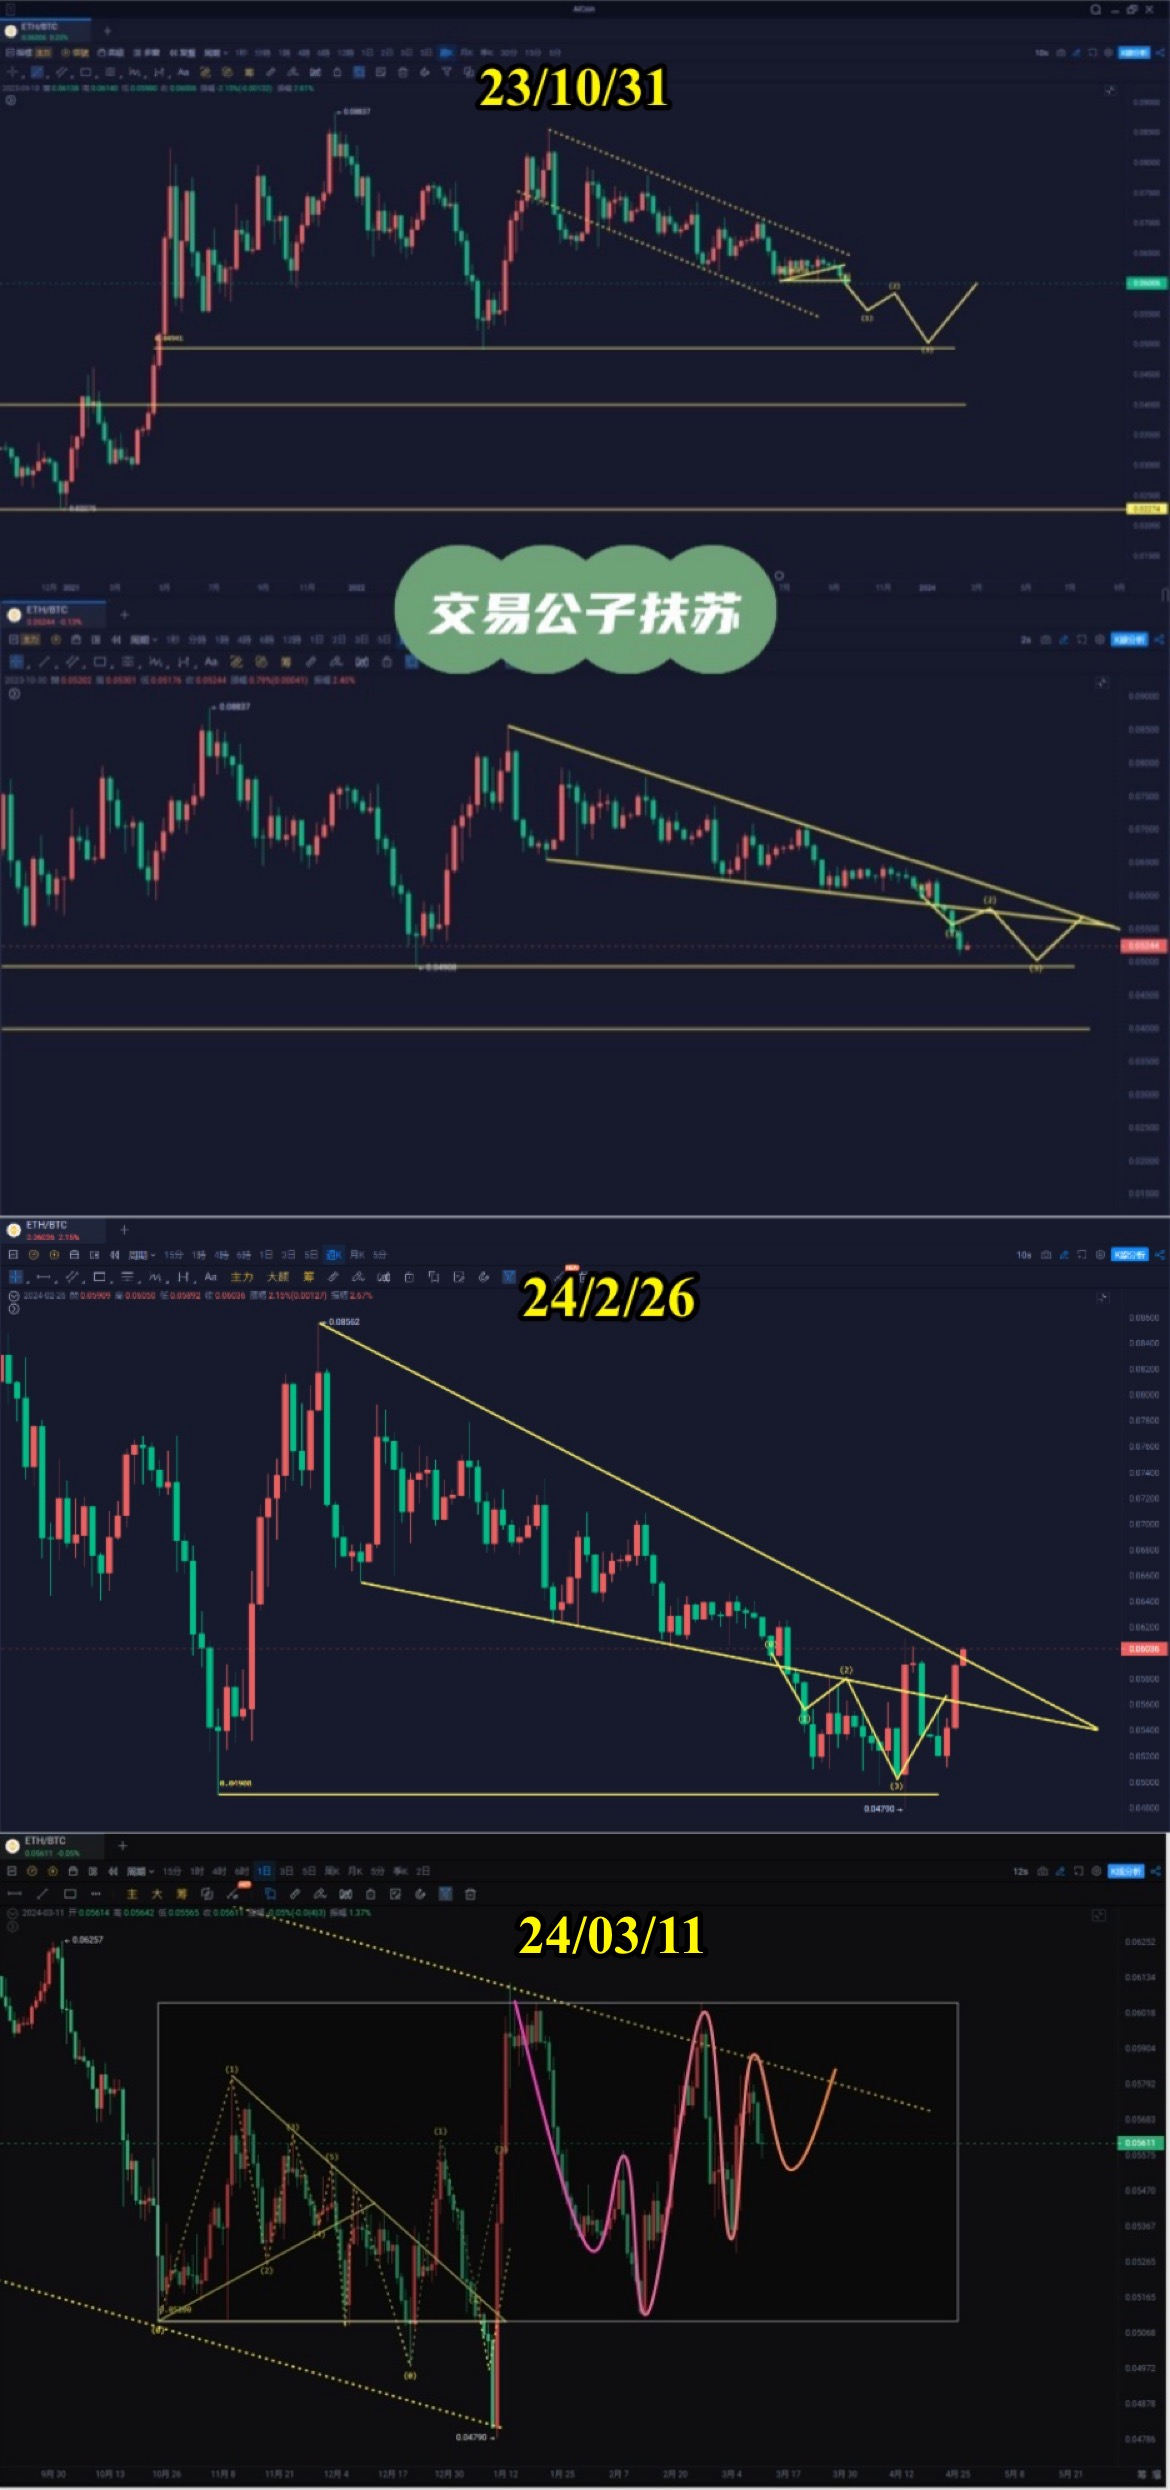
ETH/BTC exchange rate has been following our strategy and has an accuracy rate of 90%, as seen in the analysis in October 23. The weekly line has been diverging at the bottom for a long time, and the descending wedge will sooner or later see a breakthrough. At that time, it will be the time for Ethereum and other altcoins to party. The daily line is still oscillating in a box.
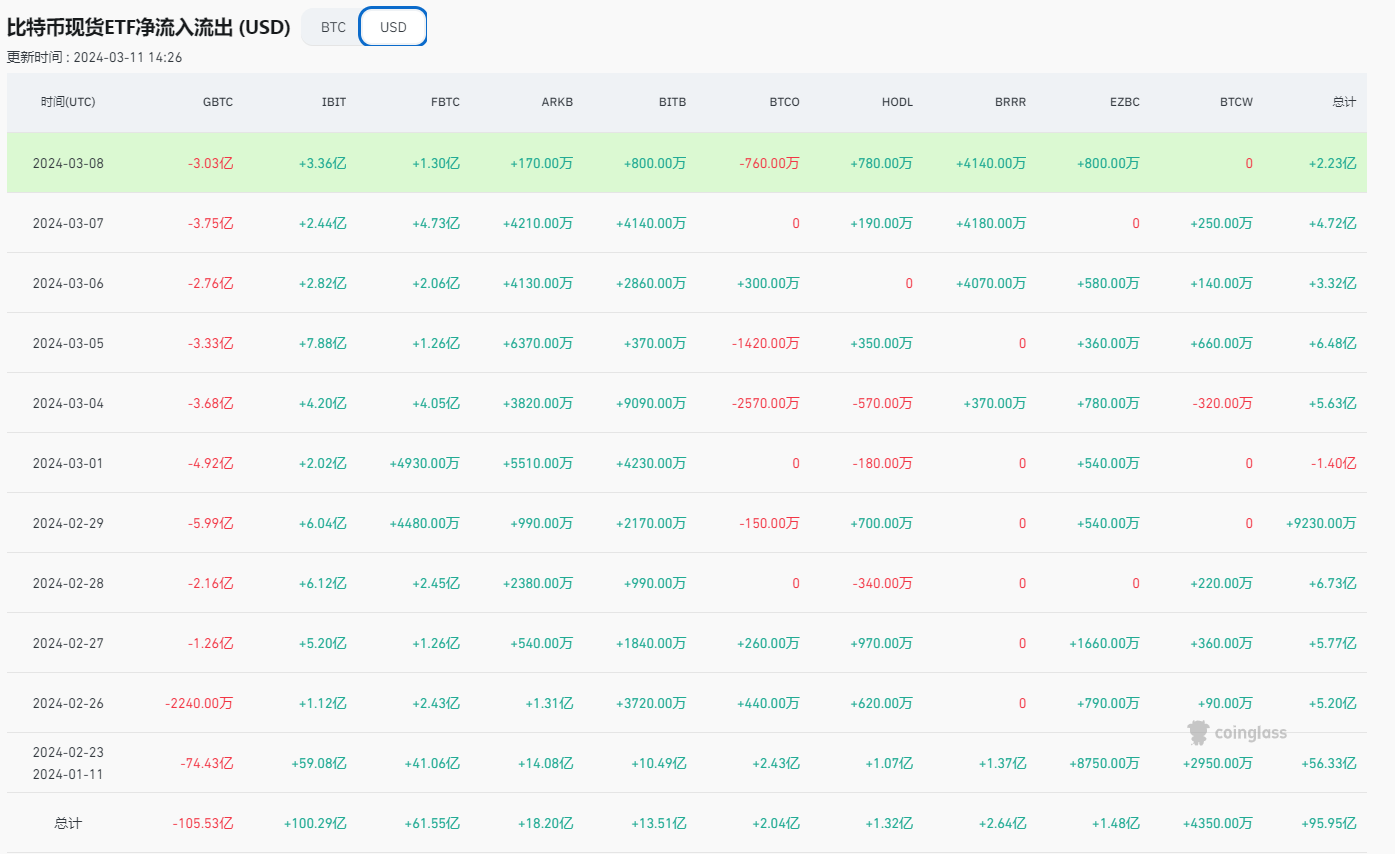
ETF inflow and outflow situation:
Grayscale GBTC had an outflow of 303 million on the 7th, with a total outflow of 10.553 billion and a total ETF net inflow of 9.595 billion.
If you like my views, please like, comment, and share. Let's go through the bull and bear markets together!!!
The article is time-sensitive and is for reference only, with real-time updates.
Focus on candlestick technical research, win-win global investment opportunities. Official account: Trading Master Fusu
免责声明:本文章仅代表作者个人观点,不代表本平台的立场和观点。本文章仅供信息分享,不构成对任何人的任何投资建议。用户与作者之间的任何争议,与本平台无关。如网页中刊载的文章或图片涉及侵权,请提供相关的权利证明和身份证明发送邮件到support@aicoin.com,本平台相关工作人员将会进行核查。


