Click to watch the video: Master Chen's 2.24 Video: Historical Bull and Bear Market Patterns, Short-term Trends, and Objective Analysis of Buying Points
Today in the video, we will discuss the recent market conditions, as well as some knowledge about bull and bear lines, including some analysis on the next buying point if Bitcoin experiences a pullback, as well as some support levels below Bitcoin and short-term trends.

First, let's take a look at the Bitcoin weekly chart, which is a very legendary bull and bear line indicator. The green line represents the 21 EMA, and the red line represents the 20 MA. We can observe that despite the recent significant increase in Bitcoin's price, it seems to be in a stagnant state at this position.
We can observe that Bitcoin started to rise from 25,000 to 26,000, and we can see that the green 21 EMA crossed above the red 20 MA. This recent uptrend is similar to the previous one when Bitcoin rose from the bottom at 15,000, where the green EMA was above the 20 MA. When it rose to a high point, we can observe that at the position of 25,000 to 26,000, I suggested that we continue to go long because the red average line crossed the green average line. It is possible that Bitcoin will consolidate for a period of time. If it drops by 10% to 20% from the high point and encounters some previous support levels, such as the neckline support, it is a buying point. So, at the current position, I have been observing these two average lines to see if Bitcoin will consolidate or if we need to continue to look for support for the next buying point.
We need to be alert in case the red line crosses above the green line or if Bitcoin's price drops, as we may need to continue to look for support for the next buying point. Therefore, we have been observing whether Bitcoin will consolidate at this position or whether we need to prevent the main force from washing out again. I am concerned that the red line may cross above the green line, and there is a possibility that Bitcoin may experience a medium-term consolidation similar to the one near 25,000 last year.

We can look at Bitcoin's bull market in history, such as in 2019 when Bitcoin bottomed out at $3,000. We can observe that it broke through the bull and bear line at this position and rose to a high point, increasing by two to three times. Then, in August 2019, the red line crossed above the green line, indicating a possible medium-term adjustment, or it could be a buying point at this position. If it weren't for the black swan event of the epidemic, it is possible that after bottoming out at this position, the green line would continue to cross above the red line, potentially opening up a bull market at this position.

Next, let's look at Bitcoin's bull market in 2015, as the current bull market in Bitcoin is very similar to the one that started at the end of 2015. The current uptrend is also similar. After breaking through the bull and bear line at the bottom in 2015, there was a subsequent uptrend to a high point. We can observe that at this position, there was a consolidation of an ascending triangle for about 200 days. In this range of the ascending triangle, due to the high increase in the previous wave, it is possible that the red line will cross above the green line at the position of consolidation, indicating that Bitcoin may be consolidating at this medium-term level. We should observe whether there are retracement lows during the consolidation structure. It is clear that retracing to the vicinity of these two bull and bear lines may be a very important buying point or a continuation of the long position.
Then, in May 2016, there was another significant uptrend. When the green line crossed above the red line at this position, it indicated that Bitcoin was currently in a very strong structure. However, after rising to a high point, we can observe that Bitcoin subsequently experienced a medium-term level adjustment. This is because the red line crossed above the green line again, indicating that the entire medium-term Bitcoin may be starting a consolidation at this position or a box consolidation. Therefore, we observe Bitcoin's bull market from 2015 to 2017, or at this position, it is the time of Bitcoin's halving of production.
From the time before and after the halving of production, we can observe that Bitcoin may have a red bull and bear line crossing the green line once, and then crossing twice, which may indicate a consolidation once and a second consolidation. After the halving of production ended, there may be a crazy bull market uptrend. We can observe that the green line afterward basically maintained above this red line, and this wave of increase also directly reached the top of Bitcoin.
Therefore, I am quite cautious about the recent Bitcoin market or the position of reaching a high point. At this position, we should try to observe whether there will be a medium-term consolidation or retracement in the previous wave. In today's article, I also mentioned that we are approaching the time of halving production. Since this wave of Bitcoin's bull market uptrend, there has already been one crossing or a medium-term consolidation. I believe that if the short-term Bitcoin price rises, there should be a second consolidation, or we should also pay attention to when this red line will cross above the green line, which may confirm whether Bitcoin is currently undergoing a medium-term consolidation. Only when Bitcoin rises to a higher price will its entire structure be very healthy.

Next, let's take a look at the Bitcoin daily chart. I have mentioned a few times in the past few days, around 53,000, which is the head and shoulders position of Bitcoin in September 2021, including December 2021. At that time, there were two shoulder positions around 53,000, creating a pressure zone. However, my view is that this is a short-term pressure zone. If Bitcoin has a medium-term adjustment or consolidation at this position, or if it is possible to retest the support at 48,000, as long as the time for consolidation is more sufficient, I believe that these pressure levels are not considered resistance. I have also mentioned the current short-term support, which is the blue 20MA in the daily chart. Because it is also a lifeline for retail investors, we should try to observe whether it can support at the current position if Bitcoin does not rise. Because this average line is still in an upward structure.
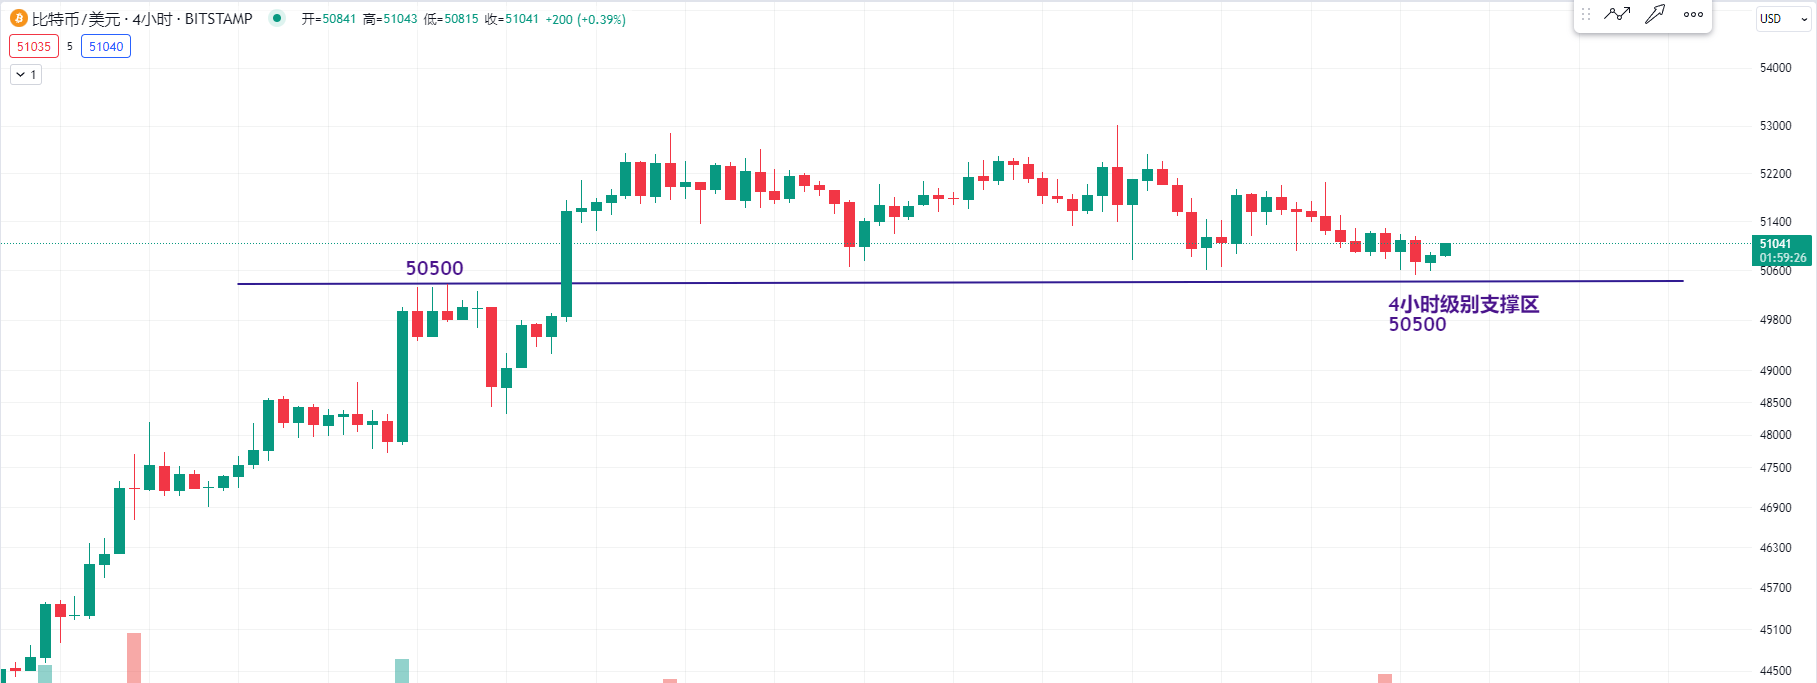
Or in the recent 4-hour chart, there has not been a significant drop. We can observe that the main support level is around the previous high point of 50,500 for Bitcoin.
For more strategies, you can join the live trading.
Candlesticks are king, trends are emperor. I am Master Chen, focusing on BTC and ETH spot contracts for many years. There is no 100% method, only 100% trend following. I update macro analysis articles and technical analysis review videos daily across the entire network.  Friendly reminder: Only the official public account (shown in the image above) is written by Master Chen. The advertisements at the end of the article and in the comments section are not related to me personally! Please be cautious in distinguishing between true and false. Thank you for reading.
免责声明:本文章仅代表作者个人观点,不代表本平台的立场和观点。本文章仅供信息分享,不构成对任何人的任何投资建议。用户与作者之间的任何争议,与本平台无关。如网页中刊载的文章或图片涉及侵权,请提供相关的权利证明和身份证明发送邮件到support@aicoin.com,本平台相关工作人员将会进行核查。


