Watch the video: Bitcoin Market Analysis 2023.12.28
BTC Daily Chart:
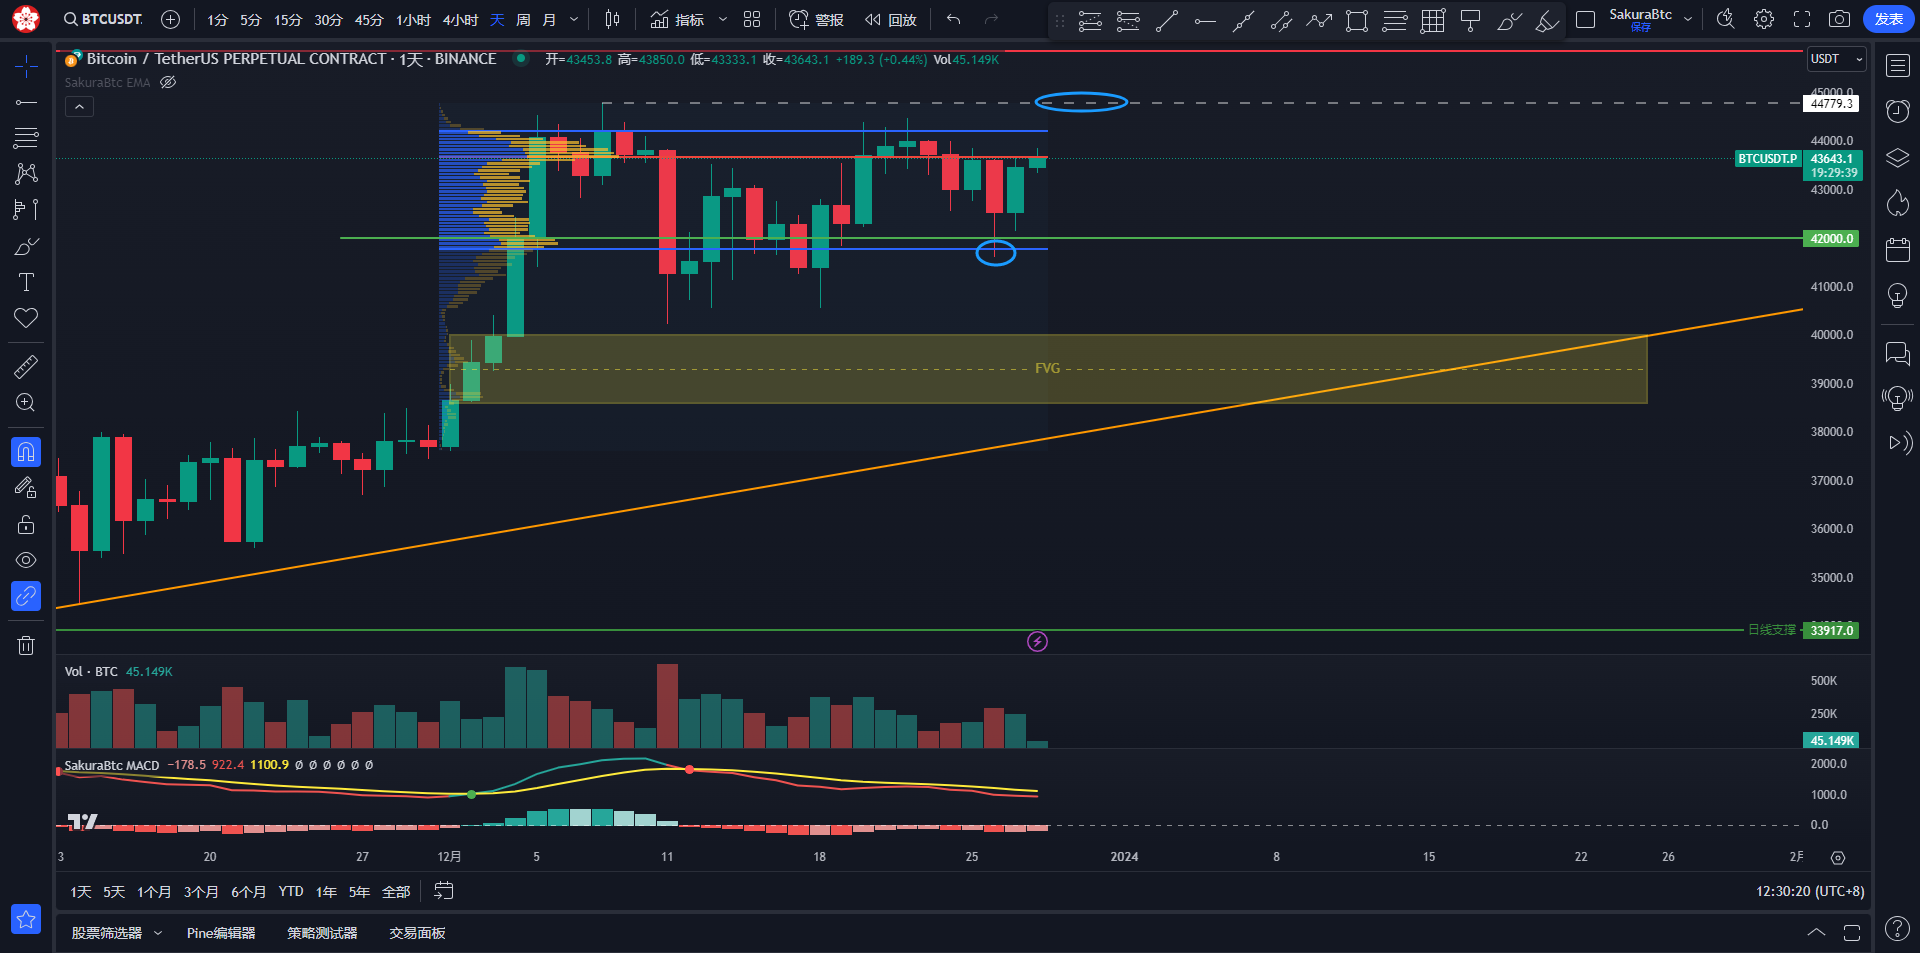
From the daily chart perspective, yesterday closed with a bullish candle. In this large consolidation range, we can take a look at the volume distribution chart. The market retraced to the VAL line the day before yesterday and found support, then rebounded. Currently, the market is being suppressed by the POC line. We need to pay attention to the breakthrough of this line. If the market successfully breaks through, there is a significant high point to focus on above the market. If the market breaks through this high point today and immediately falls back, I believe it would be a very good shorting opportunity. Above the market, there is a key position, which is the 0.618 retracement level of the weekly chart at 48600, and above that is the psychological level of 50000. These levels are likely to be the high points of this round of the small bull market that started this year.
BTC 4-hour Chart:

Looking at the 4-hour chart, the market dropped to a low point and then rebounded. Currently, the market has retraced to the resistance at the 0.618 and 0.66 levels. We need to pay attention to the support at this level and the 0.618 retracement level of this upward trend. If the market finds support at this level, we can enter long positions with the trend. Otherwise, it could indicate a change in the bearish trend, testing the low point from yesterday and the support of some low points below the market.
BTC 1-hour Chart:

Looking at the 1-hour chart, we need to pay attention to the situation of the EMA. Currently, the EMA10 has crossed above the EMA40, and has successfully held the position of the EMA120. The market has been supported by the EMA10, and is currently supported by this line as well. Therefore, I believe the market is still in a relatively strong uptrend. Although the high point is suppressed by the 0.618 and 0.66 retracement levels I mentioned earlier, as long as the market does not fall below the EMA120 on the 1-hour chart, I consider it to be a strong trend. If the market falls below this line, I may consider taking a short position.
In summary, for today's market, we need to pay close attention to the support at 42730. If the market is supported, we can enter long positions with the trend. We also need to pay attention to the breakthrough of 44800 above the market. If the market falsely breaks through, we can enter short positions with the trend.
Feel free to discuss any aspects of today's market. Thank you.

Risk Warning: This platform promises to provide professional information services. The content provided by this platform is for reference only and should not be considered as investment advice. At the same time, this platform does not promise investors any profits, nor does it agree to share investment profits or bear investment losses with investors. The market carries risks, so investment should be approached with caution.
免责声明:本文章仅代表作者个人观点,不代表本平台的立场和观点。本文章仅供信息分享,不构成对任何人的任何投资建议。用户与作者之间的任何争议,与本平台无关。如网页中刊载的文章或图片涉及侵权,请提供相关的权利证明和身份证明发送邮件到support@aicoin.com,本平台相关工作人员将会进行核查。


